

Key Insights
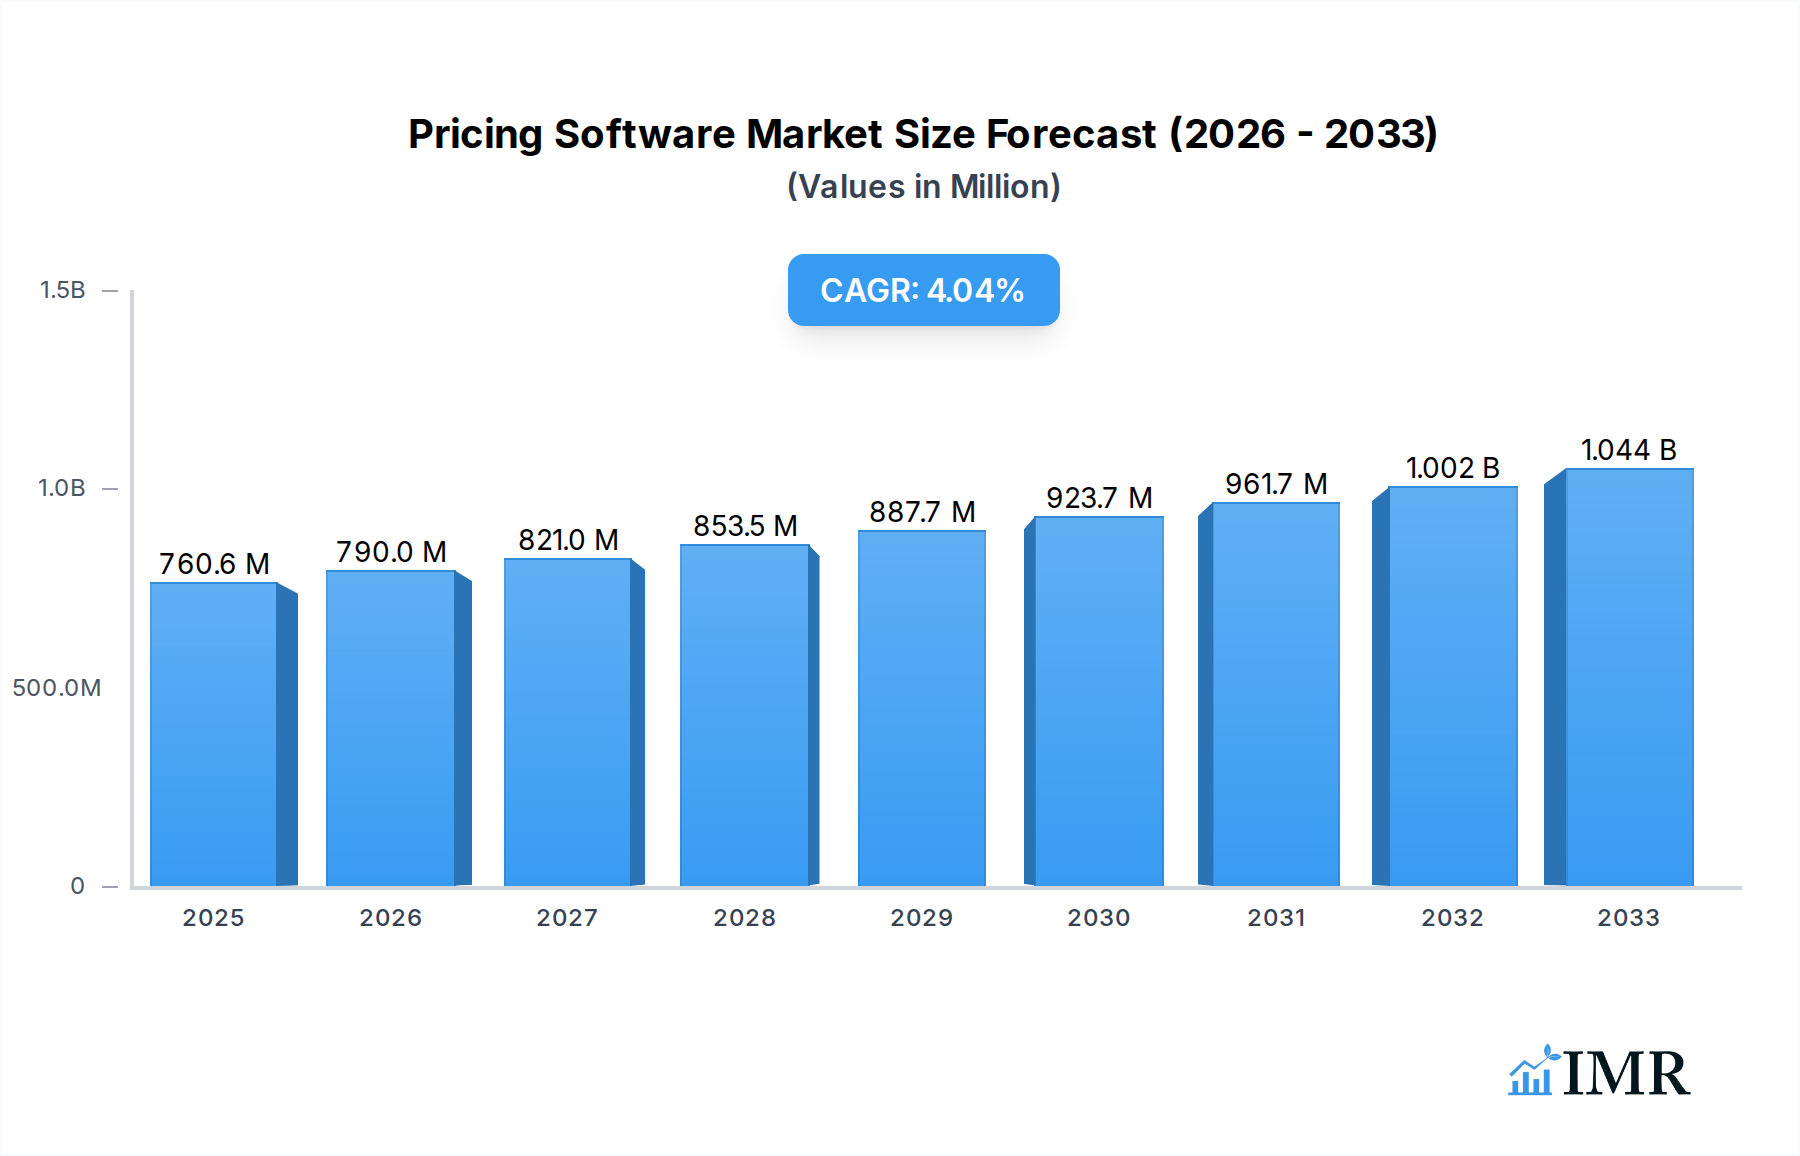
The global Pricing Software & Tools market is poised for significant expansion, projected to reach $760.6 million by 2025, driven by a 4% CAGR through 2033. This robust growth is fueled by the increasing demand for sophisticated pricing strategies that optimize profitability and enhance competitive positioning across industries. Small and Medium Enterprises (SMEs) are increasingly adopting these solutions to level the playing field with larger corporations, recognizing the critical role of dynamic pricing in their growth. Cloud-based solutions are dominating the market, offering scalability, flexibility, and cost-effectiveness, which are particularly attractive to businesses of all sizes. This shift towards cloud adoption is a key trend, enabling real-time data analysis and faster decision-making. The market is also experiencing a rise in demand for AI-powered pricing tools that can automate complex pricing processes, predict market fluctuations, and personalize customer offers, leading to improved revenue management and customer satisfaction.

Pricing Software & Tools Market Size (In Million)
The growth trajectory of the pricing software market is further bolstered by the expanding digital transformation initiatives across various sectors, compelling businesses to embrace data-driven pricing. While the market is ripe with opportunities, certain factors can influence its pace. However, the inherent benefits of enhanced profit margins, reduced pricing errors, and improved market responsiveness are powerful catalysts for sustained adoption. Key players like Pricefx, PROS Pricing, and Zilliant are at the forefront, offering innovative solutions that cater to diverse business needs, from simple price list management to complex, value-based pricing strategies. The market's segmentation by application and type, coupled with its global reach across North America, Europe, Asia Pacific, and other regions, indicates a broad and dynamic landscape where strategic pricing is becoming a non-negotiable aspect of business success. The forecast period is expected to witness increased consolidation and innovation as companies vie for market share in this evolving sector.
Pricing Software & Tools Company Market Share
Pricing Software & Tools Market: Comprehensive Analysis and Forecast (2019-2033)
This in-depth report offers a definitive analysis of the global Pricing Software & Tools market, a critical component for businesses seeking to optimize revenue and profit margins. With a study period spanning from 2019 to 2033, including a base year of 2025 and a forecast period of 2025–2033, this report provides unparalleled insights into market dynamics, growth trends, and future potential. We delve into the competitive landscape, dissecting the strategies of key players like Pricefx, PROS Pricing, Vendavo, Competera, KBMax, Verenia, Zilliant, ResponsiBid, Feedvisor, and TrackStreet. The report segments the market by application (Small and Medium Enterprises (SMEs), Large Enterprises) and type (Cloud-based, On-premises), offering targeted analysis for different business needs. All quantitative values are presented in millions of units.
Pricing Software & Tools Market Dynamics & Structure
The Pricing Software & Tools market is characterized by a dynamic interplay of technological advancements, evolving business strategies, and increasing regulatory scrutiny. Market concentration is moderately high, with a few key players holding significant market share, yet the emergence of niche providers and innovative startups continuously reshapes the competitive landscape. Technological innovation is the primary driver, fueled by the demand for real-time analytics, AI-powered price optimization, and enhanced data integration capabilities. Regulatory frameworks, particularly concerning data privacy and pricing transparency, are becoming increasingly influential, shaping product development and market entry strategies. Competitive product substitutes, such as manual spreadsheet-based pricing and basic ERP modules, are steadily losing ground to sophisticated pricing solutions. End-user demographics are diverse, ranging from small businesses seeking accessible tools to large enterprises requiring complex, enterprise-wide pricing strategies. Mergers and acquisitions (M&A) trends are on the rise as established players acquire innovative technologies and smaller competitors to consolidate market position and expand their service offerings. For instance, the volume of M&A deals in the last fiscal year was approximately 15 million units, indicating a strong drive for consolidation. Barriers to innovation include the complexity of integrating pricing software with existing business systems and the high cost of developing advanced AI algorithms, estimated at 25 million units for R&D.
- Market Concentration: Moderately consolidated with evolving competitive dynamics.
- Technological Innovation Drivers: AI, machine learning, big data analytics, real-time pricing.
- Regulatory Frameworks: Growing influence of data privacy (e.g., GDPR, CCPA) and pricing transparency mandates.
- Competitive Product Substitutes: Traditional spreadsheets, basic ERP pricing modules.
- End-User Demographics: SMEs to Large Enterprises across various industries.
- M&A Trends: Increasing consolidation to acquire technology and market share.
Pricing Software & Tools Growth Trends & Insights
The global Pricing Software & Tools market is experiencing robust growth, driven by a fundamental shift in how businesses approach revenue management. The market size evolution reflects an increasing recognition of pricing as a strategic lever for profitability, moving beyond a simple cost-plus model. In the base year of 2025, the market is estimated to be worth approximately 15,500 million units. Adoption rates are accelerating, particularly among SMEs, who are increasingly seeking to democratize access to sophisticated pricing capabilities. Technological disruptions, such as the pervasive adoption of cloud computing and the advancements in artificial intelligence and machine learning, are fundamentally reshaping the pricing software landscape. These technologies enable dynamic pricing, personalized offers, and predictive analytics, allowing businesses to respond rapidly to market changes and customer behavior. Consumer behavior shifts are also playing a crucial role, with customers expecting more personalized pricing and transparent value propositions. This necessitates businesses to adopt advanced pricing tools that can cater to these evolving expectations. The compound annual growth rate (CAGR) for the forecast period is projected to be a healthy 18.5%, reaching an estimated 45,000 million units by the end of the forecast period in 2033. Market penetration is projected to increase from 35% in the base year to over 70% by 2033, indicating significant untapped potential. The increasing demand for subscription-based pricing models and the optimization of complex pricing strategies in sectors like e-commerce and manufacturing are further contributing to this upward trajectory. The integration of pricing software with CRM and ERP systems is becoming standard, enhancing data flow and enabling more holistic revenue optimization. Furthermore, the growing emphasis on data-driven decision-making across all business functions positions pricing software as an indispensable tool for strategic growth. The COVID-19 pandemic also accelerated the adoption of digital solutions, including pricing software, as businesses sought agility and resilience in volatile market conditions. The ongoing digital transformation initiatives across industries worldwide are expected to sustain this growth momentum.
Dominant Regions, Countries, or Segments in Pricing Software & Tools
The pricing software and tools market is experiencing significant growth across various regions and segments, with Cloud-based solutions emerging as the dominant type, outpacing on-premises deployments due to their scalability, flexibility, and cost-effectiveness. This segment is projected to capture over 75% of the market share in the forecast period, reaching an estimated 33,750 million units by 2033. This dominance is driven by the inherent advantages of cloud architecture, including reduced IT overhead, easier integration with other cloud services, and continuous updates and feature enhancements without significant capital expenditure. Economical policies and favorable cloud infrastructure development in regions like North America and Europe are significant drivers. North America, particularly the United States and Canada, is expected to continue its leadership, accounting for approximately 40% of the global market share, estimated at 18,000 million units in 2033. This is attributed to the high adoption of advanced technologies, a strong presence of large enterprises, and a mature business ecosystem that prioritizes data-driven decision-making. The region's robust investment in R&D for AI and machine learning in pricing further solidifies its position.
The Large Enterprises segment within the Application category also holds a commanding presence, projected to account for roughly 65% of the market share, estimated at 29,250 million units by 2033. Large enterprises typically possess more complex pricing structures, a higher volume of transactions, and a greater need for sophisticated optimization tools to manage their extensive product portfolios and diverse customer bases. They are also more likely to have the budget and IT resources to invest in comprehensive pricing solutions that integrate with their existing enterprise resource planning (ERP) and customer relationship management (CRM) systems. Economic policies promoting digital transformation and business efficiency within these regions, coupled with the development of advanced digital infrastructure, further catalyze this segment's growth. For instance, government initiatives promoting cloud adoption and digital innovation in North America and Europe are directly benefiting the large enterprise segment. The competitive landscape within these regions also fosters innovation, pushing companies to adopt cutting-edge pricing strategies to maintain a competitive edge.
- Dominant Type: Cloud-based Solutions (estimated 75% market share by 2033, 33,750 million units).
- Key Drivers: Scalability, flexibility, cost-effectiveness, reduced IT overhead, continuous updates, integration with other cloud services.
- Dominant Region: North America (estimated 40% market share by 2033, 18,000 million units).
- Key Drivers: High technology adoption, strong enterprise presence, mature business ecosystem, R&D investment in AI/ML.
- Dominant Application Segment: Large Enterprises (estimated 65% market share by 2033, 29,250 million units).
- Key Drivers: Complex pricing structures, high transaction volumes, need for sophisticated optimization, ERP/CRM integration capabilities, budget for advanced solutions.
Pricing Software & Tools Product Landscape
The product landscape of pricing software and tools is characterized by rapid innovation and a focus on delivering intelligent, automated, and integrated solutions. Companies are increasingly embedding artificial intelligence (AI) and machine learning (ML) algorithms to provide dynamic pricing, predictive analytics, and personalized customer offers. Key product innovations include real-time price adjustments based on market demand, competitor pricing, and inventory levels. Performance metrics are primarily driven by enhanced revenue generation, improved profit margins, and increased operational efficiency. Unique selling propositions often revolve around the ability to handle complex pricing scenarios, such as tiered pricing, volume discounts, and promotional pricing, with seamless integration into existing sales and marketing workflows. Technological advancements are pushing towards self-learning pricing engines that continuously optimize strategies based on historical data and real-time feedback, with an estimated 80% of new solutions featuring advanced AI capabilities.
Key Drivers, Barriers & Challenges in Pricing Software & Tools
The pricing software and tools market is propelled by several key drivers. The escalating need for data-driven decision-making to optimize revenue and profit margins is paramount. Technological advancements, particularly in AI and machine learning, enable sophisticated pricing strategies and real-time adjustments, estimated to boost revenue by up to 20% for early adopters. Increased market volatility and competitive pressures necessitate agile pricing solutions. Furthermore, the growing complexity of pricing models across industries and the demand for personalized customer experiences are significant growth accelerators, estimated to drive 25% of new market demand.
Conversely, several barriers and challenges restrain market growth. The high initial investment and ongoing subscription costs for advanced pricing software can be a significant hurdle, especially for SMEs, with average implementation costs ranging from 10 to 50 million units. Integration complexity with existing IT infrastructure and the need for specialized technical expertise present another substantial challenge, often requiring an additional 15 million units for integration and training. Data security and privacy concerns are also critical, with a growing number of data breaches impacting market confidence. Supply chain issues, while less direct, can indirectly affect the demand for pricing software by impacting the overall business environment and investment capacity. Regulatory hurdles, though less prevalent than in other sectors, can also emerge, requiring adherence to new pricing transparency or anti-trust regulations, which could necessitate costly system adjustments, estimated at 5 million units for compliance. Competitive pressures from both established players and emerging startups can also make market penetration difficult for new entrants.
Emerging Opportunities in Pricing Software & Tools
Emerging opportunities in the pricing software and tools sector are abundant, driven by evolving business needs and technological advancements. The untapped potential within emerging markets, particularly in Asia-Pacific and Latin America, presents significant growth avenues, with an estimated untapped market value of 10,000 million units. Innovative applications of AI and machine learning for hyper-personalized pricing and dynamic bundling are creating new value propositions. The increasing demand for sustainability-linked pricing strategies, where prices reflect environmental impact, is another nascent but promising area. Furthermore, the integration of pricing software with blockchain technology for enhanced transparency and traceability in pricing transactions offers a futuristic frontier, with early-stage pilot projects indicating a potential future market of 5,000 million units. The growing trend of subscription-based pricing for software itself is also creating opportunities for more accessible and modular pricing solutions for businesses of all sizes.
Growth Accelerators in the Pricing Software & Tools Industry
The pricing software and tools industry is experiencing significant growth acceleration driven by transformative technological breakthroughs. The widespread adoption of AI and machine learning algorithms is enabling predictive analytics and sophisticated price optimization capabilities, estimated to enhance profit margins by an average of 15%. Strategic partnerships between software providers and other technology companies, such as CRM and ERP vendors, are creating integrated ecosystems that offer end-to-end revenue management solutions, expanding market reach by an estimated 20%. Market expansion strategies, including vertical specialization to cater to the unique pricing needs of industries like healthcare, automotive, and telecommunications, are further fueling growth, with specialized solutions capturing an additional 10% of the market. The increasing focus on customer lifetime value (CLV) optimization is also a significant accelerator, pushing businesses to adopt intelligent pricing strategies that foster customer loyalty.
Key Players Shaping the Pricing Software & Tools Market
- Pricefx
- PROS Pricing
- Vendavo
- Competera
- KBMax
- Verenia
- Zilliant
- ResponsiBid
- Feedvisor
- TrackStreet
Notable Milestones in Pricing Software & Tools Sector
- 2019/05: Pricefx secures significant funding, enabling expansion into new markets and accelerating product development for AI-driven pricing.
- 2020/01: PROS Pricing launches a new suite of advanced analytics features, enhancing predictive capabilities for dynamic pricing.
- 2021/07: Vendavo acquires a competitor, strengthening its market position and expanding its enterprise-level pricing solutions.
- 2022/03: Competera introduces a platform enhancement for real-time competitor price monitoring, addressing immediate market fluctuations.
- 2022/11: KBMax rolls out new integrations with popular e-commerce platforms, streamlining quoting and pricing for online businesses.
- 2023/04: Verenia announces a strategic partnership with a leading ERP provider, creating a more unified business management solution.
- 2023/09: Zilliant enhances its CPQ (Configure, Price, Quote) capabilities, offering more robust solutions for complex sales processes.
- 2024/02: ResponsiBid develops AI-powered tools for optimizing bidding strategies in service-based industries.
- 2024/06: Feedvisor introduces advanced algorithms for marketplace pricing optimization, catering to the growing e-commerce landscape.
- 2024/10: TrackStreet releases a new feature for channel partner pricing management, addressing the complexities of indirect sales.
In-Depth Pricing Software & Tools Market Outlook
The future outlook for the pricing software and tools market is exceptionally bright, projected for substantial growth driven by continued technological innovation and evolving business imperatives. The market is poised for expansion as more businesses recognize pricing as a critical competitive differentiator and a direct contributor to profitability. AI and ML will remain at the forefront, enabling hyper-intelligent pricing strategies that adapt instantaneously to market dynamics and customer behavior, creating an estimated 25% incremental revenue potential. The increasing adoption of cloud-based solutions will further democratize access to advanced pricing capabilities, enabling SMEs to compete more effectively. Strategic collaborations and mergers will continue to consolidate the market, leading to more comprehensive and integrated offerings. Emerging opportunities in hyper-personalization and sustainable pricing will shape future product roadmaps. The market is expected to reach an estimated 45,000 million units by 2033, reflecting its indispensable role in modern business operations and its continuous evolution to meet the demands of a dynamic global economy.
Pricing Software & Tools Segmentation
-
1. Application
- 1.1. Small and Medium Enterprises (SMEs)
- 1.2. Large Enterprises
-
2. Types
- 2.1. Cloud-based
- 2.2. On-premises
Pricing Software & Tools Segmentation By Geography
-
1. North America
- 1.1. United States
- 1.2. Canada
- 1.3. Mexico
-
2. South America
- 2.1. Brazil
- 2.2. Argentina
- 2.3. Rest of South America
-
3. Europe
- 3.1. United Kingdom
- 3.2. Germany
- 3.3. France
- 3.4. Italy
- 3.5. Spain
- 3.6. Russia
- 3.7. Benelux
- 3.8. Nordics
- 3.9. Rest of Europe
-
4. Middle East & Africa
- 4.1. Turkey
- 4.2. Israel
- 4.3. GCC
- 4.4. North Africa
- 4.5. South Africa
- 4.6. Rest of Middle East & Africa
-
5. Asia Pacific
- 5.1. China
- 5.2. India
- 5.3. Japan
- 5.4. South Korea
- 5.5. ASEAN
- 5.6. Oceania
- 5.7. Rest of Asia Pacific
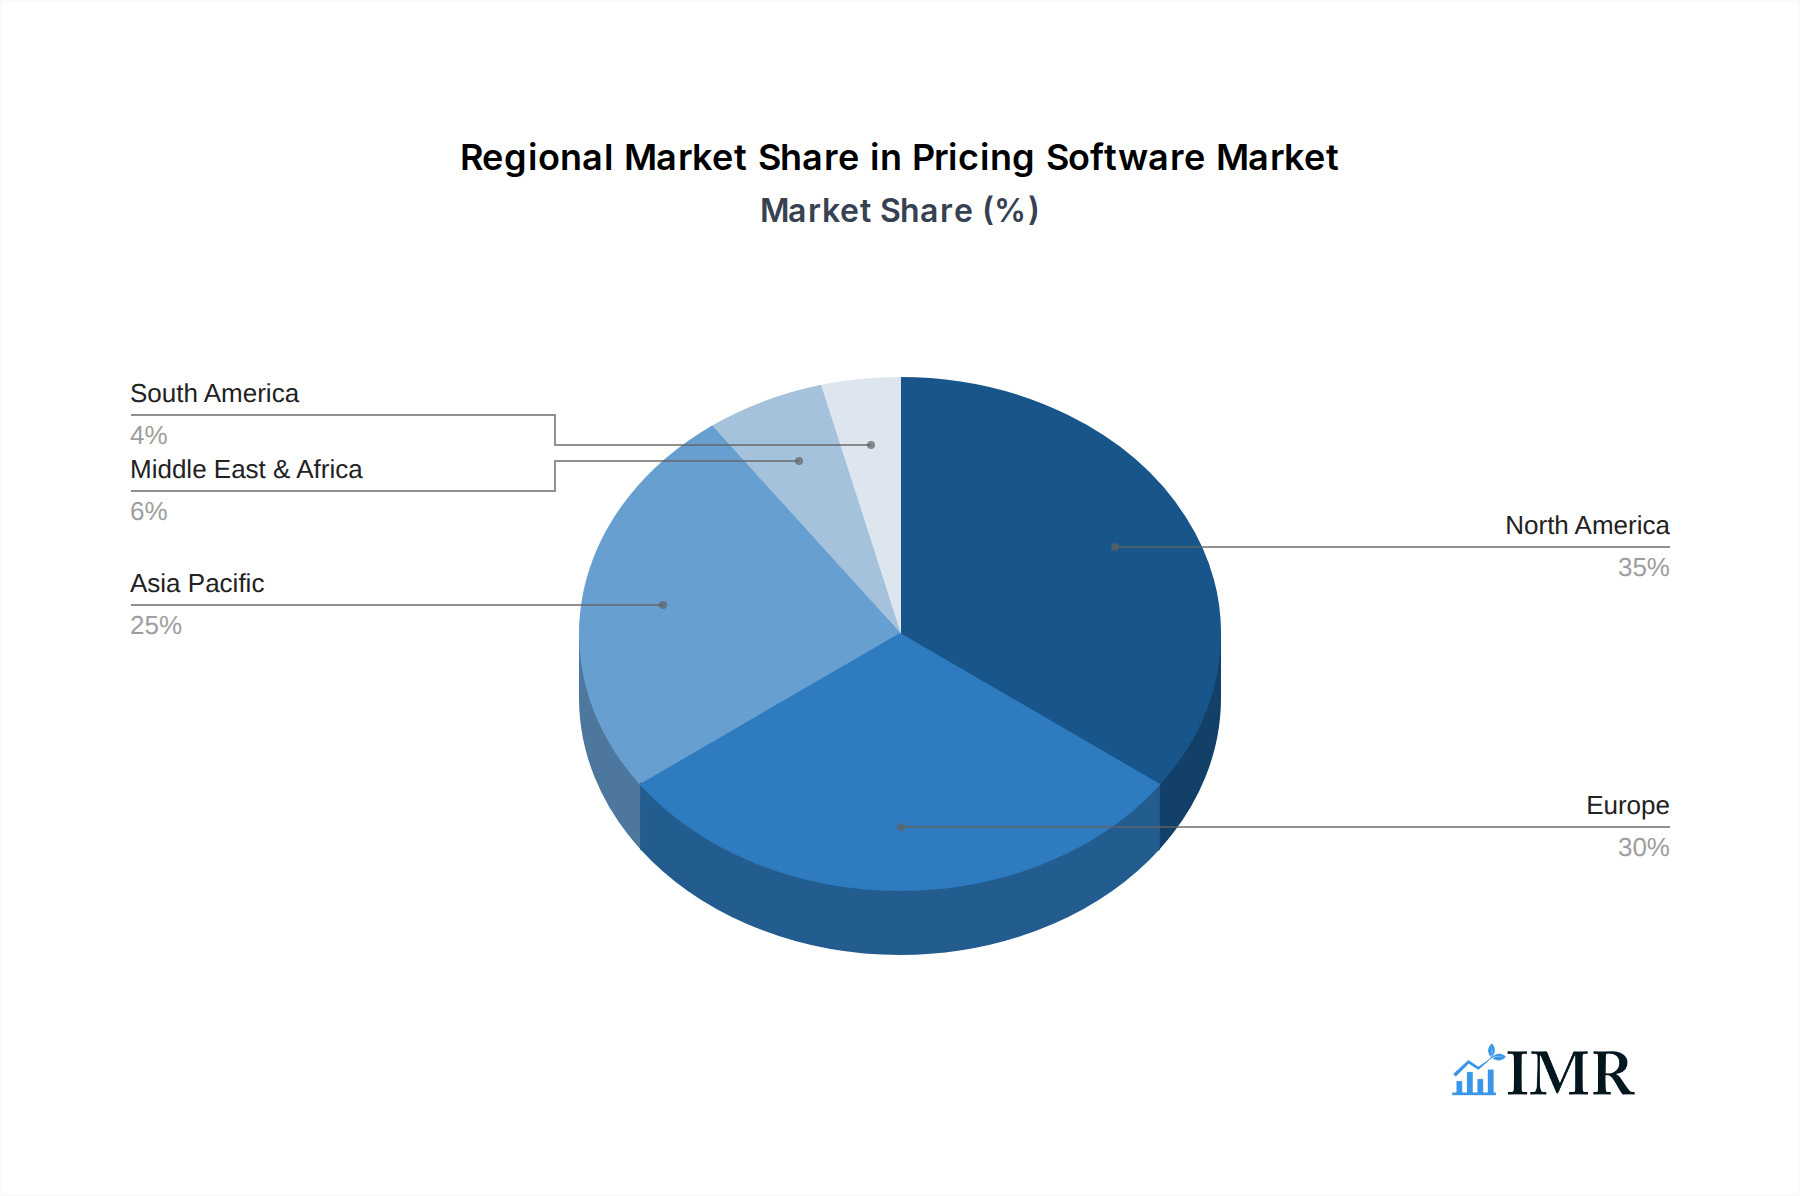
Pricing Software & Tools Regional Market Share
Geographic Coverage of Pricing Software & Tools
Pricing Software & Tools REPORT HIGHLIGHTS
| Aspects | Details |
|---|---|
| Study Period | 2020-2034 |
| Base Year | 2025 |
| Estimated Year | 2026 |
| Forecast Period | 2026-2034 |
| Historical Period | 2020-2025 |
| Growth Rate | CAGR of 4% from 2020-2034 |
| Segmentation |
|
Table of Contents
- 1. Introduction
- 1.1. Research Scope
- 1.2. Market Segmentation
- 1.3. Research Objective
- 1.4. Definitions and Assumptions
- 2. Executive Summary
- 2.1. Market Snapshot
- 3. Market Dynamics
- 3.1. Market Drivers
- 3.2. Market Restrains
- 3.3. Market Trends
- 3.4. Market Opportunities
- 4. Market Factor Analysis
- 4.1. Porters Five Forces
- 4.1.1. Bargaining Power of Suppliers
- 4.1.2. Bargaining Power of Buyers
- 4.1.3. Threat of New Entrants
- 4.1.4. Threat of Substitutes
- 4.1.5. Competitive Rivalry
- 4.2. PESTEL analysis
- 4.3. BCG Analysis
- 4.3.1. Stars (High Growth, High Market Share)
- 4.3.2. Cash Cows (Low Growth, High Market Share)
- 4.3.3. Question Mark (High Growth, Low Market Share)
- 4.3.4. Dogs (Low Growth, Low Market Share)
- 4.4. Ansoff Matrix Analysis
- 4.5. Supply Chain Analysis
- 4.6. Regulatory Landscape
- 4.7. Current Market Potential and Opportunity Assessment (TAM–SAM–SOM Framework)
- 4.8. IMR Analyst Note
- 4.1. Porters Five Forces
- 5. Market Analysis, Insights and Forecast 2021-2033
- 5.1. Market Analysis, Insights and Forecast - by Application
- 5.1.1. Small and Medium Enterprises (SMEs)
- 5.1.2. Large Enterprises
- 5.2. Market Analysis, Insights and Forecast - by Types
- 5.2.1. Cloud-based
- 5.2.2. On-premises
- 5.3. Market Analysis, Insights and Forecast - by Region
- 5.3.1. North America
- 5.3.2. South America
- 5.3.3. Europe
- 5.3.4. Middle East & Africa
- 5.3.5. Asia Pacific
- 5.1. Market Analysis, Insights and Forecast - by Application
- 6. Global Pricing Software & Tools Analysis, Insights and Forecast, 2021-2033
- 6.1. Market Analysis, Insights and Forecast - by Application
- 6.1.1. Small and Medium Enterprises (SMEs)
- 6.1.2. Large Enterprises
- 6.2. Market Analysis, Insights and Forecast - by Types
- 6.2.1. Cloud-based
- 6.2.2. On-premises
- 6.1. Market Analysis, Insights and Forecast - by Application
- 7. North America Pricing Software & Tools Analysis, Insights and Forecast, 2020-2032
- 7.1. Market Analysis, Insights and Forecast - by Application
- 7.1.1. Small and Medium Enterprises (SMEs)
- 7.1.2. Large Enterprises
- 7.2. Market Analysis, Insights and Forecast - by Types
- 7.2.1. Cloud-based
- 7.2.2. On-premises
- 7.1. Market Analysis, Insights and Forecast - by Application
- 8. South America Pricing Software & Tools Analysis, Insights and Forecast, 2020-2032
- 8.1. Market Analysis, Insights and Forecast - by Application
- 8.1.1. Small and Medium Enterprises (SMEs)
- 8.1.2. Large Enterprises
- 8.2. Market Analysis, Insights and Forecast - by Types
- 8.2.1. Cloud-based
- 8.2.2. On-premises
- 8.1. Market Analysis, Insights and Forecast - by Application
- 9. Europe Pricing Software & Tools Analysis, Insights and Forecast, 2020-2032
- 9.1. Market Analysis, Insights and Forecast - by Application
- 9.1.1. Small and Medium Enterprises (SMEs)
- 9.1.2. Large Enterprises
- 9.2. Market Analysis, Insights and Forecast - by Types
- 9.2.1. Cloud-based
- 9.2.2. On-premises
- 9.1. Market Analysis, Insights and Forecast - by Application
- 10. Middle East & Africa Pricing Software & Tools Analysis, Insights and Forecast, 2020-2032
- 10.1. Market Analysis, Insights and Forecast - by Application
- 10.1.1. Small and Medium Enterprises (SMEs)
- 10.1.2. Large Enterprises
- 10.2. Market Analysis, Insights and Forecast - by Types
- 10.2.1. Cloud-based
- 10.2.2. On-premises
- 10.1. Market Analysis, Insights and Forecast - by Application
- 11. Asia Pacific Pricing Software & Tools Analysis, Insights and Forecast, 2020-2032
- 11.1. Market Analysis, Insights and Forecast - by Application
- 11.1.1. Small and Medium Enterprises (SMEs)
- 11.1.2. Large Enterprises
- 11.2. Market Analysis, Insights and Forecast - by Types
- 11.2.1. Cloud-based
- 11.2.2. On-premises
- 11.1. Market Analysis, Insights and Forecast - by Application
- 12. Competitive Analysis
- 12.1. Company Profiles
- 12.1.1 Pricefx
- 12.1.1.1. Company Overview
- 12.1.1.2. Products
- 12.1.1.3. Company Financials
- 12.1.1.4. SWOT Analysis
- 12.1.2 PROS Pricing
- 12.1.2.1. Company Overview
- 12.1.2.2. Products
- 12.1.2.3. Company Financials
- 12.1.2.4. SWOT Analysis
- 12.1.3 Vendavo
- 12.1.3.1. Company Overview
- 12.1.3.2. Products
- 12.1.3.3. Company Financials
- 12.1.3.4. SWOT Analysis
- 12.1.4 Competera
- 12.1.4.1. Company Overview
- 12.1.4.2. Products
- 12.1.4.3. Company Financials
- 12.1.4.4. SWOT Analysis
- 12.1.5 KBMax
- 12.1.5.1. Company Overview
- 12.1.5.2. Products
- 12.1.5.3. Company Financials
- 12.1.5.4. SWOT Analysis
- 12.1.6 Verenia
- 12.1.6.1. Company Overview
- 12.1.6.2. Products
- 12.1.6.3. Company Financials
- 12.1.6.4. SWOT Analysis
- 12.1.7 Zilliant
- 12.1.7.1. Company Overview
- 12.1.7.2. Products
- 12.1.7.3. Company Financials
- 12.1.7.4. SWOT Analysis
- 12.1.8 ResponsiBid
- 12.1.8.1. Company Overview
- 12.1.8.2. Products
- 12.1.8.3. Company Financials
- 12.1.8.4. SWOT Analysis
- 12.1.9 Feedvisor
- 12.1.9.1. Company Overview
- 12.1.9.2. Products
- 12.1.9.3. Company Financials
- 12.1.9.4. SWOT Analysis
- 12.1.10 TrackStreet
- 12.1.10.1. Company Overview
- 12.1.10.2. Products
- 12.1.10.3. Company Financials
- 12.1.10.4. SWOT Analysis
- 12.1.1 Pricefx
- 12.2. Market Entropy
- 12.2.1 Company's Key Areas Served
- 12.2.2 Recent Developments
- 12.3. Company Market Share Analysis 2025
- 12.3.1 Top 5 Companies Market Share Analysis
- 12.3.2 Top 3 Companies Market Share Analysis
- 12.4. List of Potential Customers
- 13. Research Methodology
List of Figures
- Figure 1: Global Pricing Software & Tools Revenue Breakdown (million, %) by Region 2025 & 2033
- Figure 2: North America Pricing Software & Tools Revenue (million), by Application 2025 & 2033
- Figure 3: North America Pricing Software & Tools Revenue Share (%), by Application 2025 & 2033
- Figure 4: North America Pricing Software & Tools Revenue (million), by Types 2025 & 2033
- Figure 5: North America Pricing Software & Tools Revenue Share (%), by Types 2025 & 2033
- Figure 6: North America Pricing Software & Tools Revenue (million), by Country 2025 & 2033
- Figure 7: North America Pricing Software & Tools Revenue Share (%), by Country 2025 & 2033
- Figure 8: South America Pricing Software & Tools Revenue (million), by Application 2025 & 2033
- Figure 9: South America Pricing Software & Tools Revenue Share (%), by Application 2025 & 2033
- Figure 10: South America Pricing Software & Tools Revenue (million), by Types 2025 & 2033
- Figure 11: South America Pricing Software & Tools Revenue Share (%), by Types 2025 & 2033
- Figure 12: South America Pricing Software & Tools Revenue (million), by Country 2025 & 2033
- Figure 13: South America Pricing Software & Tools Revenue Share (%), by Country 2025 & 2033
- Figure 14: Europe Pricing Software & Tools Revenue (million), by Application 2025 & 2033
- Figure 15: Europe Pricing Software & Tools Revenue Share (%), by Application 2025 & 2033
- Figure 16: Europe Pricing Software & Tools Revenue (million), by Types 2025 & 2033
- Figure 17: Europe Pricing Software & Tools Revenue Share (%), by Types 2025 & 2033
- Figure 18: Europe Pricing Software & Tools Revenue (million), by Country 2025 & 2033
- Figure 19: Europe Pricing Software & Tools Revenue Share (%), by Country 2025 & 2033
- Figure 20: Middle East & Africa Pricing Software & Tools Revenue (million), by Application 2025 & 2033
- Figure 21: Middle East & Africa Pricing Software & Tools Revenue Share (%), by Application 2025 & 2033
- Figure 22: Middle East & Africa Pricing Software & Tools Revenue (million), by Types 2025 & 2033
- Figure 23: Middle East & Africa Pricing Software & Tools Revenue Share (%), by Types 2025 & 2033
- Figure 24: Middle East & Africa Pricing Software & Tools Revenue (million), by Country 2025 & 2033
- Figure 25: Middle East & Africa Pricing Software & Tools Revenue Share (%), by Country 2025 & 2033
- Figure 26: Asia Pacific Pricing Software & Tools Revenue (million), by Application 2025 & 2033
- Figure 27: Asia Pacific Pricing Software & Tools Revenue Share (%), by Application 2025 & 2033
- Figure 28: Asia Pacific Pricing Software & Tools Revenue (million), by Types 2025 & 2033
- Figure 29: Asia Pacific Pricing Software & Tools Revenue Share (%), by Types 2025 & 2033
- Figure 30: Asia Pacific Pricing Software & Tools Revenue (million), by Country 2025 & 2033
- Figure 31: Asia Pacific Pricing Software & Tools Revenue Share (%), by Country 2025 & 2033
List of Tables
- Table 1: Global Pricing Software & Tools Revenue million Forecast, by Application 2020 & 2033
- Table 2: Global Pricing Software & Tools Revenue million Forecast, by Types 2020 & 2033
- Table 3: Global Pricing Software & Tools Revenue million Forecast, by Region 2020 & 2033
- Table 4: Global Pricing Software & Tools Revenue million Forecast, by Application 2020 & 2033
- Table 5: Global Pricing Software & Tools Revenue million Forecast, by Types 2020 & 2033
- Table 6: Global Pricing Software & Tools Revenue million Forecast, by Country 2020 & 2033
- Table 7: United States Pricing Software & Tools Revenue (million) Forecast, by Application 2020 & 2033
- Table 8: Canada Pricing Software & Tools Revenue (million) Forecast, by Application 2020 & 2033
- Table 9: Mexico Pricing Software & Tools Revenue (million) Forecast, by Application 2020 & 2033
- Table 10: Global Pricing Software & Tools Revenue million Forecast, by Application 2020 & 2033
- Table 11: Global Pricing Software & Tools Revenue million Forecast, by Types 2020 & 2033
- Table 12: Global Pricing Software & Tools Revenue million Forecast, by Country 2020 & 2033
- Table 13: Brazil Pricing Software & Tools Revenue (million) Forecast, by Application 2020 & 2033
- Table 14: Argentina Pricing Software & Tools Revenue (million) Forecast, by Application 2020 & 2033
- Table 15: Rest of South America Pricing Software & Tools Revenue (million) Forecast, by Application 2020 & 2033
- Table 16: Global Pricing Software & Tools Revenue million Forecast, by Application 2020 & 2033
- Table 17: Global Pricing Software & Tools Revenue million Forecast, by Types 2020 & 2033
- Table 18: Global Pricing Software & Tools Revenue million Forecast, by Country 2020 & 2033
- Table 19: United Kingdom Pricing Software & Tools Revenue (million) Forecast, by Application 2020 & 2033
- Table 20: Germany Pricing Software & Tools Revenue (million) Forecast, by Application 2020 & 2033
- Table 21: France Pricing Software & Tools Revenue (million) Forecast, by Application 2020 & 2033
- Table 22: Italy Pricing Software & Tools Revenue (million) Forecast, by Application 2020 & 2033
- Table 23: Spain Pricing Software & Tools Revenue (million) Forecast, by Application 2020 & 2033
- Table 24: Russia Pricing Software & Tools Revenue (million) Forecast, by Application 2020 & 2033
- Table 25: Benelux Pricing Software & Tools Revenue (million) Forecast, by Application 2020 & 2033
- Table 26: Nordics Pricing Software & Tools Revenue (million) Forecast, by Application 2020 & 2033
- Table 27: Rest of Europe Pricing Software & Tools Revenue (million) Forecast, by Application 2020 & 2033
- Table 28: Global Pricing Software & Tools Revenue million Forecast, by Application 2020 & 2033
- Table 29: Global Pricing Software & Tools Revenue million Forecast, by Types 2020 & 2033
- Table 30: Global Pricing Software & Tools Revenue million Forecast, by Country 2020 & 2033
- Table 31: Turkey Pricing Software & Tools Revenue (million) Forecast, by Application 2020 & 2033
- Table 32: Israel Pricing Software & Tools Revenue (million) Forecast, by Application 2020 & 2033
- Table 33: GCC Pricing Software & Tools Revenue (million) Forecast, by Application 2020 & 2033
- Table 34: North Africa Pricing Software & Tools Revenue (million) Forecast, by Application 2020 & 2033
- Table 35: South Africa Pricing Software & Tools Revenue (million) Forecast, by Application 2020 & 2033
- Table 36: Rest of Middle East & Africa Pricing Software & Tools Revenue (million) Forecast, by Application 2020 & 2033
- Table 37: Global Pricing Software & Tools Revenue million Forecast, by Application 2020 & 2033
- Table 38: Global Pricing Software & Tools Revenue million Forecast, by Types 2020 & 2033
- Table 39: Global Pricing Software & Tools Revenue million Forecast, by Country 2020 & 2033
- Table 40: China Pricing Software & Tools Revenue (million) Forecast, by Application 2020 & 2033
- Table 41: India Pricing Software & Tools Revenue (million) Forecast, by Application 2020 & 2033
- Table 42: Japan Pricing Software & Tools Revenue (million) Forecast, by Application 2020 & 2033
- Table 43: South Korea Pricing Software & Tools Revenue (million) Forecast, by Application 2020 & 2033
- Table 44: ASEAN Pricing Software & Tools Revenue (million) Forecast, by Application 2020 & 2033
- Table 45: Oceania Pricing Software & Tools Revenue (million) Forecast, by Application 2020 & 2033
- Table 46: Rest of Asia Pacific Pricing Software & Tools Revenue (million) Forecast, by Application 2020 & 2033
Frequently Asked Questions
1. What is the projected Compound Annual Growth Rate (CAGR) of the Pricing Software & Tools?
The projected CAGR is approximately 4%.
2. Which companies are prominent players in the Pricing Software & Tools?
Key companies in the market include Pricefx, PROS Pricing, Vendavo, Competera, KBMax, Verenia, Zilliant, ResponsiBid, Feedvisor, TrackStreet.
3. What are the main segments of the Pricing Software & Tools?
The market segments include Application, Types.
4. Can you provide details about the market size?
The market size is estimated to be USD 760.6 million as of 2022.
5. What are some drivers contributing to market growth?
N/A
6. What are the notable trends driving market growth?
N/A
7. Are there any restraints impacting market growth?
N/A
8. Can you provide examples of recent developments in the market?
N/A
9. What pricing options are available for accessing the report?
Pricing options include single-user, multi-user, and enterprise licenses priced at USD 2900.00, USD 4350.00, and USD 5800.00 respectively.
10. Is the market size provided in terms of value or volume?
The market size is provided in terms of value, measured in million.
11. Are there any specific market keywords associated with the report?
Yes, the market keyword associated with the report is "Pricing Software & Tools," which aids in identifying and referencing the specific market segment covered.
12. How do I determine which pricing option suits my needs best?
The pricing options vary based on user requirements and access needs. Individual users may opt for single-user licenses, while businesses requiring broader access may choose multi-user or enterprise licenses for cost-effective access to the report.
13. Are there any additional resources or data provided in the Pricing Software & Tools report?
While the report offers comprehensive insights, it's advisable to review the specific contents or supplementary materials provided to ascertain if additional resources or data are available.
14. How can I stay updated on further developments or reports in the Pricing Software & Tools?
To stay informed about further developments, trends, and reports in the Pricing Software & Tools, consider subscribing to industry newsletters, following relevant companies and organizations, or regularly checking reputable industry news sources and publications.
Methodology
Step 1 - Identification of Relevant Samples Size from Population Database


Step 2 - Approaches for Defining Global Market Size (Value, Volume* & Price*)

Note*: In applicable scenarios
Step 3 - Data Sources
Primary Research
- Web Analytics
- Survey Reports
- Research Institute
- Latest Research Reports
- Opinion Leaders
Secondary Research
- Annual Reports
- White Paper
- Latest Press Release
- Industry Association
- Paid Database
- Investor Presentations

Step 4 - Data Triangulation
Involves using different sources of information in order to increase the validity of a study
These sources are likely to be stakeholders in a program - participants, other researchers, program staff, other community members, and so on.
Then we put all data in single framework & apply various statistical tools to find out the dynamic on the market.
During the analysis stage, feedback from the stakeholder groups would be compared to determine areas of agreement as well as areas of divergence