

Key Insights
The global Productivity Suite Software market is poised for significant expansion, driven by the widespread adoption of cloud-based solutions, the escalating demand for advanced collaboration tools, and the imperative for streamlined workflows across industries. The surge in remote work models further amplifies the need for effective communication and project management software. Organizations are increasingly leveraging these suites to enhance operational efficiency, elevate employee productivity, and optimize costs. Key drivers of adoption include integrated communication platforms, robust project management capabilities, secure document sharing, collaborative tools, and sophisticated automation features. The market is segmented by software type (cloud-based, on-premise), deployment mode, organization size, and industry vertical. Intense competition exists among established vendors and specialized providers, fostering continuous innovation. Advancements in Artificial Intelligence (AI) and machine learning are expected to further refine productivity suite functionalities.
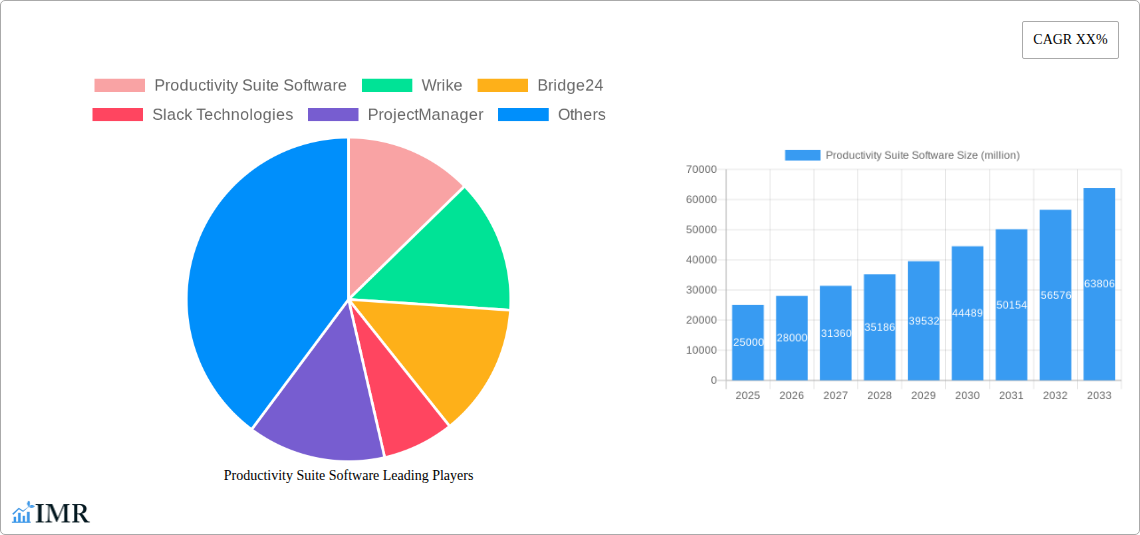
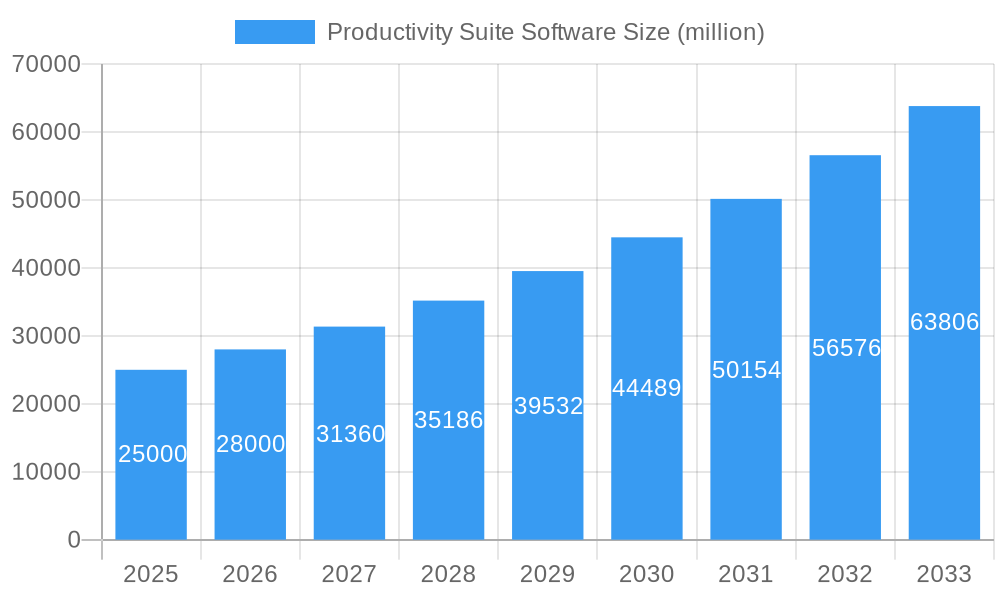
Productivity Suite Software Market Size (In Billion)
The forecast period (2025-2033) indicates sustained growth, propelled by technological innovation and the deeper integration of productivity suites with other business applications. While initial investment and system integration complexities may present challenges, the market outlook remains highly optimistic. Market consolidation is anticipated, with major players acquiring smaller entities to bolster market presence and product offerings. A continued emphasis on delivering seamless, user-friendly experiences tailored to the modern workplace, with a strong focus on security and data privacy, will be paramount. Geographic expansion, particularly in emerging economies with rising digital literacy, will also contribute substantially to market growth. The market size is estimated at $76.1 billion in 2025, with a projected Compound Annual Growth Rate (CAGR) of 13.7% through 2033.
Productivity Suite Software Company Market Share
Productivity Suite Software Market: A Comprehensive Analysis (2019-2033)
This comprehensive report provides a detailed analysis of the global Productivity Suite Software market, encompassing market dynamics, growth trends, regional dominance, product landscape, key players, and future outlook. The study period spans from 2019 to 2033, with 2025 serving as the base and estimated year. The forecast period covers 2025-2033, while the historical period encompasses 2019-2024. The report targets industry professionals, investors, and businesses seeking to understand and navigate this rapidly evolving market. Key players analyzed include Productivity Suite Software, Wrike, Bridge24, Slack Technologies, ProjectManager, Flock, Kantata, Logic Software, Scoro, Google Slides, Focos, e-ImageData, Talygen, and Nitro Software. The parent market is software solutions, and the child market is productivity tools.
Productivity Suite Software Market Dynamics & Structure
The global Productivity Suite Software market is characterized by a moderately concentrated landscape, with a few major players holding significant market share. The market size in 2025 is estimated at $XX billion. Technological innovation, particularly in areas like AI-powered automation and cloud-based solutions, is a key driver. However, regulatory frameworks concerning data privacy and security pose challenges. Competitive pressures from open-source alternatives and other productivity tools exist. The end-user demographic is broad, encompassing individuals, small businesses, and large enterprises across various sectors. M&A activity has been steadily increasing, with an estimated XX deals valued at $XX billion in the historical period.
- Market Concentration: Top 5 players hold approximately XX% market share in 2025.
- Technological Innovation: AI-driven automation, cloud integration, and cross-platform compatibility are key drivers.
- Regulatory Framework: GDPR, CCPA, and other data privacy regulations influence market dynamics.
- Competitive Substitutes: Open-source solutions and specialized productivity apps present competition.
- End-User Demographics: Individuals, SMBs, and enterprises across diverse industries.
- M&A Trends: XX deals completed between 2019-2024, totaling approximately $XX billion.
Productivity Suite Software Growth Trends & Insights
The Productivity Suite Software market has experienced significant growth over the past few years, driven by increasing digitalization and the remote work trend. The market size witnessed a CAGR of XX% from 2019 to 2024, reaching $XX billion in 2024. Adoption rates are rising steadily, particularly in emerging markets. Technological disruptions, such as the rise of collaborative platforms and AI-powered tools, are reshaping the market. Consumer behavior shifts towards cloud-based solutions and subscription models are also influencing market growth. We project a CAGR of XX% from 2025 to 2033, reaching an estimated $XX billion by 2033, with market penetration exceeding XX%.
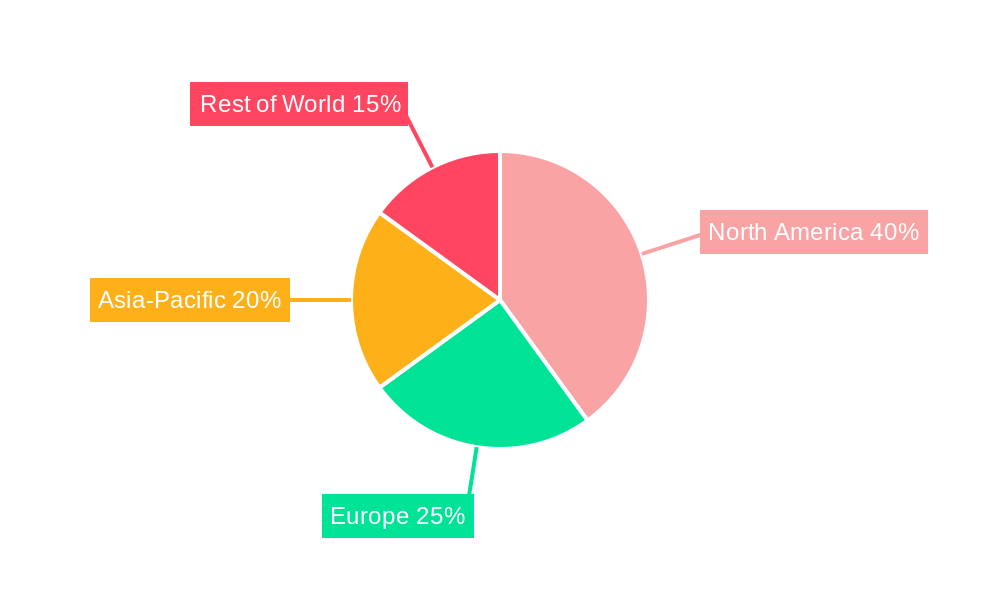
Dominant Regions, Countries, or Segments in Productivity Suite Software
North America currently dominates the Productivity Suite Software market, driven by high technological adoption rates, strong economic growth, and a mature IT infrastructure. Europe follows closely, with significant growth expected in Asia-Pacific due to increasing internet penetration and rising digital literacy. The Enterprise segment currently holds the largest market share, followed by the SMB segment.
- North America: High adoption rates, strong IT infrastructure, and mature market.
- Europe: Significant market size and steady growth potential.
- Asia-Pacific: Rapid growth driven by increasing internet penetration and digital literacy.
- Enterprise Segment: Highest market share due to greater need for advanced features and scalability.
- SMB Segment: Significant growth potential driven by increasing adoption of cloud-based solutions.
Productivity Suite Software Product Landscape
The Productivity Suite Software market offers a wide range of products, from basic productivity tools to sophisticated enterprise solutions. Recent innovations include enhanced collaboration features, AI-powered automation, and improved integration with other business applications. Unique selling propositions include advanced analytics dashboards, customizable workflows, and seamless cross-platform compatibility. Technological advancements are focused on improving user experience, enhancing security, and offering greater scalability.
Key Drivers, Barriers & Challenges in Productivity Suite Software
Key Drivers:
- Increasing demand for remote work solutions.
- Growing adoption of cloud-based software.
- Technological advancements in AI and automation.
- Rising need for enhanced collaboration tools.
Key Challenges:
- Intense competition from established players and new entrants.
- Data security and privacy concerns.
- High implementation and maintenance costs for complex solutions.
- Integration challenges with legacy systems. This leads to an estimated XX% reduction in adoption rate annually.
Emerging Opportunities in Productivity Suite Software
- Integration with IoT devices: Expanding functionalities to manage and analyze data from connected devices.
- Hyperautomation: Automating complex business processes through AI-powered workflows.
- Focus on niche markets: Developing tailored solutions for specific industries.
- Personalized user experiences: Leveraging AI and machine learning to customize workflows and features.
Growth Accelerators in the Productivity Suite Software Industry
Strategic partnerships and alliances are driving market growth, enabling companies to access wider markets and integrate complementary technologies. Continuous technological innovation, particularly in areas such as AI and machine learning, is fueling market expansion. Expansion into untapped markets, such as developing economies, is expected to significantly contribute to future growth.
Key Players Shaping the Productivity Suite Software Market
- Wrike
- Bridge24
- Slack Technologies
- ProjectManager
- Flock
- Kantata
- Logic Software
- Scoro
- Google Slides
- Focos
- e-ImageData
- Talygen
- Nitro Software
Notable Milestones in Productivity Suite Software Sector
- 2020-Q2: Wrike launches AI-powered automation features.
- 2021-Q4: Slack integrates with Microsoft Teams.
- 2022-Q1: Google Workspace unveils new collaboration features.
- 2023-Q3: Acquisition of a smaller productivity software firm by a major player. (Specific details not available, but event occurred).
In-Depth Productivity Suite Software Market Outlook
The Productivity Suite Software market is poised for significant growth in the coming years. Continued technological innovation, increasing adoption of cloud-based solutions, and expansion into new markets will drive market expansion. Strategic partnerships and acquisitions are expected to shape market dynamics. The forecast period will witness substantial growth, particularly in emerging markets and niche segments, offering significant opportunities for existing and new players.
Productivity Suite Software Segmentation
-
1. Application
- 1.1. SMEs
- 1.2. Large Enterprises
-
2. Types
- 2.1. Cloud-based
- 2.2. On Premises
Productivity Suite Software Segmentation By Geography
-
1. North America
- 1.1. United States
- 1.2. Canada
- 1.3. Mexico
-
2. South America
- 2.1. Brazil
- 2.2. Argentina
- 2.3. Rest of South America
-
3. Europe
- 3.1. United Kingdom
- 3.2. Germany
- 3.3. France
- 3.4. Italy
- 3.5. Spain
- 3.6. Russia
- 3.7. Benelux
- 3.8. Nordics
- 3.9. Rest of Europe
-
4. Middle East & Africa
- 4.1. Turkey
- 4.2. Israel
- 4.3. GCC
- 4.4. North Africa
- 4.5. South Africa
- 4.6. Rest of Middle East & Africa
-
5. Asia Pacific
- 5.1. China
- 5.2. India
- 5.3. Japan
- 5.4. South Korea
- 5.5. ASEAN
- 5.6. Oceania
- 5.7. Rest of Asia Pacific
Productivity Suite Software Regional Market Share
Geographic Coverage of Productivity Suite Software
Productivity Suite Software REPORT HIGHLIGHTS
| Aspects | Details |
|---|---|
| Study Period | 2020-2034 |
| Base Year | 2025 |
| Estimated Year | 2026 |
| Forecast Period | 2026-2034 |
| Historical Period | 2020-2025 |
| Growth Rate | CAGR of 13.7% from 2020-2034 |
| Segmentation |
|
Table of Contents
- 1. Introduction
- 1.1. Research Scope
- 1.2. Market Segmentation
- 1.3. Research Objective
- 1.4. Definitions and Assumptions
- 2. Executive Summary
- 2.1. Market Snapshot
- 3. Market Dynamics
- 3.1. Market Drivers
- 3.2. Market Restrains
- 3.3. Market Trends
- 3.4. Market Opportunities
- 4. Market Factor Analysis
- 4.1. Porters Five Forces
- 4.1.1. Bargaining Power of Suppliers
- 4.1.2. Bargaining Power of Buyers
- 4.1.3. Threat of New Entrants
- 4.1.4. Threat of Substitutes
- 4.1.5. Competitive Rivalry
- 4.2. PESTEL analysis
- 4.3. BCG Analysis
- 4.3.1. Stars (High Growth, High Market Share)
- 4.3.2. Cash Cows (Low Growth, High Market Share)
- 4.3.3. Question Mark (High Growth, Low Market Share)
- 4.3.4. Dogs (Low Growth, Low Market Share)
- 4.4. Ansoff Matrix Analysis
- 4.5. Supply Chain Analysis
- 4.6. Regulatory Landscape
- 4.7. Current Market Potential and Opportunity Assessment (TAM–SAM–SOM Framework)
- 4.8. IMR Analyst Note
- 4.1. Porters Five Forces
- 5. Market Analysis, Insights and Forecast 2021-2033
- 5.1. Market Analysis, Insights and Forecast - by Application
- 5.1.1. SMEs
- 5.1.2. Large Enterprises
- 5.2. Market Analysis, Insights and Forecast - by Types
- 5.2.1. Cloud-based
- 5.2.2. On Premises
- 5.3. Market Analysis, Insights and Forecast - by Region
- 5.3.1. North America
- 5.3.2. South America
- 5.3.3. Europe
- 5.3.4. Middle East & Africa
- 5.3.5. Asia Pacific
- 5.1. Market Analysis, Insights and Forecast - by Application
- 6. Global Productivity Suite Software Analysis, Insights and Forecast, 2021-2033
- 6.1. Market Analysis, Insights and Forecast - by Application
- 6.1.1. SMEs
- 6.1.2. Large Enterprises
- 6.2. Market Analysis, Insights and Forecast - by Types
- 6.2.1. Cloud-based
- 6.2.2. On Premises
- 6.1. Market Analysis, Insights and Forecast - by Application
- 7. North America Productivity Suite Software Analysis, Insights and Forecast, 2020-2032
- 7.1. Market Analysis, Insights and Forecast - by Application
- 7.1.1. SMEs
- 7.1.2. Large Enterprises
- 7.2. Market Analysis, Insights and Forecast - by Types
- 7.2.1. Cloud-based
- 7.2.2. On Premises
- 7.1. Market Analysis, Insights and Forecast - by Application
- 8. South America Productivity Suite Software Analysis, Insights and Forecast, 2020-2032
- 8.1. Market Analysis, Insights and Forecast - by Application
- 8.1.1. SMEs
- 8.1.2. Large Enterprises
- 8.2. Market Analysis, Insights and Forecast - by Types
- 8.2.1. Cloud-based
- 8.2.2. On Premises
- 8.1. Market Analysis, Insights and Forecast - by Application
- 9. Europe Productivity Suite Software Analysis, Insights and Forecast, 2020-2032
- 9.1. Market Analysis, Insights and Forecast - by Application
- 9.1.1. SMEs
- 9.1.2. Large Enterprises
- 9.2. Market Analysis, Insights and Forecast - by Types
- 9.2.1. Cloud-based
- 9.2.2. On Premises
- 9.1. Market Analysis, Insights and Forecast - by Application
- 10. Middle East & Africa Productivity Suite Software Analysis, Insights and Forecast, 2020-2032
- 10.1. Market Analysis, Insights and Forecast - by Application
- 10.1.1. SMEs
- 10.1.2. Large Enterprises
- 10.2. Market Analysis, Insights and Forecast - by Types
- 10.2.1. Cloud-based
- 10.2.2. On Premises
- 10.1. Market Analysis, Insights and Forecast - by Application
- 11. Asia Pacific Productivity Suite Software Analysis, Insights and Forecast, 2020-2032
- 11.1. Market Analysis, Insights and Forecast - by Application
- 11.1.1. SMEs
- 11.1.2. Large Enterprises
- 11.2. Market Analysis, Insights and Forecast - by Types
- 11.2.1. Cloud-based
- 11.2.2. On Premises
- 11.1. Market Analysis, Insights and Forecast - by Application
- 12. Competitive Analysis
- 12.1. Company Profiles
- 12.1.1 Productivity Suite Software
- 12.1.1.1. Company Overview
- 12.1.1.2. Products
- 12.1.1.3. Company Financials
- 12.1.1.4. SWOT Analysis
- 12.1.2 Wrike
- 12.1.2.1. Company Overview
- 12.1.2.2. Products
- 12.1.2.3. Company Financials
- 12.1.2.4. SWOT Analysis
- 12.1.3 Bridge24
- 12.1.3.1. Company Overview
- 12.1.3.2. Products
- 12.1.3.3. Company Financials
- 12.1.3.4. SWOT Analysis
- 12.1.4 Slack Technologies
- 12.1.4.1. Company Overview
- 12.1.4.2. Products
- 12.1.4.3. Company Financials
- 12.1.4.4. SWOT Analysis
- 12.1.5 ProjectManager
- 12.1.5.1. Company Overview
- 12.1.5.2. Products
- 12.1.5.3. Company Financials
- 12.1.5.4. SWOT Analysis
- 12.1.6 Flock
- 12.1.6.1. Company Overview
- 12.1.6.2. Products
- 12.1.6.3. Company Financials
- 12.1.6.4. SWOT Analysis
- 12.1.7 Kantata
- 12.1.7.1. Company Overview
- 12.1.7.2. Products
- 12.1.7.3. Company Financials
- 12.1.7.4. SWOT Analysis
- 12.1.8 Logic Software
- 12.1.8.1. Company Overview
- 12.1.8.2. Products
- 12.1.8.3. Company Financials
- 12.1.8.4. SWOT Analysis
- 12.1.9 Scoro
- 12.1.9.1. Company Overview
- 12.1.9.2. Products
- 12.1.9.3. Company Financials
- 12.1.9.4. SWOT Analysis
- 12.1.10 Google Slides
- 12.1.10.1. Company Overview
- 12.1.10.2. Products
- 12.1.10.3. Company Financials
- 12.1.10.4. SWOT Analysis
- 12.1.11 Focos
- 12.1.11.1. Company Overview
- 12.1.11.2. Products
- 12.1.11.3. Company Financials
- 12.1.11.4. SWOT Analysis
- 12.1.12 e-ImageData
- 12.1.12.1. Company Overview
- 12.1.12.2. Products
- 12.1.12.3. Company Financials
- 12.1.12.4. SWOT Analysis
- 12.1.13 Talygen
- 12.1.13.1. Company Overview
- 12.1.13.2. Products
- 12.1.13.3. Company Financials
- 12.1.13.4. SWOT Analysis
- 12.1.14 Nitro Software
- 12.1.14.1. Company Overview
- 12.1.14.2. Products
- 12.1.14.3. Company Financials
- 12.1.14.4. SWOT Analysis
- 12.1.1 Productivity Suite Software
- 12.2. Market Entropy
- 12.2.1 Company's Key Areas Served
- 12.2.2 Recent Developments
- 12.3. Company Market Share Analysis 2025
- 12.3.1 Top 5 Companies Market Share Analysis
- 12.3.2 Top 3 Companies Market Share Analysis
- 12.4. List of Potential Customers
- 13. Research Methodology
List of Figures
- Figure 1: Global Productivity Suite Software Revenue Breakdown (billion, %) by Region 2025 & 2033
- Figure 2: North America Productivity Suite Software Revenue (billion), by Application 2025 & 2033
- Figure 3: North America Productivity Suite Software Revenue Share (%), by Application 2025 & 2033
- Figure 4: North America Productivity Suite Software Revenue (billion), by Types 2025 & 2033
- Figure 5: North America Productivity Suite Software Revenue Share (%), by Types 2025 & 2033
- Figure 6: North America Productivity Suite Software Revenue (billion), by Country 2025 & 2033
- Figure 7: North America Productivity Suite Software Revenue Share (%), by Country 2025 & 2033
- Figure 8: South America Productivity Suite Software Revenue (billion), by Application 2025 & 2033
- Figure 9: South America Productivity Suite Software Revenue Share (%), by Application 2025 & 2033
- Figure 10: South America Productivity Suite Software Revenue (billion), by Types 2025 & 2033
- Figure 11: South America Productivity Suite Software Revenue Share (%), by Types 2025 & 2033
- Figure 12: South America Productivity Suite Software Revenue (billion), by Country 2025 & 2033
- Figure 13: South America Productivity Suite Software Revenue Share (%), by Country 2025 & 2033
- Figure 14: Europe Productivity Suite Software Revenue (billion), by Application 2025 & 2033
- Figure 15: Europe Productivity Suite Software Revenue Share (%), by Application 2025 & 2033
- Figure 16: Europe Productivity Suite Software Revenue (billion), by Types 2025 & 2033
- Figure 17: Europe Productivity Suite Software Revenue Share (%), by Types 2025 & 2033
- Figure 18: Europe Productivity Suite Software Revenue (billion), by Country 2025 & 2033
- Figure 19: Europe Productivity Suite Software Revenue Share (%), by Country 2025 & 2033
- Figure 20: Middle East & Africa Productivity Suite Software Revenue (billion), by Application 2025 & 2033
- Figure 21: Middle East & Africa Productivity Suite Software Revenue Share (%), by Application 2025 & 2033
- Figure 22: Middle East & Africa Productivity Suite Software Revenue (billion), by Types 2025 & 2033
- Figure 23: Middle East & Africa Productivity Suite Software Revenue Share (%), by Types 2025 & 2033
- Figure 24: Middle East & Africa Productivity Suite Software Revenue (billion), by Country 2025 & 2033
- Figure 25: Middle East & Africa Productivity Suite Software Revenue Share (%), by Country 2025 & 2033
- Figure 26: Asia Pacific Productivity Suite Software Revenue (billion), by Application 2025 & 2033
- Figure 27: Asia Pacific Productivity Suite Software Revenue Share (%), by Application 2025 & 2033
- Figure 28: Asia Pacific Productivity Suite Software Revenue (billion), by Types 2025 & 2033
- Figure 29: Asia Pacific Productivity Suite Software Revenue Share (%), by Types 2025 & 2033
- Figure 30: Asia Pacific Productivity Suite Software Revenue (billion), by Country 2025 & 2033
- Figure 31: Asia Pacific Productivity Suite Software Revenue Share (%), by Country 2025 & 2033
List of Tables
- Table 1: Global Productivity Suite Software Revenue billion Forecast, by Application 2020 & 2033
- Table 2: Global Productivity Suite Software Revenue billion Forecast, by Types 2020 & 2033
- Table 3: Global Productivity Suite Software Revenue billion Forecast, by Region 2020 & 2033
- Table 4: Global Productivity Suite Software Revenue billion Forecast, by Application 2020 & 2033
- Table 5: Global Productivity Suite Software Revenue billion Forecast, by Types 2020 & 2033
- Table 6: Global Productivity Suite Software Revenue billion Forecast, by Country 2020 & 2033
- Table 7: United States Productivity Suite Software Revenue (billion) Forecast, by Application 2020 & 2033
- Table 8: Canada Productivity Suite Software Revenue (billion) Forecast, by Application 2020 & 2033
- Table 9: Mexico Productivity Suite Software Revenue (billion) Forecast, by Application 2020 & 2033
- Table 10: Global Productivity Suite Software Revenue billion Forecast, by Application 2020 & 2033
- Table 11: Global Productivity Suite Software Revenue billion Forecast, by Types 2020 & 2033
- Table 12: Global Productivity Suite Software Revenue billion Forecast, by Country 2020 & 2033
- Table 13: Brazil Productivity Suite Software Revenue (billion) Forecast, by Application 2020 & 2033
- Table 14: Argentina Productivity Suite Software Revenue (billion) Forecast, by Application 2020 & 2033
- Table 15: Rest of South America Productivity Suite Software Revenue (billion) Forecast, by Application 2020 & 2033
- Table 16: Global Productivity Suite Software Revenue billion Forecast, by Application 2020 & 2033
- Table 17: Global Productivity Suite Software Revenue billion Forecast, by Types 2020 & 2033
- Table 18: Global Productivity Suite Software Revenue billion Forecast, by Country 2020 & 2033
- Table 19: United Kingdom Productivity Suite Software Revenue (billion) Forecast, by Application 2020 & 2033
- Table 20: Germany Productivity Suite Software Revenue (billion) Forecast, by Application 2020 & 2033
- Table 21: France Productivity Suite Software Revenue (billion) Forecast, by Application 2020 & 2033
- Table 22: Italy Productivity Suite Software Revenue (billion) Forecast, by Application 2020 & 2033
- Table 23: Spain Productivity Suite Software Revenue (billion) Forecast, by Application 2020 & 2033
- Table 24: Russia Productivity Suite Software Revenue (billion) Forecast, by Application 2020 & 2033
- Table 25: Benelux Productivity Suite Software Revenue (billion) Forecast, by Application 2020 & 2033
- Table 26: Nordics Productivity Suite Software Revenue (billion) Forecast, by Application 2020 & 2033
- Table 27: Rest of Europe Productivity Suite Software Revenue (billion) Forecast, by Application 2020 & 2033
- Table 28: Global Productivity Suite Software Revenue billion Forecast, by Application 2020 & 2033
- Table 29: Global Productivity Suite Software Revenue billion Forecast, by Types 2020 & 2033
- Table 30: Global Productivity Suite Software Revenue billion Forecast, by Country 2020 & 2033
- Table 31: Turkey Productivity Suite Software Revenue (billion) Forecast, by Application 2020 & 2033
- Table 32: Israel Productivity Suite Software Revenue (billion) Forecast, by Application 2020 & 2033
- Table 33: GCC Productivity Suite Software Revenue (billion) Forecast, by Application 2020 & 2033
- Table 34: North Africa Productivity Suite Software Revenue (billion) Forecast, by Application 2020 & 2033
- Table 35: South Africa Productivity Suite Software Revenue (billion) Forecast, by Application 2020 & 2033
- Table 36: Rest of Middle East & Africa Productivity Suite Software Revenue (billion) Forecast, by Application 2020 & 2033
- Table 37: Global Productivity Suite Software Revenue billion Forecast, by Application 2020 & 2033
- Table 38: Global Productivity Suite Software Revenue billion Forecast, by Types 2020 & 2033
- Table 39: Global Productivity Suite Software Revenue billion Forecast, by Country 2020 & 2033
- Table 40: China Productivity Suite Software Revenue (billion) Forecast, by Application 2020 & 2033
- Table 41: India Productivity Suite Software Revenue (billion) Forecast, by Application 2020 & 2033
- Table 42: Japan Productivity Suite Software Revenue (billion) Forecast, by Application 2020 & 2033
- Table 43: South Korea Productivity Suite Software Revenue (billion) Forecast, by Application 2020 & 2033
- Table 44: ASEAN Productivity Suite Software Revenue (billion) Forecast, by Application 2020 & 2033
- Table 45: Oceania Productivity Suite Software Revenue (billion) Forecast, by Application 2020 & 2033
- Table 46: Rest of Asia Pacific Productivity Suite Software Revenue (billion) Forecast, by Application 2020 & 2033
Frequently Asked Questions
1. What is the projected Compound Annual Growth Rate (CAGR) of the Productivity Suite Software?
The projected CAGR is approximately 13.7%.
2. Which companies are prominent players in the Productivity Suite Software?
Key companies in the market include Productivity Suite Software, Wrike, Bridge24, Slack Technologies, ProjectManager, Flock, Kantata, Logic Software, Scoro, Google Slides, Focos, e-ImageData, Talygen, Nitro Software.
3. What are the main segments of the Productivity Suite Software?
The market segments include Application, Types.
4. Can you provide details about the market size?
The market size is estimated to be USD 76.1 billion as of 2022.
5. What are some drivers contributing to market growth?
N/A
6. What are the notable trends driving market growth?
N/A
7. Are there any restraints impacting market growth?
N/A
8. Can you provide examples of recent developments in the market?
N/A
9. What pricing options are available for accessing the report?
Pricing options include single-user, multi-user, and enterprise licenses priced at USD 3950.00, USD 5925.00, and USD 7900.00 respectively.
10. Is the market size provided in terms of value or volume?
The market size is provided in terms of value, measured in billion.
11. Are there any specific market keywords associated with the report?
Yes, the market keyword associated with the report is "Productivity Suite Software," which aids in identifying and referencing the specific market segment covered.
12. How do I determine which pricing option suits my needs best?
The pricing options vary based on user requirements and access needs. Individual users may opt for single-user licenses, while businesses requiring broader access may choose multi-user or enterprise licenses for cost-effective access to the report.
13. Are there any additional resources or data provided in the Productivity Suite Software report?
While the report offers comprehensive insights, it's advisable to review the specific contents or supplementary materials provided to ascertain if additional resources or data are available.
14. How can I stay updated on further developments or reports in the Productivity Suite Software?
To stay informed about further developments, trends, and reports in the Productivity Suite Software, consider subscribing to industry newsletters, following relevant companies and organizations, or regularly checking reputable industry news sources and publications.
Methodology
Step 1 - Identification of Relevant Samples Size from Population Database


Step 2 - Approaches for Defining Global Market Size (Value, Volume* & Price*)

Note*: In applicable scenarios
Step 3 - Data Sources
Primary Research
- Web Analytics
- Survey Reports
- Research Institute
- Latest Research Reports
- Opinion Leaders
Secondary Research
- Annual Reports
- White Paper
- Latest Press Release
- Industry Association
- Paid Database
- Investor Presentations

Step 4 - Data Triangulation
Involves using different sources of information in order to increase the validity of a study
These sources are likely to be stakeholders in a program - participants, other researchers, program staff, other community members, and so on.
Then we put all data in single framework & apply various statistical tools to find out the dynamic on the market.
During the analysis stage, feedback from the stakeholder groups would be compared to determine areas of agreement as well as areas of divergence