

Key Insights
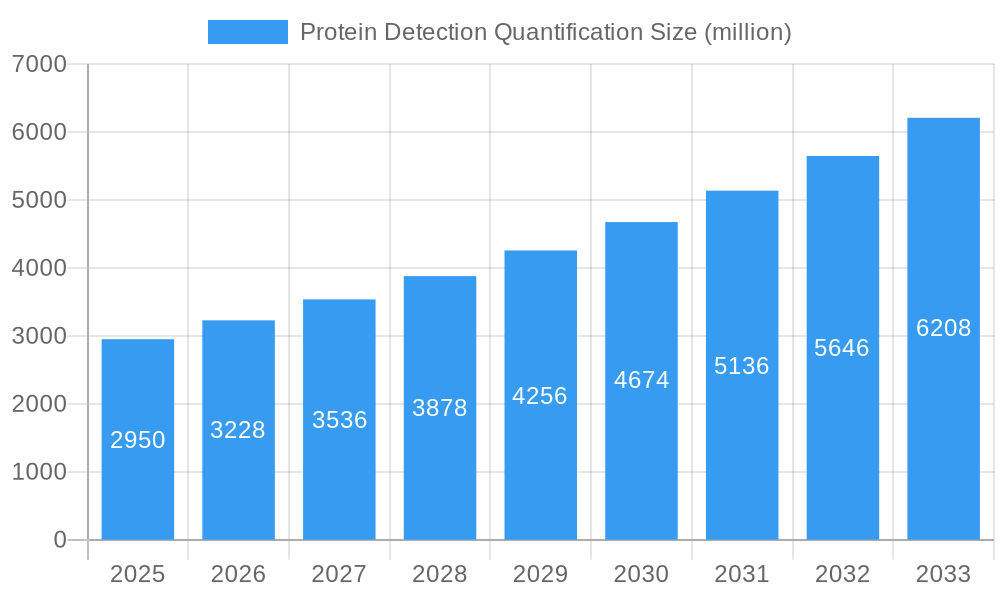
The global protein detection and quantification market, valued at $2.95 billion in 2025, is projected to experience robust growth, driven by the increasing demand for advanced diagnostic tools in life sciences research, drug discovery, and clinical diagnostics. The market's Compound Annual Growth Rate (CAGR) of 9.3% from 2019 to 2033 reflects a strong upward trajectory fueled by several key factors. Technological advancements, such as the development of highly sensitive and specific assays like ELISA, Western blotting, and mass spectrometry-based proteomics, are significantly contributing to this growth. Furthermore, the rising prevalence of chronic diseases, coupled with the increasing need for personalized medicine, is driving demand for precise and efficient protein quantification methods. The expanding application of protein detection in various fields, including biomarker discovery, disease diagnosis, and therapeutic monitoring, further contributes to the market's expansion.
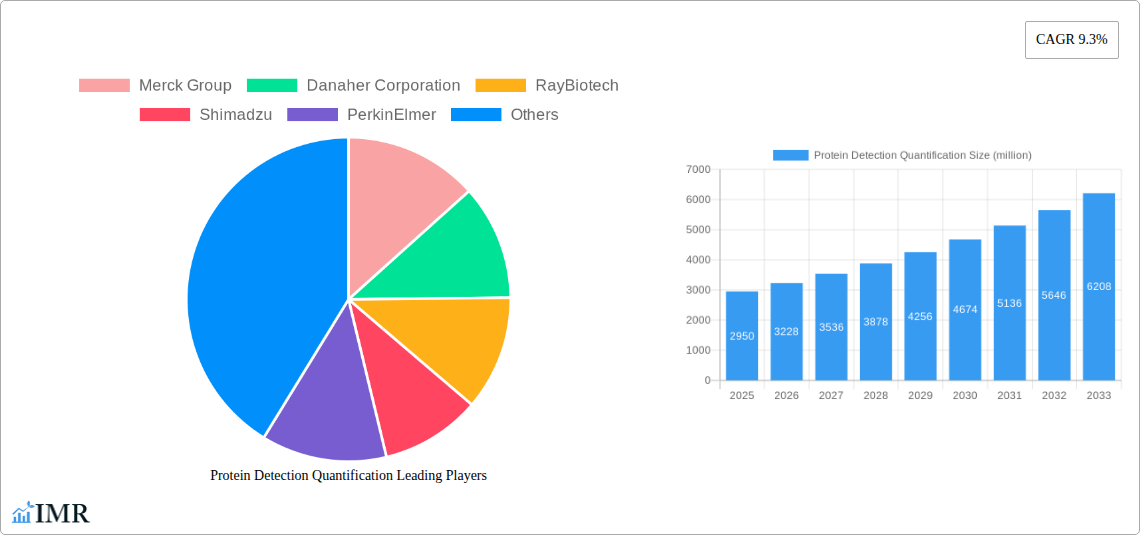
Protein Detection Quantification Market Size (In Billion)
Significant players like Merck Group, Danaher Corporation, and Thermo Fisher Scientific are driving innovation and shaping market competition through strategic partnerships, acquisitions, and the introduction of new products. However, the market also faces certain challenges. High costs associated with advanced technologies and specialized equipment can limit accessibility for smaller research groups and laboratories. Stringent regulatory approvals for diagnostic tools can also present hurdles for market expansion. Nevertheless, the ongoing advancements in technology, coupled with the escalating need for precise protein analysis across various sectors, are poised to overcome these restraints and propel market growth during the forecast period (2025-2033). The market segmentation, while not provided, would likely include categories based on technology (e.g., ELISA, Western blotting, mass spectrometry), application (e.g., research, diagnostics, drug discovery), and end-user (e.g., pharmaceutical companies, academic institutions, hospitals).
Protein Detection Quantification Company Market Share
Protein Detection Quantification Market Report: 2019-2033
This comprehensive report provides an in-depth analysis of the Protein Detection Quantification market, encompassing market dynamics, growth trends, regional analysis, competitive landscape, and future outlook. The report covers the period from 2019 to 2033, with a focus on the 2025-2033 forecast period. The parent market is the broader life sciences research tools market, while the child market is specifically protein analysis techniques. The market is estimated at xx million units in 2025 and is projected to reach xx million units by 2033.
Protein Detection Quantification Market Dynamics & Structure
The Protein Detection Quantification market is characterized by moderate concentration, with key players holding significant market share. Technological innovation, driven by advancements in mass spectrometry, ELISA, and Western blotting, is a key growth driver. Stringent regulatory frameworks, particularly concerning quality control and validation, influence market dynamics. Competitive substitutes include alternative protein analysis methods, which impact market penetration. The end-user demographic is primarily composed of research institutions, pharmaceutical companies, and biotechnology firms. The market has witnessed several M&A activities, mostly driven by strategic expansion and technology acquisition in the historical period. xx major M&A deals were recorded during 2019-2024, representing a significant increase of xx% compared to the previous five years.
- Market Concentration: Moderately concentrated, with top 5 players holding approximately xx% market share in 2024.
- Technological Innovation: Rapid advancements in mass spectrometry, ELISA, and Western blotting techniques drive growth.
- Regulatory Framework: Stringent quality control and validation regulations impact market access and product development.
- Competitive Substitutes: Alternative protein analysis techniques pose competitive pressures.
- End-User Demographics: Primarily research institutions, pharmaceutical, and biotechnology companies.
- M&A Trends: Significant increase in M&A activity in recent years, driven by strategic acquisitions.
Protein Detection Quantification Growth Trends & Insights
The Protein Detection Quantification market has experienced consistent growth from 2019 to 2024, with a CAGR of xx%. This growth is attributed to factors such as the increasing prevalence of chronic diseases, rising demand for personalized medicine, and substantial investments in life sciences research. The market penetration of advanced techniques like mass spectrometry has been steadily increasing, though adoption still varies regionally and among different segments. Consumer behavior shifts towards automation and high-throughput assays have further fueled the market's expansion. We predict a CAGR of xx% during the forecast period (2025-2033), driven by continuous technological advancements, increased adoption in emerging markets, and expanding applications across various fields.
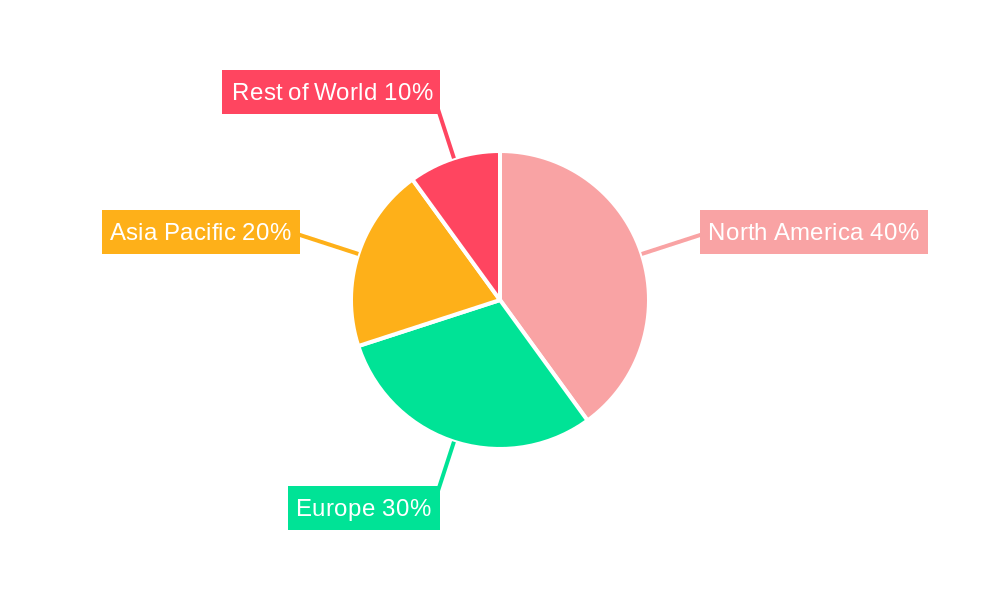
Dominant Regions, Countries, or Segments in Protein Detection Quantification
North America currently holds the largest market share in Protein Detection Quantification, driven by strong investments in research and development, and a well-established life sciences ecosystem. Europe follows closely, with significant growth expected in the Asia-Pacific region, fueled by rising healthcare expenditure and expanding biotechnology sectors in countries like China and India. The pharmaceutical segment is the largest application area within the market.
- North America: High R&D investment, established life sciences infrastructure, and strong regulatory support drive growth.
- Europe: Large pharmaceutical and biotechnology industries, with substantial research initiatives.
- Asia-Pacific: Rapid growth potential due to increasing healthcare spending and a developing biotechnology sector.
- Pharmaceutical Segment: Largest application area due to extensive drug discovery and development activities.
Protein Detection Quantification Product Landscape
The Protein Detection Quantification market offers a diverse range of products including ELISA kits, Western blotting reagents, mass spectrometry instruments, and related software. Innovations focus on improving sensitivity, throughput, and automation. Unique selling propositions include ease of use, high accuracy, and comprehensive software integration. Technological advancements are marked by miniaturization, multi-plexing capabilities, and the integration of artificial intelligence for data analysis.
Key Drivers, Barriers & Challenges in Protein Detection Quantification
Key Drivers:
- Rising prevalence of chronic diseases.
- Increased demand for personalized medicine.
- Growth in pharmaceutical and biotechnology industries.
- Technological advancements leading to higher sensitivity and throughput.
Key Barriers & Challenges:
- High cost of advanced instruments and reagents.
- Complex regulatory requirements for validation and quality control.
- Intense competition among existing market players and emerging technologies.
- Supply chain disruptions causing xx% increase in reagent prices in 2024.
Emerging Opportunities in Protein Detection Quantification
- Expanding applications in point-of-care diagnostics.
- Growing adoption of proteomics research in disease diagnosis and treatment.
- Development of novel assays for specific biomarkers.
- Increased integration of AI and machine learning for data analysis.
Growth Accelerators in the Protein Detection Quantification Industry
Technological breakthroughs, such as the development of more sensitive and high-throughput platforms, will remain a significant driver of market growth. Strategic partnerships between technology providers and end-users will create new avenues for market penetration. Expansion into emerging markets and the increasing adoption of cloud-based data management systems will contribute to long-term growth.
Key Players Shaping the Protein Detection Quantification Market
Notable Milestones in Protein Detection Quantification Sector
- 2020: Launch of a novel mass spectrometry platform by Thermo Fisher Scientific, significantly improving sensitivity.
- 2022: Acquisition of a leading ELISA kit manufacturer by Danaher Corporation, expanding market reach.
- 2023: FDA approval of a new protein biomarker assay for early cancer detection.
- 2024: Introduction of a fully automated Western blotting system by Bio-Rad Laboratories.
In-Depth Protein Detection Quantification Market Outlook
The Protein Detection Quantification market is poised for continued growth driven by technological advancements, increasing research and development activities, and the expanding applications of proteomics. Strategic acquisitions, partnerships, and market expansion into emerging economies will further accelerate market growth. The focus on improving sensitivity, automation, and reducing the cost of assays will drive future market potential, while the development of novel technologies and applications will unlock new strategic opportunities.
Protein Detection Quantification Segmentation
-
1. Application
- 1.1. Academic Research Institutes
- 1.2. Biotechnology
- 1.3. Pharmaceutical Companies
- 1.4. Contract Research Organization
- 1.5. Others
-
2. Types
- 2.1. Reagents / Consumables
- 2.2. Instruments
- 2.3. Services
- 2.4. Others
Protein Detection Quantification Segmentation By Geography
-
1. North America
- 1.1. United States
- 1.2. Canada
- 1.3. Mexico
-
2. South America
- 2.1. Brazil
- 2.2. Argentina
- 2.3. Rest of South America
-
3. Europe
- 3.1. United Kingdom
- 3.2. Germany
- 3.3. France
- 3.4. Italy
- 3.5. Spain
- 3.6. Russia
- 3.7. Benelux
- 3.8. Nordics
- 3.9. Rest of Europe
-
4. Middle East & Africa
- 4.1. Turkey
- 4.2. Israel
- 4.3. GCC
- 4.4. North Africa
- 4.5. South Africa
- 4.6. Rest of Middle East & Africa
-
5. Asia Pacific
- 5.1. China
- 5.2. India
- 5.3. Japan
- 5.4. South Korea
- 5.5. ASEAN
- 5.6. Oceania
- 5.7. Rest of Asia Pacific
Protein Detection Quantification Regional Market Share
Geographic Coverage of Protein Detection Quantification
Protein Detection Quantification REPORT HIGHLIGHTS
| Aspects | Details |
|---|---|
| Study Period | 2020-2034 |
| Base Year | 2025 |
| Estimated Year | 2026 |
| Forecast Period | 2026-2034 |
| Historical Period | 2020-2025 |
| Growth Rate | CAGR of 7.19% from 2020-2034 |
| Segmentation |
|
Table of Contents
- 1. Introduction
- 1.1. Research Scope
- 1.2. Market Segmentation
- 1.3. Research Objective
- 1.4. Definitions and Assumptions
- 2. Executive Summary
- 2.1. Market Snapshot
- 3. Market Dynamics
- 3.1. Market Drivers
- 3.2. Market Restrains
- 3.3. Market Trends
- 3.4. Market Opportunities
- 4. Market Factor Analysis
- 4.1. Porters Five Forces
- 4.1.1. Bargaining Power of Suppliers
- 4.1.2. Bargaining Power of Buyers
- 4.1.3. Threat of New Entrants
- 4.1.4. Threat of Substitutes
- 4.1.5. Competitive Rivalry
- 4.2. PESTEL analysis
- 4.3. BCG Analysis
- 4.3.1. Stars (High Growth, High Market Share)
- 4.3.2. Cash Cows (Low Growth, High Market Share)
- 4.3.3. Question Mark (High Growth, Low Market Share)
- 4.3.4. Dogs (Low Growth, Low Market Share)
- 4.4. Ansoff Matrix Analysis
- 4.5. Supply Chain Analysis
- 4.6. Regulatory Landscape
- 4.7. Current Market Potential and Opportunity Assessment (TAM–SAM–SOM Framework)
- 4.8. IMR Analyst Note
- 4.1. Porters Five Forces
- 5. Market Analysis, Insights and Forecast 2021-2033
- 5.1. Market Analysis, Insights and Forecast - by Application
- 5.1.1. Academic Research Institutes
- 5.1.2. Biotechnology
- 5.1.3. Pharmaceutical Companies
- 5.1.4. Contract Research Organization
- 5.1.5. Others
- 5.2. Market Analysis, Insights and Forecast - by Types
- 5.2.1. Reagents / Consumables
- 5.2.2. Instruments
- 5.2.3. Services
- 5.2.4. Others
- 5.3. Market Analysis, Insights and Forecast - by Region
- 5.3.1. North America
- 5.3.2. South America
- 5.3.3. Europe
- 5.3.4. Middle East & Africa
- 5.3.5. Asia Pacific
- 5.1. Market Analysis, Insights and Forecast - by Application
- 6. Global Protein Detection Quantification Analysis, Insights and Forecast, 2021-2033
- 6.1. Market Analysis, Insights and Forecast - by Application
- 6.1.1. Academic Research Institutes
- 6.1.2. Biotechnology
- 6.1.3. Pharmaceutical Companies
- 6.1.4. Contract Research Organization
- 6.1.5. Others
- 6.2. Market Analysis, Insights and Forecast - by Types
- 6.2.1. Reagents / Consumables
- 6.2.2. Instruments
- 6.2.3. Services
- 6.2.4. Others
- 6.1. Market Analysis, Insights and Forecast - by Application
- 7. North America Protein Detection Quantification Analysis, Insights and Forecast, 2020-2032
- 7.1. Market Analysis, Insights and Forecast - by Application
- 7.1.1. Academic Research Institutes
- 7.1.2. Biotechnology
- 7.1.3. Pharmaceutical Companies
- 7.1.4. Contract Research Organization
- 7.1.5. Others
- 7.2. Market Analysis, Insights and Forecast - by Types
- 7.2.1. Reagents / Consumables
- 7.2.2. Instruments
- 7.2.3. Services
- 7.2.4. Others
- 7.1. Market Analysis, Insights and Forecast - by Application
- 8. South America Protein Detection Quantification Analysis, Insights and Forecast, 2020-2032
- 8.1. Market Analysis, Insights and Forecast - by Application
- 8.1.1. Academic Research Institutes
- 8.1.2. Biotechnology
- 8.1.3. Pharmaceutical Companies
- 8.1.4. Contract Research Organization
- 8.1.5. Others
- 8.2. Market Analysis, Insights and Forecast - by Types
- 8.2.1. Reagents / Consumables
- 8.2.2. Instruments
- 8.2.3. Services
- 8.2.4. Others
- 8.1. Market Analysis, Insights and Forecast - by Application
- 9. Europe Protein Detection Quantification Analysis, Insights and Forecast, 2020-2032
- 9.1. Market Analysis, Insights and Forecast - by Application
- 9.1.1. Academic Research Institutes
- 9.1.2. Biotechnology
- 9.1.3. Pharmaceutical Companies
- 9.1.4. Contract Research Organization
- 9.1.5. Others
- 9.2. Market Analysis, Insights and Forecast - by Types
- 9.2.1. Reagents / Consumables
- 9.2.2. Instruments
- 9.2.3. Services
- 9.2.4. Others
- 9.1. Market Analysis, Insights and Forecast - by Application
- 10. Middle East & Africa Protein Detection Quantification Analysis, Insights and Forecast, 2020-2032
- 10.1. Market Analysis, Insights and Forecast - by Application
- 10.1.1. Academic Research Institutes
- 10.1.2. Biotechnology
- 10.1.3. Pharmaceutical Companies
- 10.1.4. Contract Research Organization
- 10.1.5. Others
- 10.2. Market Analysis, Insights and Forecast - by Types
- 10.2.1. Reagents / Consumables
- 10.2.2. Instruments
- 10.2.3. Services
- 10.2.4. Others
- 10.1. Market Analysis, Insights and Forecast - by Application
- 11. Asia Pacific Protein Detection Quantification Analysis, Insights and Forecast, 2020-2032
- 11.1. Market Analysis, Insights and Forecast - by Application
- 11.1.1. Academic Research Institutes
- 11.1.2. Biotechnology
- 11.1.3. Pharmaceutical Companies
- 11.1.4. Contract Research Organization
- 11.1.5. Others
- 11.2. Market Analysis, Insights and Forecast - by Types
- 11.2.1. Reagents / Consumables
- 11.2.2. Instruments
- 11.2.3. Services
- 11.2.4. Others
- 11.1. Market Analysis, Insights and Forecast - by Application
- 12. Competitive Analysis
- 12.1. Company Profiles
- 12.1.1 Merck Group
- 12.1.1.1. Company Overview
- 12.1.1.2. Products
- 12.1.1.3. Company Financials
- 12.1.1.4. SWOT Analysis
- 12.1.2 Danaher Corporation
- 12.1.2.1. Company Overview
- 12.1.2.2. Products
- 12.1.2.3. Company Financials
- 12.1.2.4. SWOT Analysis
- 12.1.3 RayBiotech
- 12.1.3.1. Company Overview
- 12.1.3.2. Products
- 12.1.3.3. Company Financials
- 12.1.3.4. SWOT Analysis
- 12.1.4 Shimadzu
- 12.1.4.1. Company Overview
- 12.1.4.2. Products
- 12.1.4.3. Company Financials
- 12.1.4.4. SWOT Analysis
- 12.1.5 PerkinElmer
- 12.1.5.1. Company Overview
- 12.1.5.2. Products
- 12.1.5.3. Company Financials
- 12.1.5.4. SWOT Analysis
- 12.1.6 GE Healthcare
- 12.1.6.1. Company Overview
- 12.1.6.2. Products
- 12.1.6.3. Company Financials
- 12.1.6.4. SWOT Analysis
- 12.1.7 Bio-Rad Laboratories
- 12.1.7.1. Company Overview
- 12.1.7.2. Products
- 12.1.7.3. Company Financials
- 12.1.7.4. SWOT Analysis
- 12.1.8 Thermo Fisher Scientific
- 12.1.8.1. Company Overview
- 12.1.8.2. Products
- 12.1.8.3. Company Financials
- 12.1.8.4. SWOT Analysis
- 12.1.9 Bio-Rad Laboratories
- 12.1.9.1. Company Overview
- 12.1.9.2. Products
- 12.1.9.3. Company Financials
- 12.1.9.4. SWOT Analysis
- 12.1.10 Merck KGaA
- 12.1.10.1. Company Overview
- 12.1.10.2. Products
- 12.1.10.3. Company Financials
- 12.1.10.4. SWOT Analysis
- 12.1.11 Agilent Technologies
- 12.1.11.1. Company Overview
- 12.1.11.2. Products
- 12.1.11.3. Company Financials
- 12.1.11.4. SWOT Analysis
- 12.1.12 Abcam Plc
- 12.1.12.1. Company Overview
- 12.1.12.2. Products
- 12.1.12.3. Company Financials
- 12.1.12.4. SWOT Analysis
- 12.1.13 Bruker Corporation
- 12.1.13.1. Company Overview
- 12.1.13.2. Products
- 12.1.13.3. Company Financials
- 12.1.13.4. SWOT Analysis
- 12.1.14 Qiagen NV
- 12.1.14.1. Company Overview
- 12.1.14.2. Products
- 12.1.14.3. Company Financials
- 12.1.14.4. SWOT Analysis
- 12.1.15 Roche Diagnostics
- 12.1.15.1. Company Overview
- 12.1.15.2. Products
- 12.1.15.3. Company Financials
- 12.1.15.4. SWOT Analysis
- 12.1.1 Merck Group
- 12.2. Market Entropy
- 12.2.1 Company's Key Areas Served
- 12.2.2 Recent Developments
- 12.3. Company Market Share Analysis 2025
- 12.3.1 Top 5 Companies Market Share Analysis
- 12.3.2 Top 3 Companies Market Share Analysis
- 12.4. List of Potential Customers
- 13. Research Methodology
List of Figures
- Figure 1: Global Protein Detection Quantification Revenue Breakdown (billion, %) by Region 2025 & 2033
- Figure 2: North America Protein Detection Quantification Revenue (billion), by Application 2025 & 2033
- Figure 3: North America Protein Detection Quantification Revenue Share (%), by Application 2025 & 2033
- Figure 4: North America Protein Detection Quantification Revenue (billion), by Types 2025 & 2033
- Figure 5: North America Protein Detection Quantification Revenue Share (%), by Types 2025 & 2033
- Figure 6: North America Protein Detection Quantification Revenue (billion), by Country 2025 & 2033
- Figure 7: North America Protein Detection Quantification Revenue Share (%), by Country 2025 & 2033
- Figure 8: South America Protein Detection Quantification Revenue (billion), by Application 2025 & 2033
- Figure 9: South America Protein Detection Quantification Revenue Share (%), by Application 2025 & 2033
- Figure 10: South America Protein Detection Quantification Revenue (billion), by Types 2025 & 2033
- Figure 11: South America Protein Detection Quantification Revenue Share (%), by Types 2025 & 2033
- Figure 12: South America Protein Detection Quantification Revenue (billion), by Country 2025 & 2033
- Figure 13: South America Protein Detection Quantification Revenue Share (%), by Country 2025 & 2033
- Figure 14: Europe Protein Detection Quantification Revenue (billion), by Application 2025 & 2033
- Figure 15: Europe Protein Detection Quantification Revenue Share (%), by Application 2025 & 2033
- Figure 16: Europe Protein Detection Quantification Revenue (billion), by Types 2025 & 2033
- Figure 17: Europe Protein Detection Quantification Revenue Share (%), by Types 2025 & 2033
- Figure 18: Europe Protein Detection Quantification Revenue (billion), by Country 2025 & 2033
- Figure 19: Europe Protein Detection Quantification Revenue Share (%), by Country 2025 & 2033
- Figure 20: Middle East & Africa Protein Detection Quantification Revenue (billion), by Application 2025 & 2033
- Figure 21: Middle East & Africa Protein Detection Quantification Revenue Share (%), by Application 2025 & 2033
- Figure 22: Middle East & Africa Protein Detection Quantification Revenue (billion), by Types 2025 & 2033
- Figure 23: Middle East & Africa Protein Detection Quantification Revenue Share (%), by Types 2025 & 2033
- Figure 24: Middle East & Africa Protein Detection Quantification Revenue (billion), by Country 2025 & 2033
- Figure 25: Middle East & Africa Protein Detection Quantification Revenue Share (%), by Country 2025 & 2033
- Figure 26: Asia Pacific Protein Detection Quantification Revenue (billion), by Application 2025 & 2033
- Figure 27: Asia Pacific Protein Detection Quantification Revenue Share (%), by Application 2025 & 2033
- Figure 28: Asia Pacific Protein Detection Quantification Revenue (billion), by Types 2025 & 2033
- Figure 29: Asia Pacific Protein Detection Quantification Revenue Share (%), by Types 2025 & 2033
- Figure 30: Asia Pacific Protein Detection Quantification Revenue (billion), by Country 2025 & 2033
- Figure 31: Asia Pacific Protein Detection Quantification Revenue Share (%), by Country 2025 & 2033
List of Tables
- Table 1: Global Protein Detection Quantification Revenue billion Forecast, by Application 2020 & 2033
- Table 2: Global Protein Detection Quantification Revenue billion Forecast, by Types 2020 & 2033
- Table 3: Global Protein Detection Quantification Revenue billion Forecast, by Region 2020 & 2033
- Table 4: Global Protein Detection Quantification Revenue billion Forecast, by Application 2020 & 2033
- Table 5: Global Protein Detection Quantification Revenue billion Forecast, by Types 2020 & 2033
- Table 6: Global Protein Detection Quantification Revenue billion Forecast, by Country 2020 & 2033
- Table 7: United States Protein Detection Quantification Revenue (billion) Forecast, by Application 2020 & 2033
- Table 8: Canada Protein Detection Quantification Revenue (billion) Forecast, by Application 2020 & 2033
- Table 9: Mexico Protein Detection Quantification Revenue (billion) Forecast, by Application 2020 & 2033
- Table 10: Global Protein Detection Quantification Revenue billion Forecast, by Application 2020 & 2033
- Table 11: Global Protein Detection Quantification Revenue billion Forecast, by Types 2020 & 2033
- Table 12: Global Protein Detection Quantification Revenue billion Forecast, by Country 2020 & 2033
- Table 13: Brazil Protein Detection Quantification Revenue (billion) Forecast, by Application 2020 & 2033
- Table 14: Argentina Protein Detection Quantification Revenue (billion) Forecast, by Application 2020 & 2033
- Table 15: Rest of South America Protein Detection Quantification Revenue (billion) Forecast, by Application 2020 & 2033
- Table 16: Global Protein Detection Quantification Revenue billion Forecast, by Application 2020 & 2033
- Table 17: Global Protein Detection Quantification Revenue billion Forecast, by Types 2020 & 2033
- Table 18: Global Protein Detection Quantification Revenue billion Forecast, by Country 2020 & 2033
- Table 19: United Kingdom Protein Detection Quantification Revenue (billion) Forecast, by Application 2020 & 2033
- Table 20: Germany Protein Detection Quantification Revenue (billion) Forecast, by Application 2020 & 2033
- Table 21: France Protein Detection Quantification Revenue (billion) Forecast, by Application 2020 & 2033
- Table 22: Italy Protein Detection Quantification Revenue (billion) Forecast, by Application 2020 & 2033
- Table 23: Spain Protein Detection Quantification Revenue (billion) Forecast, by Application 2020 & 2033
- Table 24: Russia Protein Detection Quantification Revenue (billion) Forecast, by Application 2020 & 2033
- Table 25: Benelux Protein Detection Quantification Revenue (billion) Forecast, by Application 2020 & 2033
- Table 26: Nordics Protein Detection Quantification Revenue (billion) Forecast, by Application 2020 & 2033
- Table 27: Rest of Europe Protein Detection Quantification Revenue (billion) Forecast, by Application 2020 & 2033
- Table 28: Global Protein Detection Quantification Revenue billion Forecast, by Application 2020 & 2033
- Table 29: Global Protein Detection Quantification Revenue billion Forecast, by Types 2020 & 2033
- Table 30: Global Protein Detection Quantification Revenue billion Forecast, by Country 2020 & 2033
- Table 31: Turkey Protein Detection Quantification Revenue (billion) Forecast, by Application 2020 & 2033
- Table 32: Israel Protein Detection Quantification Revenue (billion) Forecast, by Application 2020 & 2033
- Table 33: GCC Protein Detection Quantification Revenue (billion) Forecast, by Application 2020 & 2033
- Table 34: North Africa Protein Detection Quantification Revenue (billion) Forecast, by Application 2020 & 2033
- Table 35: South Africa Protein Detection Quantification Revenue (billion) Forecast, by Application 2020 & 2033
- Table 36: Rest of Middle East & Africa Protein Detection Quantification Revenue (billion) Forecast, by Application 2020 & 2033
- Table 37: Global Protein Detection Quantification Revenue billion Forecast, by Application 2020 & 2033
- Table 38: Global Protein Detection Quantification Revenue billion Forecast, by Types 2020 & 2033
- Table 39: Global Protein Detection Quantification Revenue billion Forecast, by Country 2020 & 2033
- Table 40: China Protein Detection Quantification Revenue (billion) Forecast, by Application 2020 & 2033
- Table 41: India Protein Detection Quantification Revenue (billion) Forecast, by Application 2020 & 2033
- Table 42: Japan Protein Detection Quantification Revenue (billion) Forecast, by Application 2020 & 2033
- Table 43: South Korea Protein Detection Quantification Revenue (billion) Forecast, by Application 2020 & 2033
- Table 44: ASEAN Protein Detection Quantification Revenue (billion) Forecast, by Application 2020 & 2033
- Table 45: Oceania Protein Detection Quantification Revenue (billion) Forecast, by Application 2020 & 2033
- Table 46: Rest of Asia Pacific Protein Detection Quantification Revenue (billion) Forecast, by Application 2020 & 2033
Frequently Asked Questions
1. What is the projected Compound Annual Growth Rate (CAGR) of the Protein Detection Quantification?
The projected CAGR is approximately 7.19%.
2. Which companies are prominent players in the Protein Detection Quantification?
Key companies in the market include Merck Group, Danaher Corporation, RayBiotech, Shimadzu, PerkinElmer, GE Healthcare, Bio-Rad Laboratories, Thermo Fisher Scientific, Bio-Rad Laboratories, Merck KGaA, Agilent Technologies, Abcam Plc, Bruker Corporation, Qiagen NV, Roche Diagnostics.
3. What are the main segments of the Protein Detection Quantification?
The market segments include Application, Types.
4. Can you provide details about the market size?
The market size is estimated to be USD 3.2 billion as of 2022.
5. What are some drivers contributing to market growth?
N/A
6. What are the notable trends driving market growth?
N/A
7. Are there any restraints impacting market growth?
N/A
8. Can you provide examples of recent developments in the market?
N/A
9. What pricing options are available for accessing the report?
Pricing options include single-user, multi-user, and enterprise licenses priced at USD 3350.00, USD 5025.00, and USD 6700.00 respectively.
10. Is the market size provided in terms of value or volume?
The market size is provided in terms of value, measured in billion.
11. Are there any specific market keywords associated with the report?
Yes, the market keyword associated with the report is "Protein Detection Quantification," which aids in identifying and referencing the specific market segment covered.
12. How do I determine which pricing option suits my needs best?
The pricing options vary based on user requirements and access needs. Individual users may opt for single-user licenses, while businesses requiring broader access may choose multi-user or enterprise licenses for cost-effective access to the report.
13. Are there any additional resources or data provided in the Protein Detection Quantification report?
While the report offers comprehensive insights, it's advisable to review the specific contents or supplementary materials provided to ascertain if additional resources or data are available.
14. How can I stay updated on further developments or reports in the Protein Detection Quantification?
To stay informed about further developments, trends, and reports in the Protein Detection Quantification, consider subscribing to industry newsletters, following relevant companies and organizations, or regularly checking reputable industry news sources and publications.
Methodology
Step 1 - Identification of Relevant Samples Size from Population Database


Step 2 - Approaches for Defining Global Market Size (Value, Volume* & Price*)

Note*: In applicable scenarios
Step 3 - Data Sources
Primary Research
- Web Analytics
- Survey Reports
- Research Institute
- Latest Research Reports
- Opinion Leaders
Secondary Research
- Annual Reports
- White Paper
- Latest Press Release
- Industry Association
- Paid Database
- Investor Presentations

Step 4 - Data Triangulation
Involves using different sources of information in order to increase the validity of a study
These sources are likely to be stakeholders in a program - participants, other researchers, program staff, other community members, and so on.
Then we put all data in single framework & apply various statistical tools to find out the dynamic on the market.
During the analysis stage, feedback from the stakeholder groups would be compared to determine areas of agreement as well as areas of divergence