

Key Insights
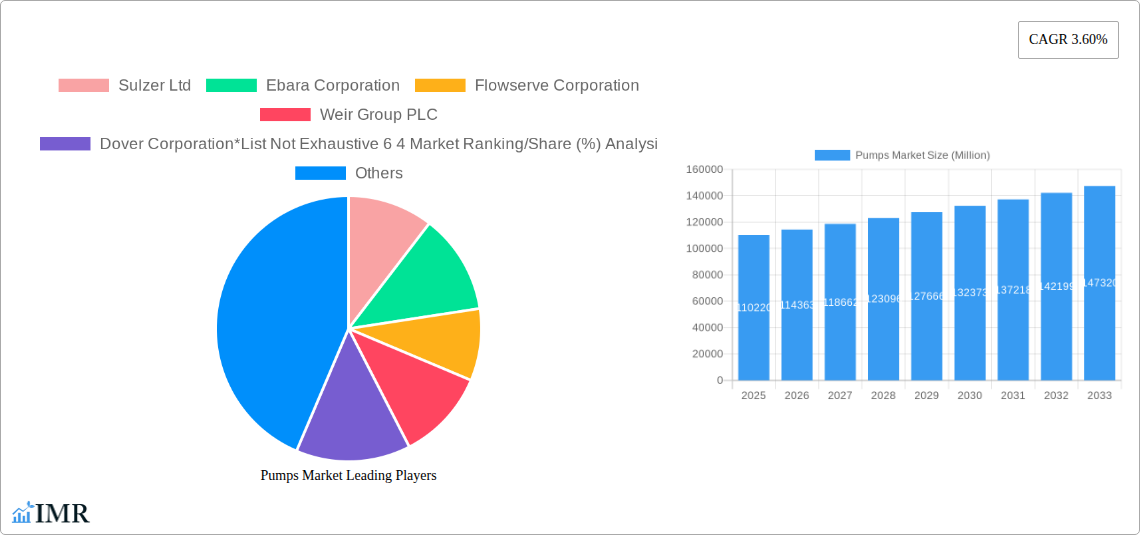
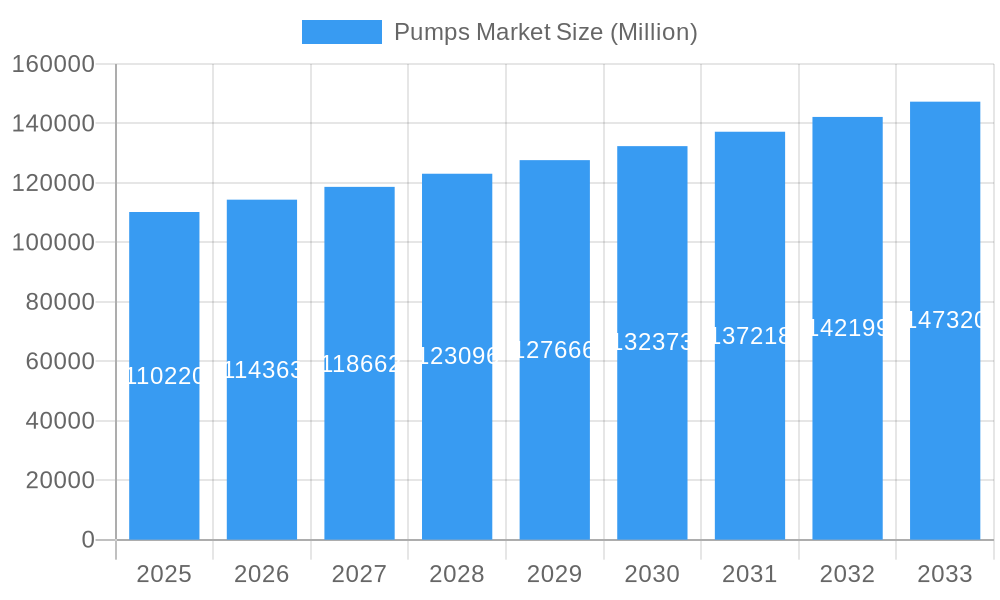
The global pumps market, valued at $110.22 billion in 2025, is projected to experience steady growth, driven by increasing demand across diverse end-use sectors. A Compound Annual Growth Rate (CAGR) of 3.60% from 2025 to 2033 indicates a significant expansion, fueled by several key factors. The oil and gas industry, a major consumer of pumps, is undergoing substantial investment in infrastructure development and modernization, boosting demand for high-capacity and specialized pumps. Similarly, the water and wastewater treatment sector is experiencing growth due to increasing urbanization and stringent environmental regulations, creating opportunities for efficient and reliable pumping solutions. The chemicals and petrochemicals industry, characterized by complex processes requiring precise fluid handling, also significantly contributes to market growth. Technological advancements, such as the development of energy-efficient pumps and smart pump technologies with predictive maintenance capabilities, are further driving market expansion. Growth is also observed in centrifugal pumps due to their versatility and cost-effectiveness, though positive displacement pumps maintain a significant share due to their suitability for high-pressure and viscous fluids. Regional variations are expected, with North America and Europe maintaining strong market shares, while the Asia-Pacific region is poised for significant growth driven by rapid industrialization and infrastructure development in countries like China and India.
Pumps Market Market Size (In Billion)
Despite the positive outlook, certain restraints could impact market growth. Fluctuations in commodity prices, particularly for raw materials used in pump manufacturing, can influence production costs and affect market dynamics. Furthermore, increasing regulatory scrutiny related to environmental impact and energy efficiency necessitates manufacturers to continuously innovate and adapt to meet stringent standards. Competition among established players like Sulzer Ltd, Ebara Corporation, and Flowserve Corporation remains intense, influencing pricing strategies and market share dynamics. However, the overall growth trajectory remains positive, underpinned by the long-term growth prospects of the end-use industries and ongoing technological advancements in pump design and manufacturing. The market is expected to reach approximately $145 billion by 2033, representing a significant investment opportunity for players across the value chain.
Pumps Market Company Market Share
Pumps Market Report: 2019-2033 Forecast
This comprehensive report provides a detailed analysis of the global pumps market, encompassing historical data (2019-2024), current estimates (2025), and future projections (2025-2033). It delves into market dynamics, growth trends, regional dominance, product landscapes, and key players, offering invaluable insights for industry professionals, investors, and strategic decision-makers. The report segments the market by end-user (Oil and Gas, Water and Wastewater, Chemicals and Petrochemicals, Mining Industry, Power Generation, Other End Users) and pump type (Centrifugal Pump, Positive Displacement Pump), providing granular market sizing and growth projections in million units.
Pumps Market Dynamics & Structure
The global pumps market exhibits a moderately concentrated structure, with several major players holding significant market shares. The market is driven by technological innovations, including the development of energy-efficient pumps, smart pumps with advanced monitoring capabilities, and specialized pumps for niche applications. Stringent environmental regulations concerning fluid handling and energy consumption are further shaping market dynamics. Competitive pressure from substitute technologies, such as alternative fluid handling methods, also plays a role. The market is characterized by continuous mergers and acquisitions (M&A) activity, reflecting consolidation and expansion strategies among key players.
- Market Concentration: xx% of the market share held by the top 6 players in 2024.
- Technological Innovation: Significant investments in R&D focused on energy efficiency and smart pump technologies.
- Regulatory Framework: Stringent environmental regulations driving demand for energy-efficient and eco-friendly pumps.
- M&A Activity: xx M&A deals concluded in the past 5 years, with an average deal value of xx million USD.
- Innovation Barriers: High R&D costs and the need for specialized expertise can hinder innovation.
Pumps Market Growth Trends & Insights
The global pumps market is projected to experience robust growth during the forecast period (2025-2033), driven by increasing industrialization, infrastructure development, and rising demand across diverse end-use sectors. The market size is expected to reach xx million units by 2033, exhibiting a CAGR of xx% during the forecast period. This growth is fueled by rising investments in water and wastewater treatment infrastructure, expanding oil and gas exploration activities, and the growth of the chemical and petrochemical industries. Technological advancements, such as the adoption of smart pumps and the development of high-efficiency designs, further contribute to market expansion. Changing consumer preferences towards sustainable solutions and increasing awareness of energy efficiency also influence market growth.
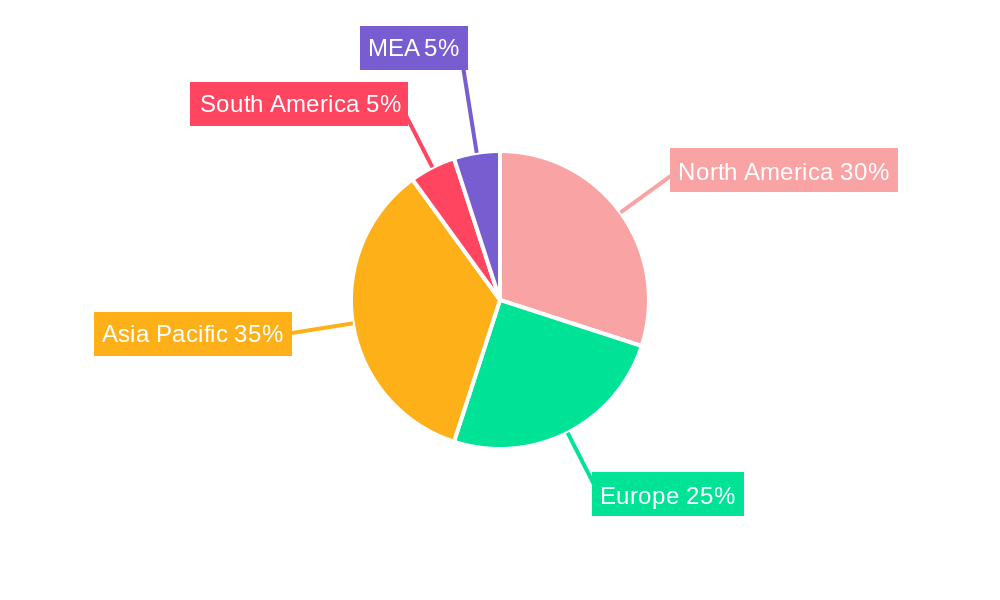
Dominant Regions, Countries, or Segments in Pumps Market
The Oil and Gas segment currently holds the largest market share, driven by robust exploration and production activities globally. However, significant growth potential exists in the Water and Wastewater sector, fueled by increasing urbanization and investments in water infrastructure. Geographically, North America and Europe are presently leading the market, but the Asia-Pacific region is expected to witness the most rapid growth in the coming years due to rapid industrialization and infrastructural development in emerging economies.
- Leading Segment: Oil and Gas (xx million units in 2025), followed by Water and Wastewater (xx million units in 2025).
- Fastest-Growing Region: Asia-Pacific, driven by rapid industrialization and infrastructure expansion.
- Key Drivers: Government investments in infrastructure projects, increasing industrial activities, and rising environmental concerns.
Pumps Market Product Landscape
The pumps market offers a diverse range of products, including centrifugal pumps, positive displacement pumps, and specialized pumps for specific applications. Recent innovations focus on enhancing energy efficiency, improving durability, and incorporating smart functionalities for remote monitoring and predictive maintenance. These advancements cater to the growing demand for sophisticated and reliable pumping solutions across various industries. Unique selling propositions often include improved performance metrics (e.g., higher efficiency, reduced noise levels), enhanced durability, and advanced control systems.
Key Drivers, Barriers & Challenges in Pumps Market
Key Drivers: Rising industrialization, urbanization, and investments in infrastructure projects are key drivers. Technological advancements, including the development of energy-efficient pumps and smart pump technologies, also propel market growth. Stringent environmental regulations are fostering demand for eco-friendly pumps.
Key Challenges: Supply chain disruptions, fluctuations in raw material prices, and intense competition among established players pose challenges. Regulatory compliance costs and potential trade restrictions also impact market dynamics. The impact of these challenges is estimated to reduce market growth by xx% by 2033.
Emerging Opportunities in Pumps Market
Untapped markets in developing economies present significant growth opportunities. The increasing adoption of smart pumps and the development of innovative applications in renewable energy and water management create further market potential. Evolving consumer preferences towards sustainable and energy-efficient solutions drive demand for eco-friendly pump technologies.
Growth Accelerators in the Pumps Market Industry
Technological breakthroughs in pump design and materials science are expected to drive long-term growth. Strategic partnerships and collaborations between pump manufacturers and end-users are enhancing product development and market penetration. Expansion into new geographical markets, especially in developing countries, and the development of specialized pumps for niche applications offer significant growth potential.
Key Players Shaping the Pumps Market Market
- Sulzer Ltd
- Ebara Corporation
- Flowserve Corporation
- Weir Group PLC
- Dover Corporation
- Clyde Union Inc
- Schlumberger Ltd
- KSB SE & Co KGaA
- ITT Inc
- Grundfos Holding AS
- Baker Hughes Company
Notable Milestones in Pumps Market Sector
- December 2023: The Packo Pumps website merged with the Verder Liquids website, expanding product offerings.
- May 2023: ClydeUnion Pumps signed an agreement with ONGC for pump maintenance services in India, expanding its service footprint.
- February 2023: Motion & Control Enterprises acquired Precision Pump & Valve, strengthening its presence in the oil and gas sector.
In-Depth Pumps Market Market Outlook
The pumps market is poised for continued expansion, driven by ongoing industrialization, infrastructural development, and the rising adoption of advanced pump technologies. Strategic investments in R&D, strategic partnerships, and expansion into new markets will be crucial for maintaining strong growth momentum. The increasing demand for sustainable and energy-efficient pumping solutions presents significant opportunities for innovation and market leadership.
Pumps Market Segmentation
-
1. Type
- 1.1. Centrifugal Pump
- 1.2. Positive Displacement Pump
-
2. End User
- 2.1. Oil and Gas
- 2.2. Water and Wastewater
- 2.3. Chemicals and Petrochemicals
- 2.4. Mining Industry
- 2.5. Power Generation
- 2.6. Other End Users
Pumps Market Segmentation By Geography
-
1. North America
- 1.1. United States
- 1.2. Canada
- 1.3. Rest of North America
-
2. Europe
- 2.1. Germany
- 2.2. France
- 2.3. Spain
- 2.4. United Kingdom
- 2.5. Russia
- 2.6. NORDIC
- 2.7. Italy
- 2.8. Turkey
- 2.9. Rest of Europe
-
3. Asia Pacific
- 3.1. China
- 3.2. India
- 3.3. Japan
- 3.4. South Korea
- 3.5. Australia
- 3.6. Malaysia
- 3.7. Thailand
- 3.8. Indonesia
- 3.9. Vietnam
- 3.10. Rest of Asia Pacific
-
4. South America
- 4.1. Brazil
- 4.2. Argentina
- 4.3. Colombia
- 4.4. Rest of South America
-
5. Middle East and Africa
- 5.1. Saudi Arabia
- 5.2. United Arab Emirates
- 5.3. South Africa
- 5.4. Nigeria
- 5.5. Qatar
- 5.6. Egypt
- 5.7. Rest of the Middle East and Africa
Pumps Market Regional Market Share
Geographic Coverage of Pumps Market
Pumps Market REPORT HIGHLIGHTS
| Aspects | Details |
|---|---|
| Study Period | 2020-2034 |
| Base Year | 2025 |
| Estimated Year | 2026 |
| Forecast Period | 2026-2034 |
| Historical Period | 2020-2025 |
| Growth Rate | CAGR of 3.60% from 2020-2034 |
| Segmentation |
|
Table of Contents
- 1. Introduction
- 1.1. Research Scope
- 1.2. Market Segmentation
- 1.3. Research Objective
- 1.4. Definitions and Assumptions
- 2. Executive Summary
- 2.1. Market Snapshot
- 3. Market Dynamics
- 3.1. Market Drivers
- 3.2. Market Restrains
- 3.3. Market Trends
- 3.4. Market Opportunities
- 4. Market Factor Analysis
- 4.1. Porters Five Forces
- 4.1.1. Bargaining Power of Suppliers
- 4.1.2. Bargaining Power of Buyers
- 4.1.3. Threat of New Entrants
- 4.1.4. Threat of Substitutes
- 4.1.5. Competitive Rivalry
- 4.2. PESTEL analysis
- 4.3. BCG Analysis
- 4.3.1. Stars (High Growth, High Market Share)
- 4.3.2. Cash Cows (Low Growth, High Market Share)
- 4.3.3. Question Mark (High Growth, Low Market Share)
- 4.3.4. Dogs (Low Growth, Low Market Share)
- 4.4. Ansoff Matrix Analysis
- 4.5. Supply Chain Analysis
- 4.6. Regulatory Landscape
- 4.7. Current Market Potential and Opportunity Assessment (TAM–SAM–SOM Framework)
- 4.8. IMR Analyst Note
- 4.1. Porters Five Forces
- 5. Market Analysis, Insights and Forecast 2021-2033
- 5.1. Market Analysis, Insights and Forecast - by Type
- 5.1.1. Centrifugal Pump
- 5.1.2. Positive Displacement Pump
- 5.2. Market Analysis, Insights and Forecast - by End User
- 5.2.1. Oil and Gas
- 5.2.2. Water and Wastewater
- 5.2.3. Chemicals and Petrochemicals
- 5.2.4. Mining Industry
- 5.2.5. Power Generation
- 5.2.6. Other End Users
- 5.3. Market Analysis, Insights and Forecast - by Region
- 5.3.1. North America
- 5.3.2. Europe
- 5.3.3. Asia Pacific
- 5.3.4. South America
- 5.3.5. Middle East and Africa
- 5.1. Market Analysis, Insights and Forecast - by Type
- 6. Global Pumps Market Analysis, Insights and Forecast, 2021-2033
- 6.1. Market Analysis, Insights and Forecast - by Type
- 6.1.1. Centrifugal Pump
- 6.1.2. Positive Displacement Pump
- 6.2. Market Analysis, Insights and Forecast - by End User
- 6.2.1. Oil and Gas
- 6.2.2. Water and Wastewater
- 6.2.3. Chemicals and Petrochemicals
- 6.2.4. Mining Industry
- 6.2.5. Power Generation
- 6.2.6. Other End Users
- 6.1. Market Analysis, Insights and Forecast - by Type
- 7. North America Pumps Market Analysis, Insights and Forecast, 2020-2032
- 7.1. Market Analysis, Insights and Forecast - by Type
- 7.1.1. Centrifugal Pump
- 7.1.2. Positive Displacement Pump
- 7.2. Market Analysis, Insights and Forecast - by End User
- 7.2.1. Oil and Gas
- 7.2.2. Water and Wastewater
- 7.2.3. Chemicals and Petrochemicals
- 7.2.4. Mining Industry
- 7.2.5. Power Generation
- 7.2.6. Other End Users
- 7.1. Market Analysis, Insights and Forecast - by Type
- 8. Europe Pumps Market Analysis, Insights and Forecast, 2020-2032
- 8.1. Market Analysis, Insights and Forecast - by Type
- 8.1.1. Centrifugal Pump
- 8.1.2. Positive Displacement Pump
- 8.2. Market Analysis, Insights and Forecast - by End User
- 8.2.1. Oil and Gas
- 8.2.2. Water and Wastewater
- 8.2.3. Chemicals and Petrochemicals
- 8.2.4. Mining Industry
- 8.2.5. Power Generation
- 8.2.6. Other End Users
- 8.1. Market Analysis, Insights and Forecast - by Type
- 9. Asia Pacific Pumps Market Analysis, Insights and Forecast, 2020-2032
- 9.1. Market Analysis, Insights and Forecast - by Type
- 9.1.1. Centrifugal Pump
- 9.1.2. Positive Displacement Pump
- 9.2. Market Analysis, Insights and Forecast - by End User
- 9.2.1. Oil and Gas
- 9.2.2. Water and Wastewater
- 9.2.3. Chemicals and Petrochemicals
- 9.2.4. Mining Industry
- 9.2.5. Power Generation
- 9.2.6. Other End Users
- 9.1. Market Analysis, Insights and Forecast - by Type
- 10. South America Pumps Market Analysis, Insights and Forecast, 2020-2032
- 10.1. Market Analysis, Insights and Forecast - by Type
- 10.1.1. Centrifugal Pump
- 10.1.2. Positive Displacement Pump
- 10.2. Market Analysis, Insights and Forecast - by End User
- 10.2.1. Oil and Gas
- 10.2.2. Water and Wastewater
- 10.2.3. Chemicals and Petrochemicals
- 10.2.4. Mining Industry
- 10.2.5. Power Generation
- 10.2.6. Other End Users
- 10.1. Market Analysis, Insights and Forecast - by Type
- 11. Middle East and Africa Pumps Market Analysis, Insights and Forecast, 2020-2032
- 11.1. Market Analysis, Insights and Forecast - by Type
- 11.1.1. Centrifugal Pump
- 11.1.2. Positive Displacement Pump
- 11.2. Market Analysis, Insights and Forecast - by End User
- 11.2.1. Oil and Gas
- 11.2.2. Water and Wastewater
- 11.2.3. Chemicals and Petrochemicals
- 11.2.4. Mining Industry
- 11.2.5. Power Generation
- 11.2.6. Other End Users
- 11.1. Market Analysis, Insights and Forecast - by Type
- 12. Competitive Analysis
- 12.1. Company Profiles
- 12.1.1 Sulzer Ltd
- 12.1.1.1. Company Overview
- 12.1.1.2. Products
- 12.1.1.3. Company Financials
- 12.1.1.4. SWOT Analysis
- 12.1.2 Ebara Corporation
- 12.1.2.1. Company Overview
- 12.1.2.2. Products
- 12.1.2.3. Company Financials
- 12.1.2.4. SWOT Analysis
- 12.1.3 Flowserve Corporation
- 12.1.3.1. Company Overview
- 12.1.3.2. Products
- 12.1.3.3. Company Financials
- 12.1.3.4. SWOT Analysis
- 12.1.4 Weir Group PLC
- 12.1.4.1. Company Overview
- 12.1.4.2. Products
- 12.1.4.3. Company Financials
- 12.1.4.4. SWOT Analysis
- 12.1.5 Dover Corporation*List Not Exhaustive 6 4 Market Ranking/Share (%) Analysi
- 12.1.5.1. Company Overview
- 12.1.5.2. Products
- 12.1.5.3. Company Financials
- 12.1.5.4. SWOT Analysis
- 12.1.6 Clyde Union Inc
- 12.1.6.1. Company Overview
- 12.1.6.2. Products
- 12.1.6.3. Company Financials
- 12.1.6.4. SWOT Analysis
- 12.1.7 Schlumberger Ltd
- 12.1.7.1. Company Overview
- 12.1.7.2. Products
- 12.1.7.3. Company Financials
- 12.1.7.4. SWOT Analysis
- 12.1.8 KSB SE & Co KGaA
- 12.1.8.1. Company Overview
- 12.1.8.2. Products
- 12.1.8.3. Company Financials
- 12.1.8.4. SWOT Analysis
- 12.1.9 ITT Inc
- 12.1.9.1. Company Overview
- 12.1.9.2. Products
- 12.1.9.3. Company Financials
- 12.1.9.4. SWOT Analysis
- 12.1.10 Grundfos Holding AS
- 12.1.10.1. Company Overview
- 12.1.10.2. Products
- 12.1.10.3. Company Financials
- 12.1.10.4. SWOT Analysis
- 12.1.11 Baker Hughes Company
- 12.1.11.1. Company Overview
- 12.1.11.2. Products
- 12.1.11.3. Company Financials
- 12.1.11.4. SWOT Analysis
- 12.1.1 Sulzer Ltd
- 12.2. Market Entropy
- 12.2.1 Company's Key Areas Served
- 12.2.2 Recent Developments
- 12.3. Company Market Share Analysis 2025
- 12.3.1 Top 5 Companies Market Share Analysis
- 12.3.2 Top 3 Companies Market Share Analysis
- 12.4. List of Potential Customers
- 13. Research Methodology
List of Figures
- Figure 1: Global Pumps Market Revenue Breakdown (Million, %) by Region 2025 & 2033
- Figure 2: Global Pumps Market Volume Breakdown (K Unit, %) by Region 2025 & 2033
- Figure 3: North America Pumps Market Revenue (Million), by Type 2025 & 2033
- Figure 4: North America Pumps Market Volume (K Unit), by Type 2025 & 2033
- Figure 5: North America Pumps Market Revenue Share (%), by Type 2025 & 2033
- Figure 6: North America Pumps Market Volume Share (%), by Type 2025 & 2033
- Figure 7: North America Pumps Market Revenue (Million), by End User 2025 & 2033
- Figure 8: North America Pumps Market Volume (K Unit), by End User 2025 & 2033
- Figure 9: North America Pumps Market Revenue Share (%), by End User 2025 & 2033
- Figure 10: North America Pumps Market Volume Share (%), by End User 2025 & 2033
- Figure 11: North America Pumps Market Revenue (Million), by Country 2025 & 2033
- Figure 12: North America Pumps Market Volume (K Unit), by Country 2025 & 2033
- Figure 13: North America Pumps Market Revenue Share (%), by Country 2025 & 2033
- Figure 14: North America Pumps Market Volume Share (%), by Country 2025 & 2033
- Figure 15: Europe Pumps Market Revenue (Million), by Type 2025 & 2033
- Figure 16: Europe Pumps Market Volume (K Unit), by Type 2025 & 2033
- Figure 17: Europe Pumps Market Revenue Share (%), by Type 2025 & 2033
- Figure 18: Europe Pumps Market Volume Share (%), by Type 2025 & 2033
- Figure 19: Europe Pumps Market Revenue (Million), by End User 2025 & 2033
- Figure 20: Europe Pumps Market Volume (K Unit), by End User 2025 & 2033
- Figure 21: Europe Pumps Market Revenue Share (%), by End User 2025 & 2033
- Figure 22: Europe Pumps Market Volume Share (%), by End User 2025 & 2033
- Figure 23: Europe Pumps Market Revenue (Million), by Country 2025 & 2033
- Figure 24: Europe Pumps Market Volume (K Unit), by Country 2025 & 2033
- Figure 25: Europe Pumps Market Revenue Share (%), by Country 2025 & 2033
- Figure 26: Europe Pumps Market Volume Share (%), by Country 2025 & 2033
- Figure 27: Asia Pacific Pumps Market Revenue (Million), by Type 2025 & 2033
- Figure 28: Asia Pacific Pumps Market Volume (K Unit), by Type 2025 & 2033
- Figure 29: Asia Pacific Pumps Market Revenue Share (%), by Type 2025 & 2033
- Figure 30: Asia Pacific Pumps Market Volume Share (%), by Type 2025 & 2033
- Figure 31: Asia Pacific Pumps Market Revenue (Million), by End User 2025 & 2033
- Figure 32: Asia Pacific Pumps Market Volume (K Unit), by End User 2025 & 2033
- Figure 33: Asia Pacific Pumps Market Revenue Share (%), by End User 2025 & 2033
- Figure 34: Asia Pacific Pumps Market Volume Share (%), by End User 2025 & 2033
- Figure 35: Asia Pacific Pumps Market Revenue (Million), by Country 2025 & 2033
- Figure 36: Asia Pacific Pumps Market Volume (K Unit), by Country 2025 & 2033
- Figure 37: Asia Pacific Pumps Market Revenue Share (%), by Country 2025 & 2033
- Figure 38: Asia Pacific Pumps Market Volume Share (%), by Country 2025 & 2033
- Figure 39: South America Pumps Market Revenue (Million), by Type 2025 & 2033
- Figure 40: South America Pumps Market Volume (K Unit), by Type 2025 & 2033
- Figure 41: South America Pumps Market Revenue Share (%), by Type 2025 & 2033
- Figure 42: South America Pumps Market Volume Share (%), by Type 2025 & 2033
- Figure 43: South America Pumps Market Revenue (Million), by End User 2025 & 2033
- Figure 44: South America Pumps Market Volume (K Unit), by End User 2025 & 2033
- Figure 45: South America Pumps Market Revenue Share (%), by End User 2025 & 2033
- Figure 46: South America Pumps Market Volume Share (%), by End User 2025 & 2033
- Figure 47: South America Pumps Market Revenue (Million), by Country 2025 & 2033
- Figure 48: South America Pumps Market Volume (K Unit), by Country 2025 & 2033
- Figure 49: South America Pumps Market Revenue Share (%), by Country 2025 & 2033
- Figure 50: South America Pumps Market Volume Share (%), by Country 2025 & 2033
- Figure 51: Middle East and Africa Pumps Market Revenue (Million), by Type 2025 & 2033
- Figure 52: Middle East and Africa Pumps Market Volume (K Unit), by Type 2025 & 2033
- Figure 53: Middle East and Africa Pumps Market Revenue Share (%), by Type 2025 & 2033
- Figure 54: Middle East and Africa Pumps Market Volume Share (%), by Type 2025 & 2033
- Figure 55: Middle East and Africa Pumps Market Revenue (Million), by End User 2025 & 2033
- Figure 56: Middle East and Africa Pumps Market Volume (K Unit), by End User 2025 & 2033
- Figure 57: Middle East and Africa Pumps Market Revenue Share (%), by End User 2025 & 2033
- Figure 58: Middle East and Africa Pumps Market Volume Share (%), by End User 2025 & 2033
- Figure 59: Middle East and Africa Pumps Market Revenue (Million), by Country 2025 & 2033
- Figure 60: Middle East and Africa Pumps Market Volume (K Unit), by Country 2025 & 2033
- Figure 61: Middle East and Africa Pumps Market Revenue Share (%), by Country 2025 & 2033
- Figure 62: Middle East and Africa Pumps Market Volume Share (%), by Country 2025 & 2033
List of Tables
- Table 1: Global Pumps Market Revenue Million Forecast, by Type 2020 & 2033
- Table 2: Global Pumps Market Volume K Unit Forecast, by Type 2020 & 2033
- Table 3: Global Pumps Market Revenue Million Forecast, by End User 2020 & 2033
- Table 4: Global Pumps Market Volume K Unit Forecast, by End User 2020 & 2033
- Table 5: Global Pumps Market Revenue Million Forecast, by Region 2020 & 2033
- Table 6: Global Pumps Market Volume K Unit Forecast, by Region 2020 & 2033
- Table 7: Global Pumps Market Revenue Million Forecast, by Type 2020 & 2033
- Table 8: Global Pumps Market Volume K Unit Forecast, by Type 2020 & 2033
- Table 9: Global Pumps Market Revenue Million Forecast, by End User 2020 & 2033
- Table 10: Global Pumps Market Volume K Unit Forecast, by End User 2020 & 2033
- Table 11: Global Pumps Market Revenue Million Forecast, by Country 2020 & 2033
- Table 12: Global Pumps Market Volume K Unit Forecast, by Country 2020 & 2033
- Table 13: United States Pumps Market Revenue (Million) Forecast, by Application 2020 & 2033
- Table 14: United States Pumps Market Volume (K Unit) Forecast, by Application 2020 & 2033
- Table 15: Canada Pumps Market Revenue (Million) Forecast, by Application 2020 & 2033
- Table 16: Canada Pumps Market Volume (K Unit) Forecast, by Application 2020 & 2033
- Table 17: Rest of North America Pumps Market Revenue (Million) Forecast, by Application 2020 & 2033
- Table 18: Rest of North America Pumps Market Volume (K Unit) Forecast, by Application 2020 & 2033
- Table 19: Global Pumps Market Revenue Million Forecast, by Type 2020 & 2033
- Table 20: Global Pumps Market Volume K Unit Forecast, by Type 2020 & 2033
- Table 21: Global Pumps Market Revenue Million Forecast, by End User 2020 & 2033
- Table 22: Global Pumps Market Volume K Unit Forecast, by End User 2020 & 2033
- Table 23: Global Pumps Market Revenue Million Forecast, by Country 2020 & 2033
- Table 24: Global Pumps Market Volume K Unit Forecast, by Country 2020 & 2033
- Table 25: Germany Pumps Market Revenue (Million) Forecast, by Application 2020 & 2033
- Table 26: Germany Pumps Market Volume (K Unit) Forecast, by Application 2020 & 2033
- Table 27: France Pumps Market Revenue (Million) Forecast, by Application 2020 & 2033
- Table 28: France Pumps Market Volume (K Unit) Forecast, by Application 2020 & 2033
- Table 29: Spain Pumps Market Revenue (Million) Forecast, by Application 2020 & 2033
- Table 30: Spain Pumps Market Volume (K Unit) Forecast, by Application 2020 & 2033
- Table 31: United Kingdom Pumps Market Revenue (Million) Forecast, by Application 2020 & 2033
- Table 32: United Kingdom Pumps Market Volume (K Unit) Forecast, by Application 2020 & 2033
- Table 33: Russia Pumps Market Revenue (Million) Forecast, by Application 2020 & 2033
- Table 34: Russia Pumps Market Volume (K Unit) Forecast, by Application 2020 & 2033
- Table 35: NORDIC Pumps Market Revenue (Million) Forecast, by Application 2020 & 2033
- Table 36: NORDIC Pumps Market Volume (K Unit) Forecast, by Application 2020 & 2033
- Table 37: Italy Pumps Market Revenue (Million) Forecast, by Application 2020 & 2033
- Table 38: Italy Pumps Market Volume (K Unit) Forecast, by Application 2020 & 2033
- Table 39: Turkey Pumps Market Revenue (Million) Forecast, by Application 2020 & 2033
- Table 40: Turkey Pumps Market Volume (K Unit) Forecast, by Application 2020 & 2033
- Table 41: Rest of Europe Pumps Market Revenue (Million) Forecast, by Application 2020 & 2033
- Table 42: Rest of Europe Pumps Market Volume (K Unit) Forecast, by Application 2020 & 2033
- Table 43: Global Pumps Market Revenue Million Forecast, by Type 2020 & 2033
- Table 44: Global Pumps Market Volume K Unit Forecast, by Type 2020 & 2033
- Table 45: Global Pumps Market Revenue Million Forecast, by End User 2020 & 2033
- Table 46: Global Pumps Market Volume K Unit Forecast, by End User 2020 & 2033
- Table 47: Global Pumps Market Revenue Million Forecast, by Country 2020 & 2033
- Table 48: Global Pumps Market Volume K Unit Forecast, by Country 2020 & 2033
- Table 49: China Pumps Market Revenue (Million) Forecast, by Application 2020 & 2033
- Table 50: China Pumps Market Volume (K Unit) Forecast, by Application 2020 & 2033
- Table 51: India Pumps Market Revenue (Million) Forecast, by Application 2020 & 2033
- Table 52: India Pumps Market Volume (K Unit) Forecast, by Application 2020 & 2033
- Table 53: Japan Pumps Market Revenue (Million) Forecast, by Application 2020 & 2033
- Table 54: Japan Pumps Market Volume (K Unit) Forecast, by Application 2020 & 2033
- Table 55: South Korea Pumps Market Revenue (Million) Forecast, by Application 2020 & 2033
- Table 56: South Korea Pumps Market Volume (K Unit) Forecast, by Application 2020 & 2033
- Table 57: Australia Pumps Market Revenue (Million) Forecast, by Application 2020 & 2033
- Table 58: Australia Pumps Market Volume (K Unit) Forecast, by Application 2020 & 2033
- Table 59: Malaysia Pumps Market Revenue (Million) Forecast, by Application 2020 & 2033
- Table 60: Malaysia Pumps Market Volume (K Unit) Forecast, by Application 2020 & 2033
- Table 61: Thailand Pumps Market Revenue (Million) Forecast, by Application 2020 & 2033
- Table 62: Thailand Pumps Market Volume (K Unit) Forecast, by Application 2020 & 2033
- Table 63: Indonesia Pumps Market Revenue (Million) Forecast, by Application 2020 & 2033
- Table 64: Indonesia Pumps Market Volume (K Unit) Forecast, by Application 2020 & 2033
- Table 65: Vietnam Pumps Market Revenue (Million) Forecast, by Application 2020 & 2033
- Table 66: Vietnam Pumps Market Volume (K Unit) Forecast, by Application 2020 & 2033
- Table 67: Rest of Asia Pacific Pumps Market Revenue (Million) Forecast, by Application 2020 & 2033
- Table 68: Rest of Asia Pacific Pumps Market Volume (K Unit) Forecast, by Application 2020 & 2033
- Table 69: Global Pumps Market Revenue Million Forecast, by Type 2020 & 2033
- Table 70: Global Pumps Market Volume K Unit Forecast, by Type 2020 & 2033
- Table 71: Global Pumps Market Revenue Million Forecast, by End User 2020 & 2033
- Table 72: Global Pumps Market Volume K Unit Forecast, by End User 2020 & 2033
- Table 73: Global Pumps Market Revenue Million Forecast, by Country 2020 & 2033
- Table 74: Global Pumps Market Volume K Unit Forecast, by Country 2020 & 2033
- Table 75: Brazil Pumps Market Revenue (Million) Forecast, by Application 2020 & 2033
- Table 76: Brazil Pumps Market Volume (K Unit) Forecast, by Application 2020 & 2033
- Table 77: Argentina Pumps Market Revenue (Million) Forecast, by Application 2020 & 2033
- Table 78: Argentina Pumps Market Volume (K Unit) Forecast, by Application 2020 & 2033
- Table 79: Colombia Pumps Market Revenue (Million) Forecast, by Application 2020 & 2033
- Table 80: Colombia Pumps Market Volume (K Unit) Forecast, by Application 2020 & 2033
- Table 81: Rest of South America Pumps Market Revenue (Million) Forecast, by Application 2020 & 2033
- Table 82: Rest of South America Pumps Market Volume (K Unit) Forecast, by Application 2020 & 2033
- Table 83: Global Pumps Market Revenue Million Forecast, by Type 2020 & 2033
- Table 84: Global Pumps Market Volume K Unit Forecast, by Type 2020 & 2033
- Table 85: Global Pumps Market Revenue Million Forecast, by End User 2020 & 2033
- Table 86: Global Pumps Market Volume K Unit Forecast, by End User 2020 & 2033
- Table 87: Global Pumps Market Revenue Million Forecast, by Country 2020 & 2033
- Table 88: Global Pumps Market Volume K Unit Forecast, by Country 2020 & 2033
- Table 89: Saudi Arabia Pumps Market Revenue (Million) Forecast, by Application 2020 & 2033
- Table 90: Saudi Arabia Pumps Market Volume (K Unit) Forecast, by Application 2020 & 2033
- Table 91: United Arab Emirates Pumps Market Revenue (Million) Forecast, by Application 2020 & 2033
- Table 92: United Arab Emirates Pumps Market Volume (K Unit) Forecast, by Application 2020 & 2033
- Table 93: South Africa Pumps Market Revenue (Million) Forecast, by Application 2020 & 2033
- Table 94: South Africa Pumps Market Volume (K Unit) Forecast, by Application 2020 & 2033
- Table 95: Nigeria Pumps Market Revenue (Million) Forecast, by Application 2020 & 2033
- Table 96: Nigeria Pumps Market Volume (K Unit) Forecast, by Application 2020 & 2033
- Table 97: Qatar Pumps Market Revenue (Million) Forecast, by Application 2020 & 2033
- Table 98: Qatar Pumps Market Volume (K Unit) Forecast, by Application 2020 & 2033
- Table 99: Egypt Pumps Market Revenue (Million) Forecast, by Application 2020 & 2033
- Table 100: Egypt Pumps Market Volume (K Unit) Forecast, by Application 2020 & 2033
- Table 101: Rest of the Middle East and Africa Pumps Market Revenue (Million) Forecast, by Application 2020 & 2033
- Table 102: Rest of the Middle East and Africa Pumps Market Volume (K Unit) Forecast, by Application 2020 & 2033
Frequently Asked Questions
1. What is the projected Compound Annual Growth Rate (CAGR) of the Pumps Market?
The projected CAGR is approximately 3.60%.
2. Which companies are prominent players in the Pumps Market?
Key companies in the market include Sulzer Ltd, Ebara Corporation, Flowserve Corporation, Weir Group PLC, Dover Corporation*List Not Exhaustive 6 4 Market Ranking/Share (%) Analysi, Clyde Union Inc, Schlumberger Ltd, KSB SE & Co KGaA, ITT Inc, Grundfos Holding AS, Baker Hughes Company.
3. What are the main segments of the Pumps Market?
The market segments include Type, End User.
4. Can you provide details about the market size?
The market size is estimated to be USD 110.22 Million as of 2022.
5. What are some drivers contributing to market growth?
Increasing Infrastructure Development4.; Rising Emphasis Water and Wastewater Management.
6. What are the notable trends driving market growth?
Oil and Gas Sector Expected to Witness Significant Growth.
7. Are there any restraints impacting market growth?
Volatility in Raw Material Prices.
8. Can you provide examples of recent developments in the market?
December 2023: The Packo Pumps website merged with the Verder Liquids website. The collaboration aims to reinforce the relationship between Verder and Packo and provide customers with a broader range of pump technologies.
9. What pricing options are available for accessing the report?
Pricing options include single-user, multi-user, and enterprise licenses priced at USD 4750, USD 5250, and USD 8750 respectively.
10. Is the market size provided in terms of value or volume?
The market size is provided in terms of value, measured in Million and volume, measured in K Unit.
11. Are there any specific market keywords associated with the report?
Yes, the market keyword associated with the report is "Pumps Market," which aids in identifying and referencing the specific market segment covered.
12. How do I determine which pricing option suits my needs best?
The pricing options vary based on user requirements and access needs. Individual users may opt for single-user licenses, while businesses requiring broader access may choose multi-user or enterprise licenses for cost-effective access to the report.
13. Are there any additional resources or data provided in the Pumps Market report?
While the report offers comprehensive insights, it's advisable to review the specific contents or supplementary materials provided to ascertain if additional resources or data are available.
14. How can I stay updated on further developments or reports in the Pumps Market?
To stay informed about further developments, trends, and reports in the Pumps Market, consider subscribing to industry newsletters, following relevant companies and organizations, or regularly checking reputable industry news sources and publications.
Methodology
Step 1 - Identification of Relevant Samples Size from Population Database


Step 2 - Approaches for Defining Global Market Size (Value, Volume* & Price*)

Note*: In applicable scenarios
Step 3 - Data Sources
Primary Research
- Web Analytics
- Survey Reports
- Research Institute
- Latest Research Reports
- Opinion Leaders
Secondary Research
- Annual Reports
- White Paper
- Latest Press Release
- Industry Association
- Paid Database
- Investor Presentations

Step 4 - Data Triangulation
Involves using different sources of information in order to increase the validity of a study
These sources are likely to be stakeholders in a program - participants, other researchers, program staff, other community members, and so on.
Then we put all data in single framework & apply various statistical tools to find out the dynamic on the market.
During the analysis stage, feedback from the stakeholder groups would be compared to determine areas of agreement as well as areas of divergence