

Key Insights
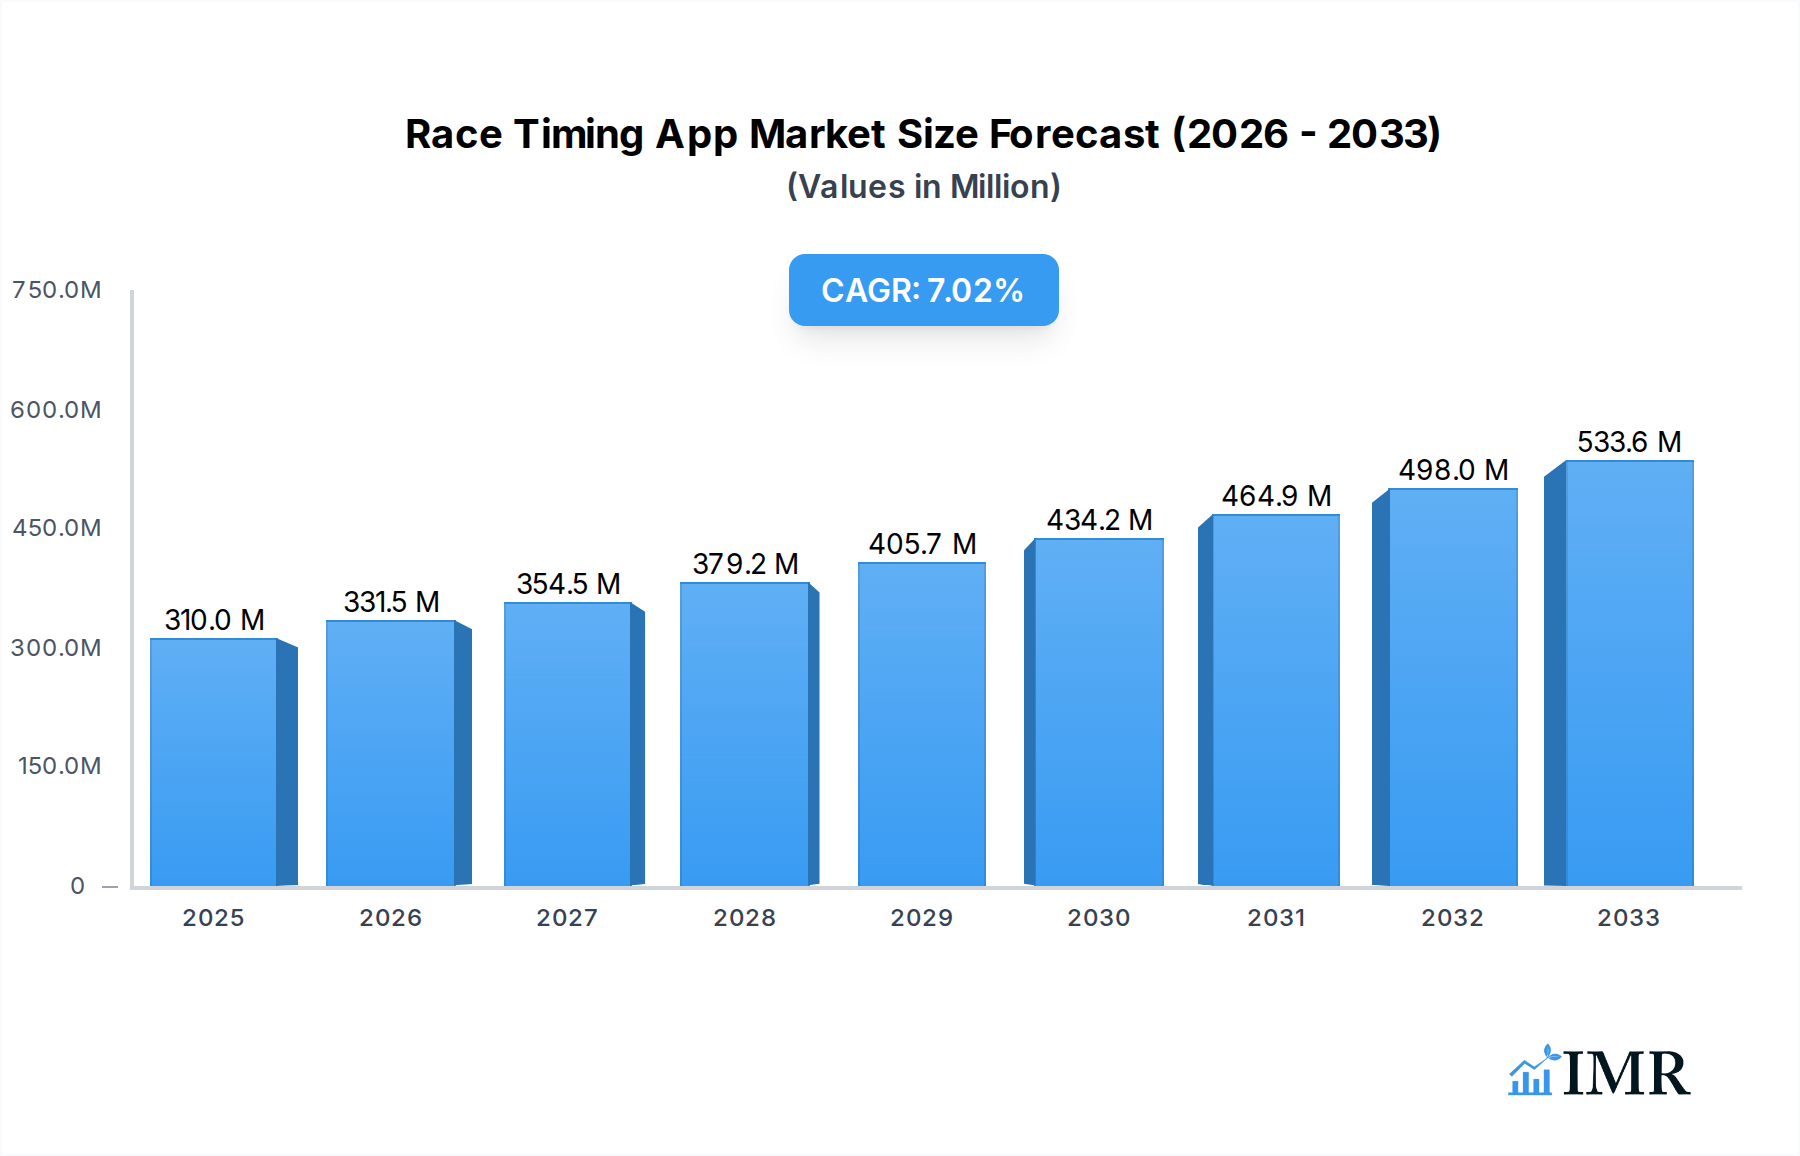
The global Race Timing App market is poised for significant expansion, with a market size of USD 310 million in 2025, projected to grow at a robust CAGR of 6.9% throughout the forecast period of 2025-2033. This upward trajectory is primarily fueled by the increasing adoption of digital solutions in sports events of all scales, from professional competitions to amateur marathons and cycling races. The growing popularity of health and fitness activities worldwide, coupled with advancements in smartphone technology and wearable devices that facilitate seamless data integration, are key drivers. Furthermore, the demand for efficient and accurate timing solutions for a wide array of applications, including track and field, racing cars, swimming, biking, and other niche sports, is intensifying. The ability of these apps to provide real-time results, detailed analytics, and enhanced participant engagement is a critical factor in their widespread adoption. The market also benefits from the increasing organization of community-based and virtual racing events, which require sophisticated yet accessible timing and management tools.

Race Timing App Market Size (In Million)
The market is characterized by a dynamic competitive landscape with numerous established and emerging players, including RaceSplitter, Webscorer, RaceID, and RunSignup, all vying for market share. Innovations in app features, such as GPS tracking accuracy improvements, AI-powered performance analysis, and seamless integration with ticketing and event management platforms, are continuously shaping the market. Emerging trends like the integration of augmented reality for enhanced spectator experiences and the development of specialized apps for e-sports are also contributing to market evolution. While the market presents considerable growth opportunities, potential restraints such as data privacy concerns and the initial investment required for advanced features could pose challenges. However, the overall outlook remains highly positive, driven by the persistent global enthusiasm for organized sports and the continuous technological advancements that enhance the user experience and operational efficiency of race timing applications.
Race Timing App Company Market Share
Race Timing App Market Dynamics & Structure
The global race timing app market is experiencing dynamic shifts, characterized by moderate concentration with key players like RunSignup, Race Roster, and RaceID commanding significant portions of the $1.2 billion market in 2025. Technological innovation is the primary driver, with advancements in GPS accuracy, real-time data synchronization, and wearable device integration fueling adoption. The regulatory landscape, while generally permissive, focuses on data privacy and fair competition, influencing app development and market entry. Competitive product substitutes, including manual timing systems and dedicated hardware solutions, are steadily losing ground to the convenience and cost-effectiveness of mobile applications, particularly in the $700 million track and field segment. End-user demographics are diverse, encompassing professional athletes, amateur enthusiasts, and event organizers, with a growing segment of casual participants seeking seamless tracking for personal fitness goals. Mergers and acquisitions (M&A) are moderately active, with smaller innovative startups being acquired by established players to bolster their feature sets and expand their user base. For instance, the acquisition of RaceTec by a larger entity in 2023 for an undisclosed sum indicates a trend towards consolidation. Barriers to innovation include the high cost of sophisticated algorithm development and the need for continuous updates to accommodate evolving operating systems and device hardware.
- Market Concentration: Moderate, with top 5 players holding an estimated 60% of the market share.
- Technological Innovation Drivers: Enhanced GPS accuracy, real-time data, wearable integration, AI-powered analytics.
- Regulatory Frameworks: Data privacy (GDPR, CCPA), fair competition guidelines.
- Competitive Product Substitutes: Manual timing, dedicated hardware, basic stopwatch apps.
- End-User Demographics: Professional athletes, amateur sports enthusiasts, event organizers, fitness trackers.
- M&A Trends: Moderate activity, acquisition of niche technology providers by larger platforms.
Race Timing App Growth Trends & Insights
The race timing app market is projected to witness robust growth, expanding from an estimated $1.2 billion in 2025 to a projected $3.5 billion by 2033, reflecting a Compound Annual Growth Rate (CAGR) of approximately 14.2%. This impressive expansion is driven by a confluence of factors, including escalating participation in amateur sports, increased adoption of smartphones and wearable devices globally, and the persistent demand for efficient and accessible event management solutions. The adoption rates for race timing apps are soaring across all segments, particularly within the $800 million cycling and running communities. Technological disruptions, such as the integration of artificial intelligence for performance analysis and predictive insights, alongside advancements in biometric data capture, are further propelling market penetration. Consumer behavior is shifting significantly, with participants increasingly expecting seamless digital experiences for registration, participation, and post-event performance review. Event organizers are prioritizing digital solutions to streamline operations, reduce costs, and enhance participant engagement, leading to a surge in demand for comprehensive timing and management platforms. The increasing accessibility of affordable smartphones across developing economies is also a significant catalyst, opening up new avenues for market expansion. Furthermore, the growing trend of virtual and hybrid racing events, which gained traction during the pandemic, continues to fuel the need for sophisticated digital timing and tracking capabilities. The perceived value proposition of these apps, offering instant results, personalized feedback, and social sharing features, resonates strongly with the modern sports enthusiast. The market penetration for dedicated race timing apps is estimated to reach 55% by 2025, with a projected increase to 75% by 2033. The average revenue per user (ARPU) is expected to grow by 8% annually due to the introduction of premium features and subscription models.
Dominant Regions, Countries, or Segments in Race Timing App
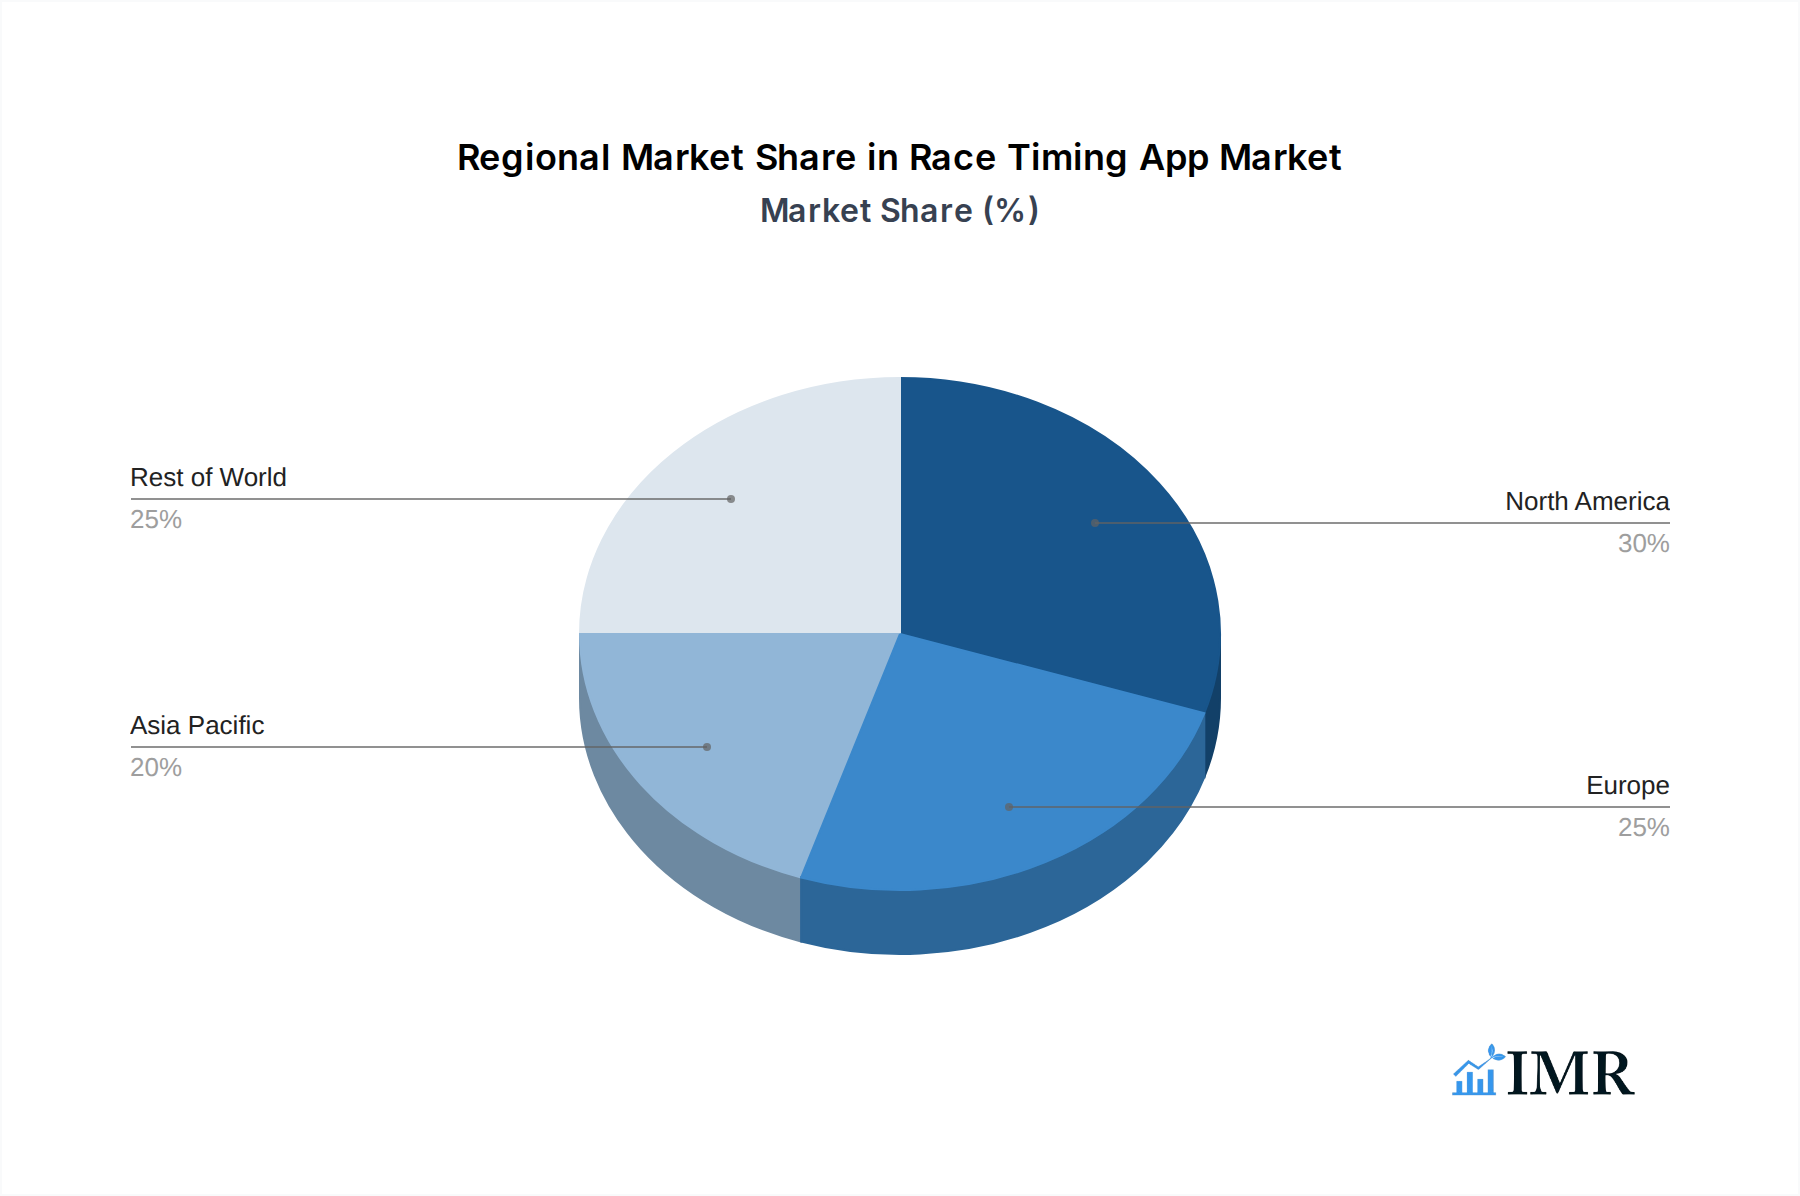
The North America region currently stands as the dominant force in the global race timing app market, projected to account for an estimated 35% of the market share in 2025, valued at approximately $420 million. This dominance is attributed to several key factors, including a well-established culture of participation in various sporting events, high smartphone and wearable device penetration, and a strong economy that supports investment in sports technology. The United States, in particular, is a significant contributor, driven by the sheer volume of organized running, cycling, and track and field events held annually. The presence of leading market players like RunSignup and Race Roster, headquartered in North America, further solidifies its leadership position. Economic policies that encourage sports participation and technological innovation, coupled with robust digital infrastructure, create an environment conducive to the growth of race timing applications.
Within the Application segments, Track and Field leads the market, representing an estimated 30% of the total market value, projected at $360 million in 2025. This segment's prominence is due to the highly structured nature of track and field competitions, which inherently require precise timing for multiple events and athletes simultaneously. The accessibility and affordability of participating in track and field events, from school-level competitions to professional meets, also contribute to its widespread appeal and reliance on timing solutions.
In terms of Types, Android applications currently hold a slight edge, with an estimated 55% market share, valued at $660 million in 2025. This is largely due to the global prevalence of Android devices, especially in emerging markets where smartphone adoption is rapidly expanding. However, iOS applications are experiencing substantial growth, driven by the strong user base in developed economies and the platform's reputation for robust performance and security, projected to capture 45% of the market by 2025, valued at $540 million. The ongoing development of cross-platform compatibility and increasing hardware capabilities across both operating systems are expected to further drive adoption and reduce the disparity in market share over the forecast period.
- Dominant Region: North America ($420 million in 2025)
- Key Drivers: High sports participation, advanced technological infrastructure, strong economic support for sports events.
- Leading Country: United States.
- Dominant Application Segment: Track and Field ($360 million in 2025)
- Key Drivers: Need for precise multi-athlete timing, structured competition formats, widespread participation.
- Dominant Type: Android (55% market share, $660 million in 2025)
- Key Drivers: Global device penetration, affordability in emerging markets.
Race Timing App Product Landscape
The race timing app product landscape is characterized by a rapid evolution of features and functionalities, designed to cater to a diverse range of sporting events. Innovations center around enhanced accuracy through multi-GNSS positioning, real-time data streaming for live leaderboards, and seamless integration with wearable devices like smartwatches for effortless participant tracking. Advanced analytics dashboards provide organizers with detailed event metrics and participants with personalized performance insights, including pace analysis, split times, and route mapping. Unique selling propositions include AI-powered performance prediction, virtual event capabilities, and robust integration with ticketing and registration platforms. Technological advancements are also focusing on offline mode functionality for areas with poor connectivity, long battery life optimization, and user-friendly interfaces for both novice and experienced users.
Key Drivers, Barriers & Challenges in Race Timing App
Key Drivers: The race timing app industry is propelled by escalating global participation in amateur sports and fitness activities, a surge in smartphone and wearable device penetration, and the growing demand for efficient event management solutions. Technological advancements, such as improved GPS accuracy and real-time data analytics, are further accelerating adoption. The increasing trend towards virtual and hybrid events also presents a significant growth avenue.
Barriers & Challenges: High development costs for sophisticated algorithms and continuous software updates pose a significant barrier. Ensuring robust data security and privacy compliance is critical but can be complex. Intense competition from established players and new entrants leads to price pressures, impacting profitability. Supply chain issues affecting hardware components for integrated solutions, though less prevalent for purely app-based solutions, can still be a minor concern for bundled offerings. Regulatory hurdles related to data ownership and usage in different jurisdictions add another layer of complexity. The challenge of maintaining seamless performance across a vast array of devices and operating system versions also requires constant attention.
Emerging Opportunities in Race Timing App
Emerging opportunities in the race timing app sector lie in the untapped potential of niche sports segments, such as obstacle course racing and adventure sports, which require specialized timing and tracking features. The integration of augmented reality (AR) for enhanced spectator experiences and real-time performance overlays presents a novel application. Furthermore, the growing demand for personalized coaching and training programs fueled by race data offers significant expansion potential. Developing robust solutions for accessibility, catering to athletes with disabilities, also represents a socially responsible and market-expanding opportunity. The growing elderly population seeking active lifestyles also presents an untapped market for simplified, user-friendly timing apps.
Growth Accelerators in the Race Timing App Industry
Long-term growth in the race timing app industry is being accelerated by transformative technological breakthroughs, including the widespread adoption of 5G networks enabling ultra-low latency for real-time data transmission, and the increasing sophistication of AI for predictive analytics and personalized training recommendations. Strategic partnerships between app developers and wearable technology manufacturers are creating seamless, integrated ecosystems. Market expansion strategies targeting underserved geographic regions and developing economies, coupled with the introduction of freemium models and tiered subscription services, are driving broader market penetration and revenue growth. The increasing focus on data-driven insights for both athletes and organizers is also a significant growth catalyst.
Key Players Shaping the Race Timing App Market
- RaceSplitter
- Webscorer
- RaceID
- RaceClocker
- RaceTime
- Sports Timing Solutions
- RaceGorilla
- Timing.Mobi
- Orgsu
- RunnerCard
- XCMeet
- race result
- Sailrace
- Wiclax
- RaceChrono
- FinishTime
- RaceTec
- Xtreme Action Park
- RunSignup
- Race Roster
- Crossbox
- SmartRace
- RTRT.me
- RUFUS
- Timing Solutions
Notable Milestones in Race Timing App Sector
- 2019: Launch of advanced AI-powered performance analysis features by RaceID, significantly enhancing user engagement.
- 2020: Widespread adoption of virtual race functionalities across multiple platforms like RunSignup and Race Roster due to global pandemic restrictions.
- 2021: Introduction of enhanced cross-platform compatibility for RaceSplitter, broadening its user base across iOS and Android.
- 2022: Significant investment in real-time data streaming technology by Webscorer, improving live leaderboard accuracy for large events.
- 2023: Acquisition of RaceTec by a major sports technology firm, signaling consolidation trends in the market.
- 2024: Release of enhanced wearable device integration by RaceGorilla, supporting a wider range of smartwatches and fitness trackers.
In-Depth Race Timing App Market Outlook
The race timing app market is poised for sustained growth, driven by continuous technological innovation and an ever-expanding global sports participation landscape. Key growth accelerators include the maturation of 5G technology, facilitating near-instantaneous data transfer, and the sophisticated application of AI for hyper-personalized athlete insights and event optimization. Strategic collaborations between app developers, hardware manufacturers, and sports federations will foster greater interoperability and create more comprehensive solutions. Focus on emerging markets and the development of accessible, user-friendly interfaces will unlock significant untapped potential. The increasing demand for data-driven decision-making across all levels of sport, from amateur enthusiasts to professional organizers, positions race timing apps as indispensable tools for the future of athletic performance and event management.
Race Timing App Segmentation
-
1. Application
- 1.1. Track and Field
- 1.2. Racing Car
- 1.3. Swim
- 1.4. Bike
- 1.5. Other
-
2. Types
- 2.1. iOS
- 2.2. Android
Race Timing App Segmentation By Geography
-
1. North America
- 1.1. United States
- 1.2. Canada
- 1.3. Mexico
-
2. South America
- 2.1. Brazil
- 2.2. Argentina
- 2.3. Rest of South America
-
3. Europe
- 3.1. United Kingdom
- 3.2. Germany
- 3.3. France
- 3.4. Italy
- 3.5. Spain
- 3.6. Russia
- 3.7. Benelux
- 3.8. Nordics
- 3.9. Rest of Europe
-
4. Middle East & Africa
- 4.1. Turkey
- 4.2. Israel
- 4.3. GCC
- 4.4. North Africa
- 4.5. South Africa
- 4.6. Rest of Middle East & Africa
-
5. Asia Pacific
- 5.1. China
- 5.2. India
- 5.3. Japan
- 5.4. South Korea
- 5.5. ASEAN
- 5.6. Oceania
- 5.7. Rest of Asia Pacific
Race Timing App Regional Market Share
Geographic Coverage of Race Timing App
Race Timing App REPORT HIGHLIGHTS
| Aspects | Details |
|---|---|
| Study Period | 2020-2034 |
| Base Year | 2025 |
| Estimated Year | 2026 |
| Forecast Period | 2026-2034 |
| Historical Period | 2020-2025 |
| Growth Rate | CAGR of 6.9% from 2020-2034 |
| Segmentation |
|
Table of Contents
- 1. Introduction
- 1.1. Research Scope
- 1.2. Market Segmentation
- 1.3. Research Objective
- 1.4. Definitions and Assumptions
- 2. Executive Summary
- 2.1. Market Snapshot
- 3. Market Dynamics
- 3.1. Market Drivers
- 3.2. Market Restrains
- 3.3. Market Trends
- 3.4. Market Opportunities
- 4. Market Factor Analysis
- 4.1. Porters Five Forces
- 4.1.1. Bargaining Power of Suppliers
- 4.1.2. Bargaining Power of Buyers
- 4.1.3. Threat of New Entrants
- 4.1.4. Threat of Substitutes
- 4.1.5. Competitive Rivalry
- 4.2. PESTEL analysis
- 4.3. BCG Analysis
- 4.3.1. Stars (High Growth, High Market Share)
- 4.3.2. Cash Cows (Low Growth, High Market Share)
- 4.3.3. Question Mark (High Growth, Low Market Share)
- 4.3.4. Dogs (Low Growth, Low Market Share)
- 4.4. Ansoff Matrix Analysis
- 4.5. Supply Chain Analysis
- 4.6. Regulatory Landscape
- 4.7. Current Market Potential and Opportunity Assessment (TAM–SAM–SOM Framework)
- 4.8. IMR Analyst Note
- 4.1. Porters Five Forces
- 5. Market Analysis, Insights and Forecast 2021-2033
- 5.1. Market Analysis, Insights and Forecast - by Application
- 5.1.1. Track and Field
- 5.1.2. Racing Car
- 5.1.3. Swim
- 5.1.4. Bike
- 5.1.5. Other
- 5.2. Market Analysis, Insights and Forecast - by Types
- 5.2.1. iOS
- 5.2.2. Android
- 5.3. Market Analysis, Insights and Forecast - by Region
- 5.3.1. North America
- 5.3.2. South America
- 5.3.3. Europe
- 5.3.4. Middle East & Africa
- 5.3.5. Asia Pacific
- 5.1. Market Analysis, Insights and Forecast - by Application
- 6. Global Race Timing App Analysis, Insights and Forecast, 2021-2033
- 6.1. Market Analysis, Insights and Forecast - by Application
- 6.1.1. Track and Field
- 6.1.2. Racing Car
- 6.1.3. Swim
- 6.1.4. Bike
- 6.1.5. Other
- 6.2. Market Analysis, Insights and Forecast - by Types
- 6.2.1. iOS
- 6.2.2. Android
- 6.1. Market Analysis, Insights and Forecast - by Application
- 7. North America Race Timing App Analysis, Insights and Forecast, 2020-2032
- 7.1. Market Analysis, Insights and Forecast - by Application
- 7.1.1. Track and Field
- 7.1.2. Racing Car
- 7.1.3. Swim
- 7.1.4. Bike
- 7.1.5. Other
- 7.2. Market Analysis, Insights and Forecast - by Types
- 7.2.1. iOS
- 7.2.2. Android
- 7.1. Market Analysis, Insights and Forecast - by Application
- 8. South America Race Timing App Analysis, Insights and Forecast, 2020-2032
- 8.1. Market Analysis, Insights and Forecast - by Application
- 8.1.1. Track and Field
- 8.1.2. Racing Car
- 8.1.3. Swim
- 8.1.4. Bike
- 8.1.5. Other
- 8.2. Market Analysis, Insights and Forecast - by Types
- 8.2.1. iOS
- 8.2.2. Android
- 8.1. Market Analysis, Insights and Forecast - by Application
- 9. Europe Race Timing App Analysis, Insights and Forecast, 2020-2032
- 9.1. Market Analysis, Insights and Forecast - by Application
- 9.1.1. Track and Field
- 9.1.2. Racing Car
- 9.1.3. Swim
- 9.1.4. Bike
- 9.1.5. Other
- 9.2. Market Analysis, Insights and Forecast - by Types
- 9.2.1. iOS
- 9.2.2. Android
- 9.1. Market Analysis, Insights and Forecast - by Application
- 10. Middle East & Africa Race Timing App Analysis, Insights and Forecast, 2020-2032
- 10.1. Market Analysis, Insights and Forecast - by Application
- 10.1.1. Track and Field
- 10.1.2. Racing Car
- 10.1.3. Swim
- 10.1.4. Bike
- 10.1.5. Other
- 10.2. Market Analysis, Insights and Forecast - by Types
- 10.2.1. iOS
- 10.2.2. Android
- 10.1. Market Analysis, Insights and Forecast - by Application
- 11. Asia Pacific Race Timing App Analysis, Insights and Forecast, 2020-2032
- 11.1. Market Analysis, Insights and Forecast - by Application
- 11.1.1. Track and Field
- 11.1.2. Racing Car
- 11.1.3. Swim
- 11.1.4. Bike
- 11.1.5. Other
- 11.2. Market Analysis, Insights and Forecast - by Types
- 11.2.1. iOS
- 11.2.2. Android
- 11.1. Market Analysis, Insights and Forecast - by Application
- 12. Competitive Analysis
- 12.1. Company Profiles
- 12.1.1 RaceSplitter
- 12.1.1.1. Company Overview
- 12.1.1.2. Products
- 12.1.1.3. Company Financials
- 12.1.1.4. SWOT Analysis
- 12.1.2 Webscorer
- 12.1.2.1. Company Overview
- 12.1.2.2. Products
- 12.1.2.3. Company Financials
- 12.1.2.4. SWOT Analysis
- 12.1.3 RaceID
- 12.1.3.1. Company Overview
- 12.1.3.2. Products
- 12.1.3.3. Company Financials
- 12.1.3.4. SWOT Analysis
- 12.1.4 RaceClocker
- 12.1.4.1. Company Overview
- 12.1.4.2. Products
- 12.1.4.3. Company Financials
- 12.1.4.4. SWOT Analysis
- 12.1.5 RaceTime
- 12.1.5.1. Company Overview
- 12.1.5.2. Products
- 12.1.5.3. Company Financials
- 12.1.5.4. SWOT Analysis
- 12.1.6 Sports Timing Solutions
- 12.1.6.1. Company Overview
- 12.1.6.2. Products
- 12.1.6.3. Company Financials
- 12.1.6.4. SWOT Analysis
- 12.1.7 RaceGorilla
- 12.1.7.1. Company Overview
- 12.1.7.2. Products
- 12.1.7.3. Company Financials
- 12.1.7.4. SWOT Analysis
- 12.1.8 Timing . Mobi
- 12.1.8.1. Company Overview
- 12.1.8.2. Products
- 12.1.8.3. Company Financials
- 12.1.8.4. SWOT Analysis
- 12.1.9 Orgsu
- 12.1.9.1. Company Overview
- 12.1.9.2. Products
- 12.1.9.3. Company Financials
- 12.1.9.4. SWOT Analysis
- 12.1.10 RunnerCard
- 12.1.10.1. Company Overview
- 12.1.10.2. Products
- 12.1.10.3. Company Financials
- 12.1.10.4. SWOT Analysis
- 12.1.11 XCMeet
- 12.1.11.1. Company Overview
- 12.1.11.2. Products
- 12.1.11.3. Company Financials
- 12.1.11.4. SWOT Analysis
- 12.1.12 race result
- 12.1.12.1. Company Overview
- 12.1.12.2. Products
- 12.1.12.3. Company Financials
- 12.1.12.4. SWOT Analysis
- 12.1.13 Sailrace
- 12.1.13.1. Company Overview
- 12.1.13.2. Products
- 12.1.13.3. Company Financials
- 12.1.13.4. SWOT Analysis
- 12.1.14 Wiclax
- 12.1.14.1. Company Overview
- 12.1.14.2. Products
- 12.1.14.3. Company Financials
- 12.1.14.4. SWOT Analysis
- 12.1.15 RaceChrono
- 12.1.15.1. Company Overview
- 12.1.15.2. Products
- 12.1.15.3. Company Financials
- 12.1.15.4. SWOT Analysis
- 12.1.16 FinishTime
- 12.1.16.1. Company Overview
- 12.1.16.2. Products
- 12.1.16.3. Company Financials
- 12.1.16.4. SWOT Analysis
- 12.1.17 RaceTec
- 12.1.17.1. Company Overview
- 12.1.17.2. Products
- 12.1.17.3. Company Financials
- 12.1.17.4. SWOT Analysis
- 12.1.18 Xtreme Action Park
- 12.1.18.1. Company Overview
- 12.1.18.2. Products
- 12.1.18.3. Company Financials
- 12.1.18.4. SWOT Analysis
- 12.1.19 RunSignup
- 12.1.19.1. Company Overview
- 12.1.19.2. Products
- 12.1.19.3. Company Financials
- 12.1.19.4. SWOT Analysis
- 12.1.20 Race Roster
- 12.1.20.1. Company Overview
- 12.1.20.2. Products
- 12.1.20.3. Company Financials
- 12.1.20.4. SWOT Analysis
- 12.1.21 Crossbox
- 12.1.21.1. Company Overview
- 12.1.21.2. Products
- 12.1.21.3. Company Financials
- 12.1.21.4. SWOT Analysis
- 12.1.22 SmartRace
- 12.1.22.1. Company Overview
- 12.1.22.2. Products
- 12.1.22.3. Company Financials
- 12.1.22.4. SWOT Analysis
- 12.1.23 RTRT.me
- 12.1.23.1. Company Overview
- 12.1.23.2. Products
- 12.1.23.3. Company Financials
- 12.1.23.4. SWOT Analysis
- 12.1.24 RUFUS
- 12.1.24.1. Company Overview
- 12.1.24.2. Products
- 12.1.24.3. Company Financials
- 12.1.24.4. SWOT Analysis
- 12.1.25 Timing Solutions
- 12.1.25.1. Company Overview
- 12.1.25.2. Products
- 12.1.25.3. Company Financials
- 12.1.25.4. SWOT Analysis
- 12.1.1 RaceSplitter
- 12.2. Market Entropy
- 12.2.1 Company's Key Areas Served
- 12.2.2 Recent Developments
- 12.3. Company Market Share Analysis 2025
- 12.3.1 Top 5 Companies Market Share Analysis
- 12.3.2 Top 3 Companies Market Share Analysis
- 12.4. List of Potential Customers
- 13. Research Methodology
List of Figures
- Figure 1: Global Race Timing App Revenue Breakdown (million, %) by Region 2025 & 2033
- Figure 2: North America Race Timing App Revenue (million), by Application 2025 & 2033
- Figure 3: North America Race Timing App Revenue Share (%), by Application 2025 & 2033
- Figure 4: North America Race Timing App Revenue (million), by Types 2025 & 2033
- Figure 5: North America Race Timing App Revenue Share (%), by Types 2025 & 2033
- Figure 6: North America Race Timing App Revenue (million), by Country 2025 & 2033
- Figure 7: North America Race Timing App Revenue Share (%), by Country 2025 & 2033
- Figure 8: South America Race Timing App Revenue (million), by Application 2025 & 2033
- Figure 9: South America Race Timing App Revenue Share (%), by Application 2025 & 2033
- Figure 10: South America Race Timing App Revenue (million), by Types 2025 & 2033
- Figure 11: South America Race Timing App Revenue Share (%), by Types 2025 & 2033
- Figure 12: South America Race Timing App Revenue (million), by Country 2025 & 2033
- Figure 13: South America Race Timing App Revenue Share (%), by Country 2025 & 2033
- Figure 14: Europe Race Timing App Revenue (million), by Application 2025 & 2033
- Figure 15: Europe Race Timing App Revenue Share (%), by Application 2025 & 2033
- Figure 16: Europe Race Timing App Revenue (million), by Types 2025 & 2033
- Figure 17: Europe Race Timing App Revenue Share (%), by Types 2025 & 2033
- Figure 18: Europe Race Timing App Revenue (million), by Country 2025 & 2033
- Figure 19: Europe Race Timing App Revenue Share (%), by Country 2025 & 2033
- Figure 20: Middle East & Africa Race Timing App Revenue (million), by Application 2025 & 2033
- Figure 21: Middle East & Africa Race Timing App Revenue Share (%), by Application 2025 & 2033
- Figure 22: Middle East & Africa Race Timing App Revenue (million), by Types 2025 & 2033
- Figure 23: Middle East & Africa Race Timing App Revenue Share (%), by Types 2025 & 2033
- Figure 24: Middle East & Africa Race Timing App Revenue (million), by Country 2025 & 2033
- Figure 25: Middle East & Africa Race Timing App Revenue Share (%), by Country 2025 & 2033
- Figure 26: Asia Pacific Race Timing App Revenue (million), by Application 2025 & 2033
- Figure 27: Asia Pacific Race Timing App Revenue Share (%), by Application 2025 & 2033
- Figure 28: Asia Pacific Race Timing App Revenue (million), by Types 2025 & 2033
- Figure 29: Asia Pacific Race Timing App Revenue Share (%), by Types 2025 & 2033
- Figure 30: Asia Pacific Race Timing App Revenue (million), by Country 2025 & 2033
- Figure 31: Asia Pacific Race Timing App Revenue Share (%), by Country 2025 & 2033
List of Tables
- Table 1: Global Race Timing App Revenue million Forecast, by Application 2020 & 2033
- Table 2: Global Race Timing App Revenue million Forecast, by Types 2020 & 2033
- Table 3: Global Race Timing App Revenue million Forecast, by Region 2020 & 2033
- Table 4: Global Race Timing App Revenue million Forecast, by Application 2020 & 2033
- Table 5: Global Race Timing App Revenue million Forecast, by Types 2020 & 2033
- Table 6: Global Race Timing App Revenue million Forecast, by Country 2020 & 2033
- Table 7: United States Race Timing App Revenue (million) Forecast, by Application 2020 & 2033
- Table 8: Canada Race Timing App Revenue (million) Forecast, by Application 2020 & 2033
- Table 9: Mexico Race Timing App Revenue (million) Forecast, by Application 2020 & 2033
- Table 10: Global Race Timing App Revenue million Forecast, by Application 2020 & 2033
- Table 11: Global Race Timing App Revenue million Forecast, by Types 2020 & 2033
- Table 12: Global Race Timing App Revenue million Forecast, by Country 2020 & 2033
- Table 13: Brazil Race Timing App Revenue (million) Forecast, by Application 2020 & 2033
- Table 14: Argentina Race Timing App Revenue (million) Forecast, by Application 2020 & 2033
- Table 15: Rest of South America Race Timing App Revenue (million) Forecast, by Application 2020 & 2033
- Table 16: Global Race Timing App Revenue million Forecast, by Application 2020 & 2033
- Table 17: Global Race Timing App Revenue million Forecast, by Types 2020 & 2033
- Table 18: Global Race Timing App Revenue million Forecast, by Country 2020 & 2033
- Table 19: United Kingdom Race Timing App Revenue (million) Forecast, by Application 2020 & 2033
- Table 20: Germany Race Timing App Revenue (million) Forecast, by Application 2020 & 2033
- Table 21: France Race Timing App Revenue (million) Forecast, by Application 2020 & 2033
- Table 22: Italy Race Timing App Revenue (million) Forecast, by Application 2020 & 2033
- Table 23: Spain Race Timing App Revenue (million) Forecast, by Application 2020 & 2033
- Table 24: Russia Race Timing App Revenue (million) Forecast, by Application 2020 & 2033
- Table 25: Benelux Race Timing App Revenue (million) Forecast, by Application 2020 & 2033
- Table 26: Nordics Race Timing App Revenue (million) Forecast, by Application 2020 & 2033
- Table 27: Rest of Europe Race Timing App Revenue (million) Forecast, by Application 2020 & 2033
- Table 28: Global Race Timing App Revenue million Forecast, by Application 2020 & 2033
- Table 29: Global Race Timing App Revenue million Forecast, by Types 2020 & 2033
- Table 30: Global Race Timing App Revenue million Forecast, by Country 2020 & 2033
- Table 31: Turkey Race Timing App Revenue (million) Forecast, by Application 2020 & 2033
- Table 32: Israel Race Timing App Revenue (million) Forecast, by Application 2020 & 2033
- Table 33: GCC Race Timing App Revenue (million) Forecast, by Application 2020 & 2033
- Table 34: North Africa Race Timing App Revenue (million) Forecast, by Application 2020 & 2033
- Table 35: South Africa Race Timing App Revenue (million) Forecast, by Application 2020 & 2033
- Table 36: Rest of Middle East & Africa Race Timing App Revenue (million) Forecast, by Application 2020 & 2033
- Table 37: Global Race Timing App Revenue million Forecast, by Application 2020 & 2033
- Table 38: Global Race Timing App Revenue million Forecast, by Types 2020 & 2033
- Table 39: Global Race Timing App Revenue million Forecast, by Country 2020 & 2033
- Table 40: China Race Timing App Revenue (million) Forecast, by Application 2020 & 2033
- Table 41: India Race Timing App Revenue (million) Forecast, by Application 2020 & 2033
- Table 42: Japan Race Timing App Revenue (million) Forecast, by Application 2020 & 2033
- Table 43: South Korea Race Timing App Revenue (million) Forecast, by Application 2020 & 2033
- Table 44: ASEAN Race Timing App Revenue (million) Forecast, by Application 2020 & 2033
- Table 45: Oceania Race Timing App Revenue (million) Forecast, by Application 2020 & 2033
- Table 46: Rest of Asia Pacific Race Timing App Revenue (million) Forecast, by Application 2020 & 2033
Frequently Asked Questions
1. What is the projected Compound Annual Growth Rate (CAGR) of the Race Timing App?
The projected CAGR is approximately 6.9%.
2. Which companies are prominent players in the Race Timing App?
Key companies in the market include RaceSplitter, Webscorer, RaceID, RaceClocker, RaceTime, Sports Timing Solutions, RaceGorilla, Timing . Mobi, Orgsu, RunnerCard, XCMeet, race result, Sailrace, Wiclax, RaceChrono, FinishTime, RaceTec, Xtreme Action Park, RunSignup, Race Roster, Crossbox, SmartRace, RTRT.me, RUFUS, Timing Solutions.
3. What are the main segments of the Race Timing App?
The market segments include Application, Types.
4. Can you provide details about the market size?
The market size is estimated to be USD 310 million as of 2022.
5. What are some drivers contributing to market growth?
N/A
6. What are the notable trends driving market growth?
N/A
7. Are there any restraints impacting market growth?
N/A
8. Can you provide examples of recent developments in the market?
N/A
9. What pricing options are available for accessing the report?
Pricing options include single-user, multi-user, and enterprise licenses priced at USD 3950.00, USD 5925.00, and USD 7900.00 respectively.
10. Is the market size provided in terms of value or volume?
The market size is provided in terms of value, measured in million.
11. Are there any specific market keywords associated with the report?
Yes, the market keyword associated with the report is "Race Timing App," which aids in identifying and referencing the specific market segment covered.
12. How do I determine which pricing option suits my needs best?
The pricing options vary based on user requirements and access needs. Individual users may opt for single-user licenses, while businesses requiring broader access may choose multi-user or enterprise licenses for cost-effective access to the report.
13. Are there any additional resources or data provided in the Race Timing App report?
While the report offers comprehensive insights, it's advisable to review the specific contents or supplementary materials provided to ascertain if additional resources or data are available.
14. How can I stay updated on further developments or reports in the Race Timing App?
To stay informed about further developments, trends, and reports in the Race Timing App, consider subscribing to industry newsletters, following relevant companies and organizations, or regularly checking reputable industry news sources and publications.
Methodology
Step 1 - Identification of Relevant Samples Size from Population Database


Step 2 - Approaches for Defining Global Market Size (Value, Volume* & Price*)

Note*: In applicable scenarios
Step 3 - Data Sources
Primary Research
- Web Analytics
- Survey Reports
- Research Institute
- Latest Research Reports
- Opinion Leaders
Secondary Research
- Annual Reports
- White Paper
- Latest Press Release
- Industry Association
- Paid Database
- Investor Presentations

Step 4 - Data Triangulation
Involves using different sources of information in order to increase the validity of a study
These sources are likely to be stakeholders in a program - participants, other researchers, program staff, other community members, and so on.
Then we put all data in single framework & apply various statistical tools to find out the dynamic on the market.
During the analysis stage, feedback from the stakeholder groups would be compared to determine areas of agreement as well as areas of divergence