

Key Insights
The Remote Monitoring Services market is projected to expand significantly, driven by the pervasive adoption of IoT devices, the imperative for enhanced operational efficiency, and the growing demand for proactive maintenance across diverse industries. This market growth is underpinned by the increasing volume of data generated by connected devices, the necessity to minimize downtime, optimize resource allocation, and the escalating preference for predictive maintenance strategies to mitigate operational disruptions and costs. Leading companies such as Schneider Electric, Eaton, and HP are strategically positioning themselves to capitalize on this expanding market, complemented by specialized firms offering tailored solutions for specific sectors. The market's segmentation is anticipated to align with its broad application areas, including industrial automation, healthcare, energy, and IT infrastructure, each presenting unique monitoring and maintenance requirements. Despite challenges related to data security and system integration complexity, the market trajectory indicates substantial growth potential.
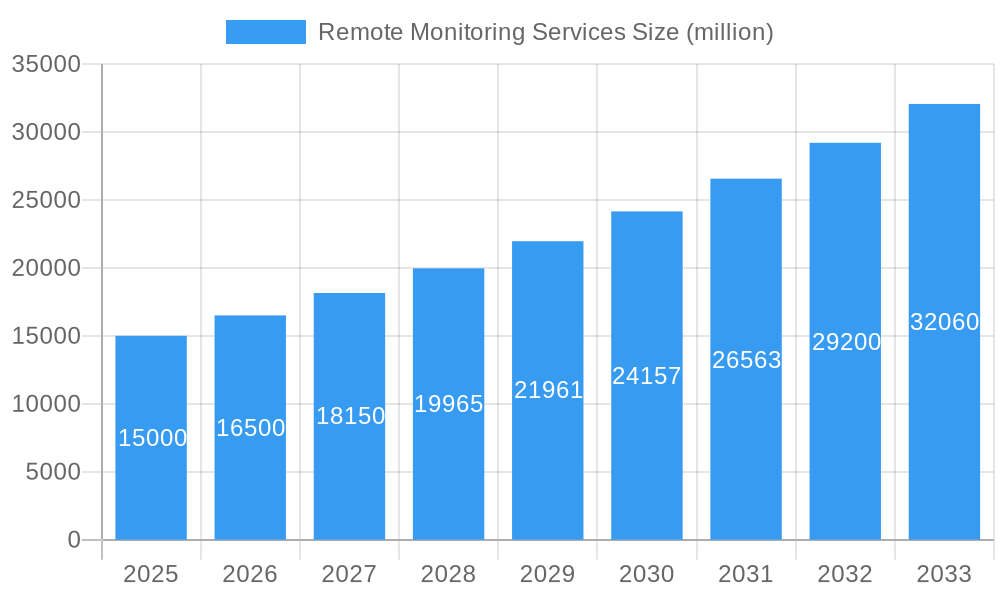
Remote Monitoring Services Market Size (In Billion)
Continued technological advancements, particularly in AI-powered analytics and cloud-based platforms, are expected to fuel sustained market expansion, enabling more sophisticated monitoring capabilities. Regional market dynamics will likely be shaped by technological infrastructure, industry concentration, and regulatory frameworks. North America and Europe are expected to maintain substantial market shares, while the Asia-Pacific region is poised for robust growth due to increasing industrialization and digital transformation initiatives. The competitive landscape is characterized by innovation and portfolio expansion from established players, alongside the emergence of new entrants targeting specific market segments. The overall market outlook is optimistic, with ongoing digitalization across industries driving continued expansion throughout the forecast period.
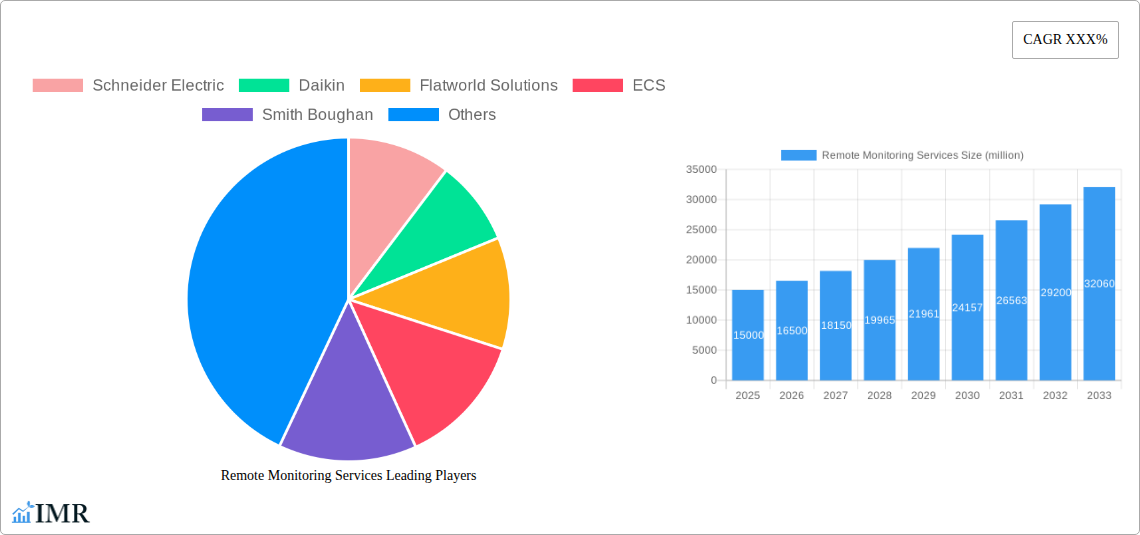
Remote Monitoring Services Company Market Share
Remote Monitoring Services Market Report: 2019-2033
This comprehensive report provides a detailed analysis of the Remote Monitoring Services market, encompassing market dynamics, growth trends, regional analysis, competitive landscape, and future outlook. The study period covers 2019-2033, with a base year of 2025 and a forecast period of 2025-2033. The report caters to industry professionals, investors, and strategic decision-makers seeking in-depth insights into this rapidly evolving sector. The total market size in 2025 is estimated at $xx billion, with a projected CAGR of xx% from 2025 to 2033. The parent market is the broader Internet of Things (IoT) market, while the child market comprises specific applications like industrial automation, healthcare, and building management.
Remote Monitoring Services Market Dynamics & Structure
The Remote Monitoring Services market is characterized by moderate concentration, with key players holding significant market share. Technological innovation, driven by advancements in AI, big data analytics, and cloud computing, is a primary growth driver. Regulatory frameworks, particularly concerning data privacy and security, are evolving and shaping market practices. Competition from alternative solutions, such as on-site monitoring, is present but limited by the cost-effectiveness and scalability of remote monitoring. The end-user demographics are diverse, encompassing industries like healthcare, manufacturing, and energy. M&A activity is expected to remain consistent with xx deals per year, driving consolidation within the sector.
- Market Concentration: Moderately concentrated, with top 5 players holding approximately xx% market share in 2025.
- Technological Innovation: Key drivers include AI, machine learning, and IoT advancements. Barriers include integration complexities and data security concerns.
- Regulatory Landscape: Compliance with data privacy regulations (e.g., GDPR, CCPA) is crucial. Stringent security standards are driving adoption of robust cybersecurity measures.
- Competitive Substitutes: On-site monitoring presents limited competition due to higher costs and reduced scalability.
- End-User Demographics: Diverse, encompassing manufacturing (xx%), healthcare (xx%), energy (xx%), and other industries.
- M&A Trends: Consolidation is expected to continue, with an estimated xx M&A deals per year during the forecast period.
Remote Monitoring Services Growth Trends & Insights
The Remote Monitoring Services market has witnessed significant growth over the historical period (2019-2024). Driven by increasing adoption of IoT devices, the market is expected to expand significantly over the forecast period. The adoption of remote monitoring is primarily driven by the need for enhanced operational efficiency, reduced costs, and improved decision-making. Technological disruptions, including the proliferation of 5G networks and advancements in edge computing, are further accelerating market growth. Consumer behavior is shifting towards proactive and predictive maintenance strategies, fueling demand for sophisticated remote monitoring solutions. The market is projected to reach $xx billion by 2033, exhibiting strong growth momentum across various sectors.
- Market size evolution: $xx billion in 2019, increasing to $xx billion in 2024, and expected to reach $xx billion in 2033.
- Adoption rates: xx% penetration in 2024, projected to reach xx% by 2033.
- Technological disruptions: 5G network expansion, edge computing advancements.
- Consumer behavior shifts: Increased preference for predictive maintenance, remote diagnostics, and real-time data insights.
Dominant Regions, Countries, or Segments in Remote Monitoring Services
North America currently holds the largest market share, driven by high technological adoption, robust infrastructure, and a strong focus on automation across various sectors. However, Asia-Pacific is anticipated to exhibit the fastest growth rate over the forecast period due to rapid industrialization, increasing investments in IoT infrastructure, and the expansion of smart cities initiatives. The healthcare segment is expected to remain a key driver of market growth due to the increasing need for remote patient monitoring and improved healthcare delivery efficiency.
- Key Drivers (North America): Advanced technology infrastructure, high adoption of automation, strong regulatory support for digital healthcare.
- Key Drivers (Asia-Pacific): Rapid industrialization, rising investments in smart cities, burgeoning healthcare sector.
- Market Share (North America): xx% in 2025.
- Growth Potential (Asia-Pacific): Highest CAGR during the forecast period (xx%).
- Dominant Segment: Healthcare, accounting for xx% of the market in 2025.
Remote Monitoring Services Product Landscape
The product landscape is characterized by a range of solutions, from basic remote monitoring systems to sophisticated platforms integrating advanced analytics and AI capabilities. These solutions cater to diverse applications, including predictive maintenance, remote diagnostics, and real-time performance monitoring. Key performance metrics include uptime, accuracy of data, and ease of integration with existing systems. The competitive advantage lies in offering customizable solutions, robust data security, and seamless user experience. Innovative products are incorporating AI-powered anomaly detection and predictive analytics to optimize operational efficiency and minimize downtime.
Key Drivers, Barriers & Challenges in Remote Monitoring Services
Key Drivers: The increasing need for operational efficiency and reduced costs across various industries is a primary growth driver. Advancements in sensor technology, the proliferation of IoT devices, and the widespread adoption of cloud computing are also key factors. Government initiatives promoting digital transformation and smart city development further accelerate market growth.
Challenges: Data security and privacy concerns remain significant barriers. Integration complexities and the need for skilled professionals can hinder widespread adoption. The high initial investment cost for implementing remote monitoring systems can also limit market penetration, especially for smaller businesses. Supply chain disruptions resulting in component shortages can also negatively impact production and delivery timelines.
Emerging Opportunities in Remote Monitoring Services
Untapped markets exist in developing economies with growing industrialization and increasing internet penetration. Innovative applications such as remote asset management and real-time supply chain visibility present significant opportunities for market expansion. Growing consumer preference for personalized and proactive service models will further fuel demand for specialized remote monitoring solutions. The integration of remote monitoring with other emerging technologies, such as blockchain and extended reality (XR), will unlock new possibilities.
Growth Accelerators in the Remote Monitoring Services Industry
Technological breakthroughs, particularly in AI, machine learning, and edge computing, will continue to drive market growth. Strategic partnerships between technology providers and end-users will facilitate faster adoption and integration. Market expansion strategies focusing on developing economies and emerging applications will unlock significant growth potential. The development of industry-specific solutions and vertical integration strategies will further accelerate market expansion.
Key Players Shaping the Remote Monitoring Services Market
- Schneider Electric
- Daikin
- Flatworld Solutions
- ECS
- Smith Boughan
- Suma Soft
- Outsource2india
- Dromaeus IT Services
- Farsight Security Services
- Eaton
- Tutela
- HP
- Konica Minolta
- Connectria
- DISA Group
- Aggreko
Notable Milestones in Remote Monitoring Services Sector
- 2020: Increased adoption of remote monitoring solutions in the healthcare sector due to the COVID-19 pandemic.
- 2021: Several key players announced strategic partnerships to integrate AI-powered analytics into their remote monitoring platforms.
- 2022: Significant investments in the development of 5G-enabled remote monitoring solutions.
- 2023: Launch of several new products with enhanced cybersecurity features.
- 2024: Several mergers and acquisitions consolidate the market landscape.
In-Depth Remote Monitoring Services Market Outlook
The Remote Monitoring Services market is poised for sustained growth, driven by technological advancements, increasing digitalization, and the expanding adoption of IoT across various sectors. Strategic partnerships, focus on innovation, and expansion into untapped markets will be crucial for long-term success. The market's future potential is significant, with opportunities for both established players and new entrants to capitalize on the evolving technological landscape and growing demand for efficient and cost-effective remote monitoring solutions.
Remote Monitoring Services Segmentation
-
1. Application
- 1.1. Enterprise
- 1.2. Server Message Block
- 1.3. Residental
-
2. Type
- 2.1. Servers Monitoring Services
- 2.2. Infrastructure Monitoring Services
- 2.3. Network Monitoring Services
- 2.4. Network Operation Center Services
- 2.5. Security Operation Center Services
- 2.6. Remote Diagnostic Services
- 2.7. Database Monitoring Services
Remote Monitoring Services Segmentation By Geography
-
1. North America
- 1.1. United States
- 1.2. Canada
- 1.3. Mexico
-
2. South America
- 2.1. Brazil
- 2.2. Argentina
- 2.3. Rest of South America
-
3. Europe
- 3.1. United Kingdom
- 3.2. Germany
- 3.3. France
- 3.4. Italy
- 3.5. Spain
- 3.6. Russia
- 3.7. Benelux
- 3.8. Nordics
- 3.9. Rest of Europe
-
4. Middle East & Africa
- 4.1. Turkey
- 4.2. Israel
- 4.3. GCC
- 4.4. North Africa
- 4.5. South Africa
- 4.6. Rest of Middle East & Africa
-
5. Asia Pacific
- 5.1. China
- 5.2. India
- 5.3. Japan
- 5.4. South Korea
- 5.5. ASEAN
- 5.6. Oceania
- 5.7. Rest of Asia Pacific

Remote Monitoring Services Regional Market Share
Geographic Coverage of Remote Monitoring Services
Remote Monitoring Services REPORT HIGHLIGHTS
| Aspects | Details |
|---|---|
| Study Period | 2020-2034 |
| Base Year | 2025 |
| Estimated Year | 2026 |
| Forecast Period | 2026-2034 |
| Historical Period | 2020-2025 |
| Growth Rate | CAGR of 14% from 2020-2034 |
| Segmentation |
|
Table of Contents
- 1. Introduction
- 1.1. Research Scope
- 1.2. Market Segmentation
- 1.3. Research Objective
- 1.4. Definitions and Assumptions
- 2. Executive Summary
- 2.1. Market Snapshot
- 3. Market Dynamics
- 3.1. Market Drivers
- 3.2. Market Restrains
- 3.3. Market Trends
- 3.4. Market Opportunities
- 4. Market Factor Analysis
- 4.1. Porters Five Forces
- 4.1.1. Bargaining Power of Suppliers
- 4.1.2. Bargaining Power of Buyers
- 4.1.3. Threat of New Entrants
- 4.1.4. Threat of Substitutes
- 4.1.5. Competitive Rivalry
- 4.2. PESTEL analysis
- 4.3. BCG Analysis
- 4.3.1. Stars (High Growth, High Market Share)
- 4.3.2. Cash Cows (Low Growth, High Market Share)
- 4.3.3. Question Mark (High Growth, Low Market Share)
- 4.3.4. Dogs (Low Growth, Low Market Share)
- 4.4. Ansoff Matrix Analysis
- 4.5. Supply Chain Analysis
- 4.6. Regulatory Landscape
- 4.7. Current Market Potential and Opportunity Assessment (TAM–SAM–SOM Framework)
- 4.8. IMR Analyst Note
- 4.1. Porters Five Forces
- 5. Market Analysis, Insights and Forecast 2021-2033
- 5.1. Market Analysis, Insights and Forecast - by Application
- 5.1.1. Enterprise
- 5.1.2. Server Message Block
- 5.1.3. Residental
- 5.2. Market Analysis, Insights and Forecast - by Type
- 5.2.1. Servers Monitoring Services
- 5.2.2. Infrastructure Monitoring Services
- 5.2.3. Network Monitoring Services
- 5.2.4. Network Operation Center Services
- 5.2.5. Security Operation Center Services
- 5.2.6. Remote Diagnostic Services
- 5.2.7. Database Monitoring Services
- 5.3. Market Analysis, Insights and Forecast - by Region
- 5.3.1. North America
- 5.3.2. South America
- 5.3.3. Europe
- 5.3.4. Middle East & Africa
- 5.3.5. Asia Pacific
- 5.1. Market Analysis, Insights and Forecast - by Application
- 6. Global Remote Monitoring Services Analysis, Insights and Forecast, 2021-2033
- 6.1. Market Analysis, Insights and Forecast - by Application
- 6.1.1. Enterprise
- 6.1.2. Server Message Block
- 6.1.3. Residental
- 6.2. Market Analysis, Insights and Forecast - by Type
- 6.2.1. Servers Monitoring Services
- 6.2.2. Infrastructure Monitoring Services
- 6.2.3. Network Monitoring Services
- 6.2.4. Network Operation Center Services
- 6.2.5. Security Operation Center Services
- 6.2.6. Remote Diagnostic Services
- 6.2.7. Database Monitoring Services
- 6.1. Market Analysis, Insights and Forecast - by Application
- 7. North America Remote Monitoring Services Analysis, Insights and Forecast, 2020-2032
- 7.1. Market Analysis, Insights and Forecast - by Application
- 7.1.1. Enterprise
- 7.1.2. Server Message Block
- 7.1.3. Residental
- 7.2. Market Analysis, Insights and Forecast - by Type
- 7.2.1. Servers Monitoring Services
- 7.2.2. Infrastructure Monitoring Services
- 7.2.3. Network Monitoring Services
- 7.2.4. Network Operation Center Services
- 7.2.5. Security Operation Center Services
- 7.2.6. Remote Diagnostic Services
- 7.2.7. Database Monitoring Services
- 7.1. Market Analysis, Insights and Forecast - by Application
- 8. South America Remote Monitoring Services Analysis, Insights and Forecast, 2020-2032
- 8.1. Market Analysis, Insights and Forecast - by Application
- 8.1.1. Enterprise
- 8.1.2. Server Message Block
- 8.1.3. Residental
- 8.2. Market Analysis, Insights and Forecast - by Type
- 8.2.1. Servers Monitoring Services
- 8.2.2. Infrastructure Monitoring Services
- 8.2.3. Network Monitoring Services
- 8.2.4. Network Operation Center Services
- 8.2.5. Security Operation Center Services
- 8.2.6. Remote Diagnostic Services
- 8.2.7. Database Monitoring Services
- 8.1. Market Analysis, Insights and Forecast - by Application
- 9. Europe Remote Monitoring Services Analysis, Insights and Forecast, 2020-2032
- 9.1. Market Analysis, Insights and Forecast - by Application
- 9.1.1. Enterprise
- 9.1.2. Server Message Block
- 9.1.3. Residental
- 9.2. Market Analysis, Insights and Forecast - by Type
- 9.2.1. Servers Monitoring Services
- 9.2.2. Infrastructure Monitoring Services
- 9.2.3. Network Monitoring Services
- 9.2.4. Network Operation Center Services
- 9.2.5. Security Operation Center Services
- 9.2.6. Remote Diagnostic Services
- 9.2.7. Database Monitoring Services
- 9.1. Market Analysis, Insights and Forecast - by Application
- 10. Middle East & Africa Remote Monitoring Services Analysis, Insights and Forecast, 2020-2032
- 10.1. Market Analysis, Insights and Forecast - by Application
- 10.1.1. Enterprise
- 10.1.2. Server Message Block
- 10.1.3. Residental
- 10.2. Market Analysis, Insights and Forecast - by Type
- 10.2.1. Servers Monitoring Services
- 10.2.2. Infrastructure Monitoring Services
- 10.2.3. Network Monitoring Services
- 10.2.4. Network Operation Center Services
- 10.2.5. Security Operation Center Services
- 10.2.6. Remote Diagnostic Services
- 10.2.7. Database Monitoring Services
- 10.1. Market Analysis, Insights and Forecast - by Application
- 11. Asia Pacific Remote Monitoring Services Analysis, Insights and Forecast, 2020-2032
- 11.1. Market Analysis, Insights and Forecast - by Application
- 11.1.1. Enterprise
- 11.1.2. Server Message Block
- 11.1.3. Residental
- 11.2. Market Analysis, Insights and Forecast - by Type
- 11.2.1. Servers Monitoring Services
- 11.2.2. Infrastructure Monitoring Services
- 11.2.3. Network Monitoring Services
- 11.2.4. Network Operation Center Services
- 11.2.5. Security Operation Center Services
- 11.2.6. Remote Diagnostic Services
- 11.2.7. Database Monitoring Services
- 11.1. Market Analysis, Insights and Forecast - by Application
- 12. Competitive Analysis
- 12.1. Company Profiles
- 12.1.1 Schneider Electric
- 12.1.1.1. Company Overview
- 12.1.1.2. Products
- 12.1.1.3. Company Financials
- 12.1.1.4. SWOT Analysis
- 12.1.2 Daikin
- 12.1.2.1. Company Overview
- 12.1.2.2. Products
- 12.1.2.3. Company Financials
- 12.1.2.4. SWOT Analysis
- 12.1.3 Flatworld Solutions
- 12.1.3.1. Company Overview
- 12.1.3.2. Products
- 12.1.3.3. Company Financials
- 12.1.3.4. SWOT Analysis
- 12.1.4 ECS
- 12.1.4.1. Company Overview
- 12.1.4.2. Products
- 12.1.4.3. Company Financials
- 12.1.4.4. SWOT Analysis
- 12.1.5 Smith Boughan
- 12.1.5.1. Company Overview
- 12.1.5.2. Products
- 12.1.5.3. Company Financials
- 12.1.5.4. SWOT Analysis
- 12.1.6 Suma Soft
- 12.1.6.1. Company Overview
- 12.1.6.2. Products
- 12.1.6.3. Company Financials
- 12.1.6.4. SWOT Analysis
- 12.1.7 Outsource2india
- 12.1.7.1. Company Overview
- 12.1.7.2. Products
- 12.1.7.3. Company Financials
- 12.1.7.4. SWOT Analysis
- 12.1.8 Dromaeus IT Services
- 12.1.8.1. Company Overview
- 12.1.8.2. Products
- 12.1.8.3. Company Financials
- 12.1.8.4. SWOT Analysis
- 12.1.9 Farsight Security Services
- 12.1.9.1. Company Overview
- 12.1.9.2. Products
- 12.1.9.3. Company Financials
- 12.1.9.4. SWOT Analysis
- 12.1.10 Eaton
- 12.1.10.1. Company Overview
- 12.1.10.2. Products
- 12.1.10.3. Company Financials
- 12.1.10.4. SWOT Analysis
- 12.1.11 Tutela
- 12.1.11.1. Company Overview
- 12.1.11.2. Products
- 12.1.11.3. Company Financials
- 12.1.11.4. SWOT Analysis
- 12.1.12 HP
- 12.1.12.1. Company Overview
- 12.1.12.2. Products
- 12.1.12.3. Company Financials
- 12.1.12.4. SWOT Analysis
- 12.1.13 Konica Minolta
- 12.1.13.1. Company Overview
- 12.1.13.2. Products
- 12.1.13.3. Company Financials
- 12.1.13.4. SWOT Analysis
- 12.1.14 Connectria
- 12.1.14.1. Company Overview
- 12.1.14.2. Products
- 12.1.14.3. Company Financials
- 12.1.14.4. SWOT Analysis
- 12.1.15 DISA Group
- 12.1.15.1. Company Overview
- 12.1.15.2. Products
- 12.1.15.3. Company Financials
- 12.1.15.4. SWOT Analysis
- 12.1.16 Aggreko
- 12.1.16.1. Company Overview
- 12.1.16.2. Products
- 12.1.16.3. Company Financials
- 12.1.16.4. SWOT Analysis
- 12.1.1 Schneider Electric
- 12.2. Market Entropy
- 12.2.1 Company's Key Areas Served
- 12.2.2 Recent Developments
- 12.3. Company Market Share Analysis 2025
- 12.3.1 Top 5 Companies Market Share Analysis
- 12.3.2 Top 3 Companies Market Share Analysis
- 12.4. List of Potential Customers
- 13. Research Methodology
List of Figures
- Figure 1: Global Remote Monitoring Services Revenue Breakdown (billion, %) by Region 2025 & 2033
- Figure 2: North America Remote Monitoring Services Revenue (billion), by Application 2025 & 2033
- Figure 3: North America Remote Monitoring Services Revenue Share (%), by Application 2025 & 2033
- Figure 4: North America Remote Monitoring Services Revenue (billion), by Type 2025 & 2033
- Figure 5: North America Remote Monitoring Services Revenue Share (%), by Type 2025 & 2033
- Figure 6: North America Remote Monitoring Services Revenue (billion), by Country 2025 & 2033
- Figure 7: North America Remote Monitoring Services Revenue Share (%), by Country 2025 & 2033
- Figure 8: South America Remote Monitoring Services Revenue (billion), by Application 2025 & 2033
- Figure 9: South America Remote Monitoring Services Revenue Share (%), by Application 2025 & 2033
- Figure 10: South America Remote Monitoring Services Revenue (billion), by Type 2025 & 2033
- Figure 11: South America Remote Monitoring Services Revenue Share (%), by Type 2025 & 2033
- Figure 12: South America Remote Monitoring Services Revenue (billion), by Country 2025 & 2033
- Figure 13: South America Remote Monitoring Services Revenue Share (%), by Country 2025 & 2033
- Figure 14: Europe Remote Monitoring Services Revenue (billion), by Application 2025 & 2033
- Figure 15: Europe Remote Monitoring Services Revenue Share (%), by Application 2025 & 2033
- Figure 16: Europe Remote Monitoring Services Revenue (billion), by Type 2025 & 2033
- Figure 17: Europe Remote Monitoring Services Revenue Share (%), by Type 2025 & 2033
- Figure 18: Europe Remote Monitoring Services Revenue (billion), by Country 2025 & 2033
- Figure 19: Europe Remote Monitoring Services Revenue Share (%), by Country 2025 & 2033
- Figure 20: Middle East & Africa Remote Monitoring Services Revenue (billion), by Application 2025 & 2033
- Figure 21: Middle East & Africa Remote Monitoring Services Revenue Share (%), by Application 2025 & 2033
- Figure 22: Middle East & Africa Remote Monitoring Services Revenue (billion), by Type 2025 & 2033
- Figure 23: Middle East & Africa Remote Monitoring Services Revenue Share (%), by Type 2025 & 2033
- Figure 24: Middle East & Africa Remote Monitoring Services Revenue (billion), by Country 2025 & 2033
- Figure 25: Middle East & Africa Remote Monitoring Services Revenue Share (%), by Country 2025 & 2033
- Figure 26: Asia Pacific Remote Monitoring Services Revenue (billion), by Application 2025 & 2033
- Figure 27: Asia Pacific Remote Monitoring Services Revenue Share (%), by Application 2025 & 2033
- Figure 28: Asia Pacific Remote Monitoring Services Revenue (billion), by Type 2025 & 2033
- Figure 29: Asia Pacific Remote Monitoring Services Revenue Share (%), by Type 2025 & 2033
- Figure 30: Asia Pacific Remote Monitoring Services Revenue (billion), by Country 2025 & 2033
- Figure 31: Asia Pacific Remote Monitoring Services Revenue Share (%), by Country 2025 & 2033
List of Tables
- Table 1: Global Remote Monitoring Services Revenue billion Forecast, by Application 2020 & 2033
- Table 2: Global Remote Monitoring Services Revenue billion Forecast, by Type 2020 & 2033
- Table 3: Global Remote Monitoring Services Revenue billion Forecast, by Region 2020 & 2033
- Table 4: Global Remote Monitoring Services Revenue billion Forecast, by Application 2020 & 2033
- Table 5: Global Remote Monitoring Services Revenue billion Forecast, by Type 2020 & 2033
- Table 6: Global Remote Monitoring Services Revenue billion Forecast, by Country 2020 & 2033
- Table 7: United States Remote Monitoring Services Revenue (billion) Forecast, by Application 2020 & 2033
- Table 8: Canada Remote Monitoring Services Revenue (billion) Forecast, by Application 2020 & 2033
- Table 9: Mexico Remote Monitoring Services Revenue (billion) Forecast, by Application 2020 & 2033
- Table 10: Global Remote Monitoring Services Revenue billion Forecast, by Application 2020 & 2033
- Table 11: Global Remote Monitoring Services Revenue billion Forecast, by Type 2020 & 2033
- Table 12: Global Remote Monitoring Services Revenue billion Forecast, by Country 2020 & 2033
- Table 13: Brazil Remote Monitoring Services Revenue (billion) Forecast, by Application 2020 & 2033
- Table 14: Argentina Remote Monitoring Services Revenue (billion) Forecast, by Application 2020 & 2033
- Table 15: Rest of South America Remote Monitoring Services Revenue (billion) Forecast, by Application 2020 & 2033
- Table 16: Global Remote Monitoring Services Revenue billion Forecast, by Application 2020 & 2033
- Table 17: Global Remote Monitoring Services Revenue billion Forecast, by Type 2020 & 2033
- Table 18: Global Remote Monitoring Services Revenue billion Forecast, by Country 2020 & 2033
- Table 19: United Kingdom Remote Monitoring Services Revenue (billion) Forecast, by Application 2020 & 2033
- Table 20: Germany Remote Monitoring Services Revenue (billion) Forecast, by Application 2020 & 2033
- Table 21: France Remote Monitoring Services Revenue (billion) Forecast, by Application 2020 & 2033
- Table 22: Italy Remote Monitoring Services Revenue (billion) Forecast, by Application 2020 & 2033
- Table 23: Spain Remote Monitoring Services Revenue (billion) Forecast, by Application 2020 & 2033
- Table 24: Russia Remote Monitoring Services Revenue (billion) Forecast, by Application 2020 & 2033
- Table 25: Benelux Remote Monitoring Services Revenue (billion) Forecast, by Application 2020 & 2033
- Table 26: Nordics Remote Monitoring Services Revenue (billion) Forecast, by Application 2020 & 2033
- Table 27: Rest of Europe Remote Monitoring Services Revenue (billion) Forecast, by Application 2020 & 2033
- Table 28: Global Remote Monitoring Services Revenue billion Forecast, by Application 2020 & 2033
- Table 29: Global Remote Monitoring Services Revenue billion Forecast, by Type 2020 & 2033
- Table 30: Global Remote Monitoring Services Revenue billion Forecast, by Country 2020 & 2033
- Table 31: Turkey Remote Monitoring Services Revenue (billion) Forecast, by Application 2020 & 2033
- Table 32: Israel Remote Monitoring Services Revenue (billion) Forecast, by Application 2020 & 2033
- Table 33: GCC Remote Monitoring Services Revenue (billion) Forecast, by Application 2020 & 2033
- Table 34: North Africa Remote Monitoring Services Revenue (billion) Forecast, by Application 2020 & 2033
- Table 35: South Africa Remote Monitoring Services Revenue (billion) Forecast, by Application 2020 & 2033
- Table 36: Rest of Middle East & Africa Remote Monitoring Services Revenue (billion) Forecast, by Application 2020 & 2033
- Table 37: Global Remote Monitoring Services Revenue billion Forecast, by Application 2020 & 2033
- Table 38: Global Remote Monitoring Services Revenue billion Forecast, by Type 2020 & 2033
- Table 39: Global Remote Monitoring Services Revenue billion Forecast, by Country 2020 & 2033
- Table 40: China Remote Monitoring Services Revenue (billion) Forecast, by Application 2020 & 2033
- Table 41: India Remote Monitoring Services Revenue (billion) Forecast, by Application 2020 & 2033
- Table 42: Japan Remote Monitoring Services Revenue (billion) Forecast, by Application 2020 & 2033
- Table 43: South Korea Remote Monitoring Services Revenue (billion) Forecast, by Application 2020 & 2033
- Table 44: ASEAN Remote Monitoring Services Revenue (billion) Forecast, by Application 2020 & 2033
- Table 45: Oceania Remote Monitoring Services Revenue (billion) Forecast, by Application 2020 & 2033
- Table 46: Rest of Asia Pacific Remote Monitoring Services Revenue (billion) Forecast, by Application 2020 & 2033
Frequently Asked Questions
1. What is the projected Compound Annual Growth Rate (CAGR) of the Remote Monitoring Services?
The projected CAGR is approximately 14%.
2. Which companies are prominent players in the Remote Monitoring Services?
Key companies in the market include Schneider Electric, Daikin, Flatworld Solutions, ECS, Smith Boughan, Suma Soft, Outsource2india, Dromaeus IT Services, Farsight Security Services, Eaton, Tutela, HP, Konica Minolta, Connectria, DISA Group, Aggreko.
3. What are the main segments of the Remote Monitoring Services?
The market segments include Application, Type.
4. Can you provide details about the market size?
The market size is estimated to be USD 8.61 billion as of 2022.
5. What are some drivers contributing to market growth?
N/A
6. What are the notable trends driving market growth?
N/A
7. Are there any restraints impacting market growth?
N/A
8. Can you provide examples of recent developments in the market?
N/A
9. What pricing options are available for accessing the report?
Pricing options include single-user, multi-user, and enterprise licenses priced at USD 3950.00, USD 5925.00, and USD 7900.00 respectively.
10. Is the market size provided in terms of value or volume?
The market size is provided in terms of value, measured in billion.
11. Are there any specific market keywords associated with the report?
Yes, the market keyword associated with the report is "Remote Monitoring Services," which aids in identifying and referencing the specific market segment covered.
12. How do I determine which pricing option suits my needs best?
The pricing options vary based on user requirements and access needs. Individual users may opt for single-user licenses, while businesses requiring broader access may choose multi-user or enterprise licenses for cost-effective access to the report.
13. Are there any additional resources or data provided in the Remote Monitoring Services report?
While the report offers comprehensive insights, it's advisable to review the specific contents or supplementary materials provided to ascertain if additional resources or data are available.
14. How can I stay updated on further developments or reports in the Remote Monitoring Services?
To stay informed about further developments, trends, and reports in the Remote Monitoring Services, consider subscribing to industry newsletters, following relevant companies and organizations, or regularly checking reputable industry news sources and publications.
Methodology
Step 1 - Identification of Relevant Samples Size from Population Database


Step 2 - Approaches for Defining Global Market Size (Value, Volume* & Price*)

Note*: In applicable scenarios
Step 3 - Data Sources
Primary Research
- Web Analytics
- Survey Reports
- Research Institute
- Latest Research Reports
- Opinion Leaders
Secondary Research
- Annual Reports
- White Paper
- Latest Press Release
- Industry Association
- Paid Database
- Investor Presentations

Step 4 - Data Triangulation
Involves using different sources of information in order to increase the validity of a study
These sources are likely to be stakeholders in a program - participants, other researchers, program staff, other community members, and so on.
Then we put all data in single framework & apply various statistical tools to find out the dynamic on the market.
During the analysis stage, feedback from the stakeholder groups would be compared to determine areas of agreement as well as areas of divergence