

Key Insights
The RNA analytics market is poised for significant expansion, driven by advancements in sequencing technologies, the growing demand for personalized medicine, and a deepening understanding of RNA's biological significance. The market is projected to reach $8.8 billion by 2025, with a robust Compound Annual Growth Rate (CAGR) of 17.1% through 2033. This growth is propelled by the increasing adoption of RNA sequencing in clinical diagnostics, particularly for cancer detection and treatment monitoring, and its vital role in drug discovery and development for identifying novel targets and biomarkers. Technological advancements, including improvements in next-generation sequencing (NGS) and microarrays, are further accelerating market expansion. Key growth segments include RNA sequencing technologies and applications in clinical diagnostics. The pharmaceutical and biotechnology sector continues to be a primary end-user, with expanding adoption in hospitals and diagnostic centers broadening the market's reach.
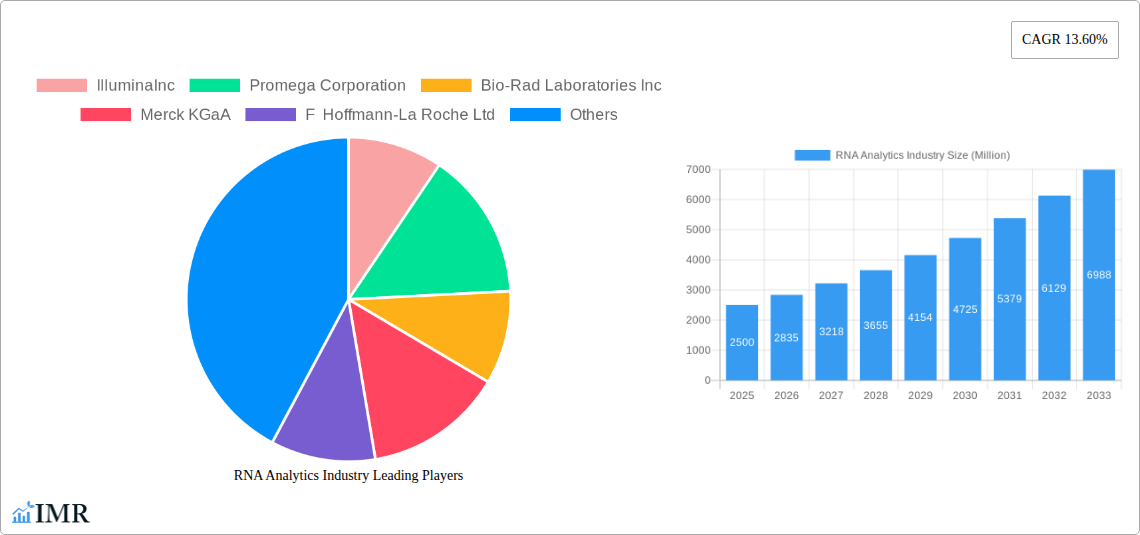
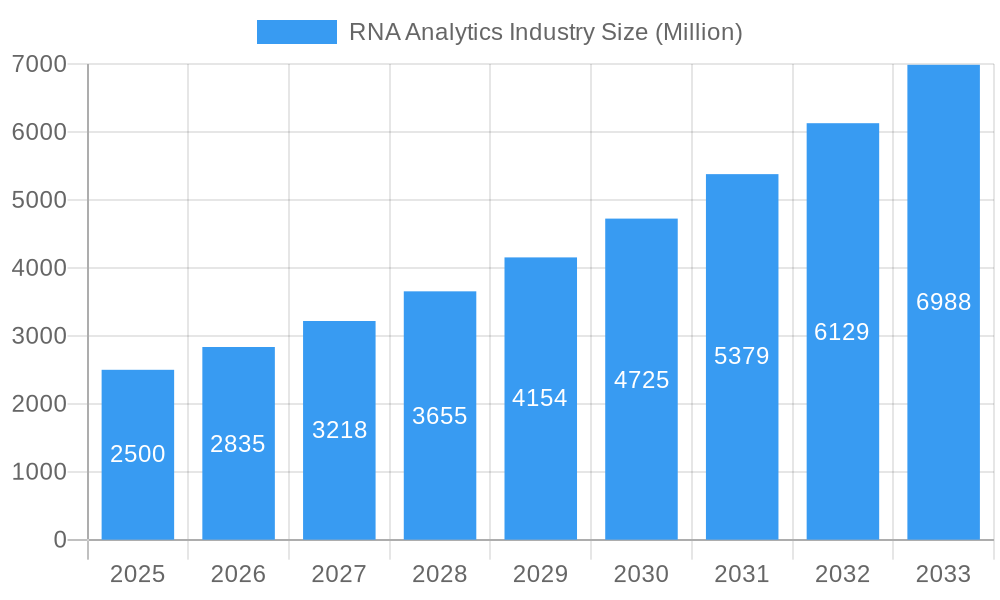
RNA Analytics Industry Market Size (In Billion)
North America and Europe currently dominate market share, attributed to their advanced research infrastructure and established healthcare systems. However, the Asia-Pacific region presents substantial growth opportunities, particularly in China and India, fueled by increased research and development investments and growing awareness of advanced diagnostic tools. While regulatory challenges and technology costs present some constraints, the market's trajectory is overwhelmingly positive, with considerable potential for future expansion driven by continuous technological innovation and the broadening applications of RNA analytics across diverse sectors.
RNA Analytics Industry Company Market Share
RNA Analytics Industry Market Report: 2019-2033
This comprehensive report provides a detailed analysis of the RNA Analytics industry, encompassing market dynamics, growth trends, regional segmentation, product landscapes, and key players. The study period covers 2019-2033, with a base year of 2025 and a forecast period of 2025-2033. The report is designed for industry professionals, investors, and researchers seeking a deep understanding of this rapidly evolving market. The global RNA analytics market size was valued at xx Million in 2024 and is projected to reach xx Million by 2033, exhibiting a CAGR of xx% during the forecast period.
RNA Analytics Industry Market Dynamics & Structure
The RNA analytics market is characterized by high growth potential fueled by technological advancements, rising demand for personalized medicine, and increasing government funding for research. Market concentration is moderate, with several key players dominating specific segments. However, the presence of numerous smaller companies specializing in niche technologies keeps the market competitive. Technological innovation is a key driver, with continuous improvements in sequencing technologies, microarray platforms, and PCR techniques. Regulatory frameworks, particularly concerning data privacy and clinical diagnostics, significantly impact market growth. Competitive product substitutes are limited, as RNA analytics provides unique insights not easily obtained through alternative methods. End-user demographics are shifting towards increased adoption by pharmaceutical and biotechnology companies, alongside growing demand from hospitals and diagnostic centers. M&A activity has been significant in recent years, driven by companies seeking to expand their product portfolios and geographical reach.
- Market Concentration: Moderately concentrated, with top 5 players holding approximately xx% market share in 2024.
- Technological Innovation: Rapid advancements in sequencing technologies (e.g., Next-Generation Sequencing) are driving market growth.
- Regulatory Landscape: Stringent regulations for clinical diagnostics and data privacy impact market access and adoption.
- Competitive Substitutes: Limited, due to the unique analytical capabilities of RNA analytics.
- M&A Activity: Significant activity in recent years, particularly focused on expanding product offerings and market access. Approximately xx M&A deals were recorded between 2019 and 2024.
- End-User Demographics: Pharmaceutical & Biotechnology companies represent the largest segment, followed by hospitals and diagnostic centers.
RNA Analytics Industry Growth Trends & Insights
The RNA analytics market has experienced substantial growth driven by increasing investments in genomic research, a rising prevalence of chronic diseases necessitating advanced diagnostic tools, and the expanding application of RNA analysis in drug discovery. The market size has shown a consistent upward trend from xx Million in 2019 to xx Million in 2024. The adoption rate of RNA analytics technologies is accelerating due to decreasing costs, improved accuracy, and broader availability. Technological disruptions, like the development of single-cell RNA sequencing, are creating new applications and expanding the market reach. Consumer behavior is shifting towards a preference for faster, more accurate, and cost-effective solutions. This translates into demand for higher-throughput instruments and user-friendly software.
Dominant Regions, Countries, or Segments in RNA Analytics Industry
North America currently dominates the RNA analytics market, driven by robust research infrastructure, high healthcare expenditure, and a large presence of key players. Within North America, the United States holds the largest market share due to its advanced research capabilities and significant investments in life sciences. Europe follows as a significant market, owing to substantial investments in genomic research and increasing adoption of personalized medicine strategies. Asia-Pacific is experiencing rapid growth, with countries like Japan and China driving expansion due to rising investments in healthcare and increased prevalence of chronic diseases.
By Product Type: Reagents/consumables holds the largest market share, reflecting high demand for consumables in various applications.
By Technology: Sequencing technology dominates the market due to its versatility and ability to provide high-throughput data.
By Application: Clinical diagnostics is a key driver, with high demand for RNA-based diagnostic tests for various diseases. Drug discovery represents significant growth potential.
By End User: Pharmaceutical & biotechnology companies and hospitals & diagnostic centers are the leading end-user segments.
- Key Drivers:
- Robust research infrastructure in North America and Europe.
- High healthcare expenditure in developed countries.
- Growing prevalence of chronic diseases globally.
- Increasing government investments in genomics research.
- Growing demand for personalized medicine.
RNA Analytics Industry Product Landscape
The RNA analytics product landscape is dynamic, featuring a wide range of reagents, instruments, and software solutions. Innovations focus on improving throughput, accuracy, and ease of use. Next-generation sequencing platforms offer high-throughput capabilities, while microarrays provide cost-effective solutions for specific applications. Real-time PCR systems are widely used for precise quantification of RNA. Companies are focusing on developing user-friendly software and data analysis tools to simplify workflow and interpretation of results. Unique selling propositions often center on speed, accuracy, and data analysis capabilities.
Key Drivers, Barriers & Challenges in RNA Analytics Industry
Key Drivers:
- Technological advancements in sequencing and other RNA analysis techniques.
- Increasing government funding and research initiatives.
- Rising prevalence of chronic diseases requiring advanced diagnostic tools.
- Growing demand for personalized medicine.
Key Barriers and Challenges:
- High initial investment costs associated with advanced instruments.
- Complexity of data analysis and interpretation.
- Regulatory hurdles and data privacy concerns.
- Intense competition among established players and emerging startups. This is estimated to reduce overall market growth by xx% by 2033.
Emerging Opportunities in RNA Analytics Industry
- Expansion of RNA-based diagnostics for early disease detection.
- Development of novel RNA therapeutics.
- Application of RNA analytics in agriculture and environmental monitoring.
- Increasing adoption of liquid biopsies using RNA analysis.
Growth Accelerators in the RNA Analytics Industry
Technological breakthroughs in single-cell RNA sequencing, coupled with advancements in data analysis and bioinformatics, are significantly accelerating market growth. Strategic partnerships between technology providers and pharmaceutical companies are driving innovation and market expansion. The expansion of RNA analytics into new applications beyond traditional areas such as clinical diagnostics and drug discovery offers considerable growth opportunities.
Key Players Shaping the RNA Analytics Industry Market
- Illumina Inc
- Promega Corporation
- Bio-Rad Laboratories Inc
- Merck KGaA
- F Hoffmann-La Roche Ltd
- Eurofins Scientific
- Agilent Technologies Inc
- LC Sciences
- GenXPro GmbH
- BioMérieux SA
- Thermo Fisher Scientific
- QIAGEN
Notable Milestones in RNA Analytics Industry Sector
- June 2022: Bio-Rad Laboratories, Inc. launched the SEQuoia Express Stranded RNA Library Prep Kit, enhancing RNA-sequencing workflows.
- February 2022: eRNA partnered with Merck KGaA for mRNA design and LNP-delivery platform advancements.
In-Depth RNA Analytics Industry Market Outlook
The future of the RNA analytics market is bright, driven by continuous technological advancements, increased adoption across various applications, and the potential for transformative breakthroughs in personalized medicine and RNA therapeutics. Strategic partnerships, geographic expansion, and ongoing innovation will be pivotal in shaping the future competitive landscape. The market is poised for sustained growth, driven by the unmet clinical needs and the promise of RNA-based solutions.
RNA Analytics Industry Segmentation
-
1. Product Type
- 1.1. Reagents/Consumables
- 1.2. Instruments
- 1.3. Other Product Types
-
2. Technology
- 2.1. Microarrays
- 2.2. Sequencing
- 2.3. Polymerase Chain Reaction (PCR)
- 2.4. Others
-
3. Application
- 3.1. Clinical Diagnostics
- 3.2. Drug Discovery
- 3.3. Toxicogenomic
- 3.4. Other Applications
-
4. End User
- 4.1. Pharmaceutical & Biotechnology Companies
- 4.2. Hospitals and Diagnostic Centers
- 4.3. Others
RNA Analytics Industry Segmentation By Geography
-
1. North America
- 1.1. United States
- 1.2. Canada
- 1.3. Mexico
-
2. Europe
- 2.1. Germany
- 2.2. United Kingdom
- 2.3. France
- 2.4. Italy
- 2.5. Spain
- 2.6. Rest of Europe
-
3. Asia Pacific
- 3.1. China
- 3.2. Japan
- 3.3. India
- 3.4. Australia
- 3.5. South Korea
- 3.6. Rest of Asia Pacific
-
4. Middle East and Africa
- 4.1. GCC
- 4.2. South Africa
- 4.3. Rest of Middle East and Africa
-
5. South America
- 5.1. Brazil
- 5.2. Argentina
- 5.3. Rest of South America
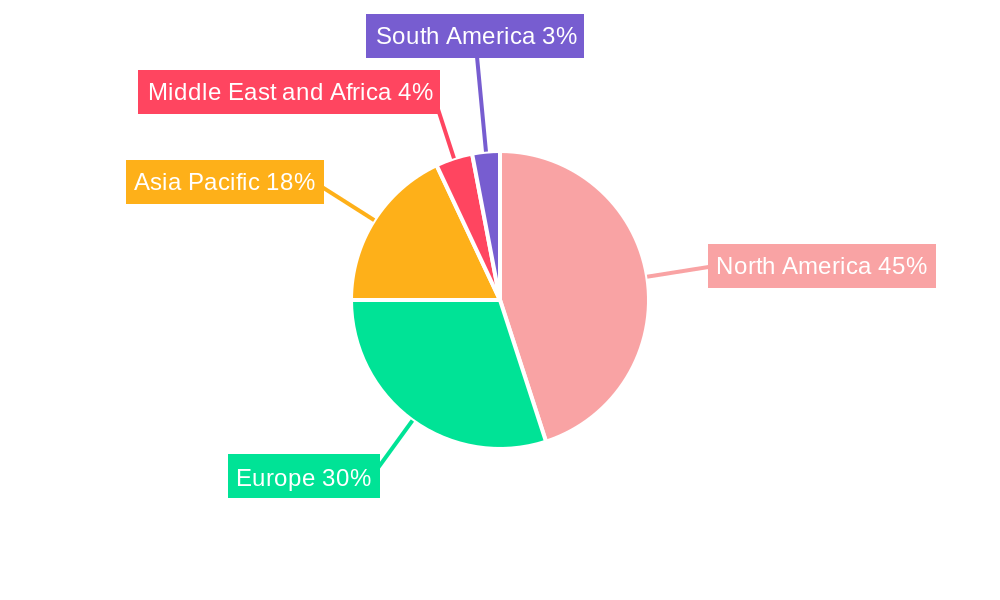
RNA Analytics Industry Regional Market Share
Geographic Coverage of RNA Analytics Industry
RNA Analytics Industry REPORT HIGHLIGHTS
| Aspects | Details |
|---|---|
| Study Period | 2020-2034 |
| Base Year | 2025 |
| Estimated Year | 2026 |
| Forecast Period | 2026-2034 |
| Historical Period | 2020-2025 |
| Growth Rate | CAGR of 17.1% from 2020-2034 |
| Segmentation |
|
Table of Contents
- 1. Introduction
- 1.1. Research Scope
- 1.2. Market Segmentation
- 1.3. Research Objective
- 1.4. Definitions and Assumptions
- 2. Executive Summary
- 2.1. Market Snapshot
- 3. Market Dynamics
- 3.1. Market Drivers
- 3.2. Market Restrains
- 3.3. Market Trends
- 3.4. Market Opportunities
- 4. Market Factor Analysis
- 4.1. Porters Five Forces
- 4.1.1. Bargaining Power of Suppliers
- 4.1.2. Bargaining Power of Buyers
- 4.1.3. Threat of New Entrants
- 4.1.4. Threat of Substitutes
- 4.1.5. Competitive Rivalry
- 4.2. PESTEL analysis
- 4.3. BCG Analysis
- 4.3.1. Stars (High Growth, High Market Share)
- 4.3.2. Cash Cows (Low Growth, High Market Share)
- 4.3.3. Question Mark (High Growth, Low Market Share)
- 4.3.4. Dogs (Low Growth, Low Market Share)
- 4.4. Ansoff Matrix Analysis
- 4.5. Supply Chain Analysis
- 4.6. Regulatory Landscape
- 4.7. Current Market Potential and Opportunity Assessment (TAM–SAM–SOM Framework)
- 4.8. IMR Analyst Note
- 4.1. Porters Five Forces
- 5. Market Analysis, Insights and Forecast 2021-2033
- 5.1. Market Analysis, Insights and Forecast - by Product Type
- 5.1.1. Reagents/Consumables
- 5.1.2. Instruments
- 5.1.3. Other Product Types
- 5.2. Market Analysis, Insights and Forecast - by Technology
- 5.2.1. Microarrays
- 5.2.2. Sequencing
- 5.2.3. Polymerase Chain Reaction (PCR)
- 5.2.4. Others
- 5.3. Market Analysis, Insights and Forecast - by Application
- 5.3.1. Clinical Diagnostics
- 5.3.2. Drug Discovery
- 5.3.3. Toxicogenomic
- 5.3.4. Other Applications
- 5.4. Market Analysis, Insights and Forecast - by End User
- 5.4.1. Pharmaceutical & Biotechnology Companies
- 5.4.2. Hospitals and Diagnostic Centers
- 5.4.3. Others
- 5.5. Market Analysis, Insights and Forecast - by Region
- 5.5.1. North America
- 5.5.2. Europe
- 5.5.3. Asia Pacific
- 5.5.4. Middle East and Africa
- 5.5.5. South America
- 5.1. Market Analysis, Insights and Forecast - by Product Type
- 6. Global RNA Analytics Industry Analysis, Insights and Forecast, 2021-2033
- 6.1. Market Analysis, Insights and Forecast - by Product Type
- 6.1.1. Reagents/Consumables
- 6.1.2. Instruments
- 6.1.3. Other Product Types
- 6.2. Market Analysis, Insights and Forecast - by Technology
- 6.2.1. Microarrays
- 6.2.2. Sequencing
- 6.2.3. Polymerase Chain Reaction (PCR)
- 6.2.4. Others
- 6.3. Market Analysis, Insights and Forecast - by Application
- 6.3.1. Clinical Diagnostics
- 6.3.2. Drug Discovery
- 6.3.3. Toxicogenomic
- 6.3.4. Other Applications
- 6.4. Market Analysis, Insights and Forecast - by End User
- 6.4.1. Pharmaceutical & Biotechnology Companies
- 6.4.2. Hospitals and Diagnostic Centers
- 6.4.3. Others
- 6.1. Market Analysis, Insights and Forecast - by Product Type
- 7. North America RNA Analytics Industry Analysis, Insights and Forecast, 2020-2032
- 7.1. Market Analysis, Insights and Forecast - by Product Type
- 7.1.1. Reagents/Consumables
- 7.1.2. Instruments
- 7.1.3. Other Product Types
- 7.2. Market Analysis, Insights and Forecast - by Technology
- 7.2.1. Microarrays
- 7.2.2. Sequencing
- 7.2.3. Polymerase Chain Reaction (PCR)
- 7.2.4. Others
- 7.3. Market Analysis, Insights and Forecast - by Application
- 7.3.1. Clinical Diagnostics
- 7.3.2. Drug Discovery
- 7.3.3. Toxicogenomic
- 7.3.4. Other Applications
- 7.4. Market Analysis, Insights and Forecast - by End User
- 7.4.1. Pharmaceutical & Biotechnology Companies
- 7.4.2. Hospitals and Diagnostic Centers
- 7.4.3. Others
- 7.1. Market Analysis, Insights and Forecast - by Product Type
- 8. Europe RNA Analytics Industry Analysis, Insights and Forecast, 2020-2032
- 8.1. Market Analysis, Insights and Forecast - by Product Type
- 8.1.1. Reagents/Consumables
- 8.1.2. Instruments
- 8.1.3. Other Product Types
- 8.2. Market Analysis, Insights and Forecast - by Technology
- 8.2.1. Microarrays
- 8.2.2. Sequencing
- 8.2.3. Polymerase Chain Reaction (PCR)
- 8.2.4. Others
- 8.3. Market Analysis, Insights and Forecast - by Application
- 8.3.1. Clinical Diagnostics
- 8.3.2. Drug Discovery
- 8.3.3. Toxicogenomic
- 8.3.4. Other Applications
- 8.4. Market Analysis, Insights and Forecast - by End User
- 8.4.1. Pharmaceutical & Biotechnology Companies
- 8.4.2. Hospitals and Diagnostic Centers
- 8.4.3. Others
- 8.1. Market Analysis, Insights and Forecast - by Product Type
- 9. Asia Pacific RNA Analytics Industry Analysis, Insights and Forecast, 2020-2032
- 9.1. Market Analysis, Insights and Forecast - by Product Type
- 9.1.1. Reagents/Consumables
- 9.1.2. Instruments
- 9.1.3. Other Product Types
- 9.2. Market Analysis, Insights and Forecast - by Technology
- 9.2.1. Microarrays
- 9.2.2. Sequencing
- 9.2.3. Polymerase Chain Reaction (PCR)
- 9.2.4. Others
- 9.3. Market Analysis, Insights and Forecast - by Application
- 9.3.1. Clinical Diagnostics
- 9.3.2. Drug Discovery
- 9.3.3. Toxicogenomic
- 9.3.4. Other Applications
- 9.4. Market Analysis, Insights and Forecast - by End User
- 9.4.1. Pharmaceutical & Biotechnology Companies
- 9.4.2. Hospitals and Diagnostic Centers
- 9.4.3. Others
- 9.1. Market Analysis, Insights and Forecast - by Product Type
- 10. Middle East and Africa RNA Analytics Industry Analysis, Insights and Forecast, 2020-2032
- 10.1. Market Analysis, Insights and Forecast - by Product Type
- 10.1.1. Reagents/Consumables
- 10.1.2. Instruments
- 10.1.3. Other Product Types
- 10.2. Market Analysis, Insights and Forecast - by Technology
- 10.2.1. Microarrays
- 10.2.2. Sequencing
- 10.2.3. Polymerase Chain Reaction (PCR)
- 10.2.4. Others
- 10.3. Market Analysis, Insights and Forecast - by Application
- 10.3.1. Clinical Diagnostics
- 10.3.2. Drug Discovery
- 10.3.3. Toxicogenomic
- 10.3.4. Other Applications
- 10.4. Market Analysis, Insights and Forecast - by End User
- 10.4.1. Pharmaceutical & Biotechnology Companies
- 10.4.2. Hospitals and Diagnostic Centers
- 10.4.3. Others
- 10.1. Market Analysis, Insights and Forecast - by Product Type
- 11. South America RNA Analytics Industry Analysis, Insights and Forecast, 2020-2032
- 11.1. Market Analysis, Insights and Forecast - by Product Type
- 11.1.1. Reagents/Consumables
- 11.1.2. Instruments
- 11.1.3. Other Product Types
- 11.2. Market Analysis, Insights and Forecast - by Technology
- 11.2.1. Microarrays
- 11.2.2. Sequencing
- 11.2.3. Polymerase Chain Reaction (PCR)
- 11.2.4. Others
- 11.3. Market Analysis, Insights and Forecast - by Application
- 11.3.1. Clinical Diagnostics
- 11.3.2. Drug Discovery
- 11.3.3. Toxicogenomic
- 11.3.4. Other Applications
- 11.4. Market Analysis, Insights and Forecast - by End User
- 11.4.1. Pharmaceutical & Biotechnology Companies
- 11.4.2. Hospitals and Diagnostic Centers
- 11.4.3. Others
- 11.1. Market Analysis, Insights and Forecast - by Product Type
- 12. Competitive Analysis
- 12.1. Company Profiles
- 12.1.1 IlluminaInc
- 12.1.1.1. Company Overview
- 12.1.1.2. Products
- 12.1.1.3. Company Financials
- 12.1.1.4. SWOT Analysis
- 12.1.2 Promega Corporation
- 12.1.2.1. Company Overview
- 12.1.2.2. Products
- 12.1.2.3. Company Financials
- 12.1.2.4. SWOT Analysis
- 12.1.3 Bio-Rad Laboratories Inc
- 12.1.3.1. Company Overview
- 12.1.3.2. Products
- 12.1.3.3. Company Financials
- 12.1.3.4. SWOT Analysis
- 12.1.4 Merck KGaA
- 12.1.4.1. Company Overview
- 12.1.4.2. Products
- 12.1.4.3. Company Financials
- 12.1.4.4. SWOT Analysis
- 12.1.5 F Hoffmann-La Roche Ltd
- 12.1.5.1. Company Overview
- 12.1.5.2. Products
- 12.1.5.3. Company Financials
- 12.1.5.4. SWOT Analysis
- 12.1.6 Eurofins Scientific
- 12.1.6.1. Company Overview
- 12.1.6.2. Products
- 12.1.6.3. Company Financials
- 12.1.6.4. SWOT Analysis
- 12.1.7 Agilent Technologies Inc
- 12.1.7.1. Company Overview
- 12.1.7.2. Products
- 12.1.7.3. Company Financials
- 12.1.7.4. SWOT Analysis
- 12.1.8 LC Sciences
- 12.1.8.1. Company Overview
- 12.1.8.2. Products
- 12.1.8.3. Company Financials
- 12.1.8.4. SWOT Analysis
- 12.1.9 GenXPro GmbH
- 12.1.9.1. Company Overview
- 12.1.9.2. Products
- 12.1.9.3. Company Financials
- 12.1.9.4. SWOT Analysis
- 12.1.10 BioMérieux SA
- 12.1.10.1. Company Overview
- 12.1.10.2. Products
- 12.1.10.3. Company Financials
- 12.1.10.4. SWOT Analysis
- 12.1.11 Thermo Fisher Scientific
- 12.1.11.1. Company Overview
- 12.1.11.2. Products
- 12.1.11.3. Company Financials
- 12.1.11.4. SWOT Analysis
- 12.1.12 QIAGEN
- 12.1.12.1. Company Overview
- 12.1.12.2. Products
- 12.1.12.3. Company Financials
- 12.1.12.4. SWOT Analysis
- 12.1.1 IlluminaInc
- 12.2. Market Entropy
- 12.2.1 Company's Key Areas Served
- 12.2.2 Recent Developments
- 12.3. Company Market Share Analysis 2025
- 12.3.1 Top 5 Companies Market Share Analysis
- 12.3.2 Top 3 Companies Market Share Analysis
- 12.4. List of Potential Customers
- 13. Research Methodology
List of Figures
- Figure 1: Global RNA Analytics Industry Revenue Breakdown (billion, %) by Region 2025 & 2033
- Figure 2: Global RNA Analytics Industry Volume Breakdown (K Unit, %) by Region 2025 & 2033
- Figure 3: North America RNA Analytics Industry Revenue (billion), by Product Type 2025 & 2033
- Figure 4: North America RNA Analytics Industry Volume (K Unit), by Product Type 2025 & 2033
- Figure 5: North America RNA Analytics Industry Revenue Share (%), by Product Type 2025 & 2033
- Figure 6: North America RNA Analytics Industry Volume Share (%), by Product Type 2025 & 2033
- Figure 7: North America RNA Analytics Industry Revenue (billion), by Technology 2025 & 2033
- Figure 8: North America RNA Analytics Industry Volume (K Unit), by Technology 2025 & 2033
- Figure 9: North America RNA Analytics Industry Revenue Share (%), by Technology 2025 & 2033
- Figure 10: North America RNA Analytics Industry Volume Share (%), by Technology 2025 & 2033
- Figure 11: North America RNA Analytics Industry Revenue (billion), by Application 2025 & 2033
- Figure 12: North America RNA Analytics Industry Volume (K Unit), by Application 2025 & 2033
- Figure 13: North America RNA Analytics Industry Revenue Share (%), by Application 2025 & 2033
- Figure 14: North America RNA Analytics Industry Volume Share (%), by Application 2025 & 2033
- Figure 15: North America RNA Analytics Industry Revenue (billion), by End User 2025 & 2033
- Figure 16: North America RNA Analytics Industry Volume (K Unit), by End User 2025 & 2033
- Figure 17: North America RNA Analytics Industry Revenue Share (%), by End User 2025 & 2033
- Figure 18: North America RNA Analytics Industry Volume Share (%), by End User 2025 & 2033
- Figure 19: North America RNA Analytics Industry Revenue (billion), by Country 2025 & 2033
- Figure 20: North America RNA Analytics Industry Volume (K Unit), by Country 2025 & 2033
- Figure 21: North America RNA Analytics Industry Revenue Share (%), by Country 2025 & 2033
- Figure 22: North America RNA Analytics Industry Volume Share (%), by Country 2025 & 2033
- Figure 23: Europe RNA Analytics Industry Revenue (billion), by Product Type 2025 & 2033
- Figure 24: Europe RNA Analytics Industry Volume (K Unit), by Product Type 2025 & 2033
- Figure 25: Europe RNA Analytics Industry Revenue Share (%), by Product Type 2025 & 2033
- Figure 26: Europe RNA Analytics Industry Volume Share (%), by Product Type 2025 & 2033
- Figure 27: Europe RNA Analytics Industry Revenue (billion), by Technology 2025 & 2033
- Figure 28: Europe RNA Analytics Industry Volume (K Unit), by Technology 2025 & 2033
- Figure 29: Europe RNA Analytics Industry Revenue Share (%), by Technology 2025 & 2033
- Figure 30: Europe RNA Analytics Industry Volume Share (%), by Technology 2025 & 2033
- Figure 31: Europe RNA Analytics Industry Revenue (billion), by Application 2025 & 2033
- Figure 32: Europe RNA Analytics Industry Volume (K Unit), by Application 2025 & 2033
- Figure 33: Europe RNA Analytics Industry Revenue Share (%), by Application 2025 & 2033
- Figure 34: Europe RNA Analytics Industry Volume Share (%), by Application 2025 & 2033
- Figure 35: Europe RNA Analytics Industry Revenue (billion), by End User 2025 & 2033
- Figure 36: Europe RNA Analytics Industry Volume (K Unit), by End User 2025 & 2033
- Figure 37: Europe RNA Analytics Industry Revenue Share (%), by End User 2025 & 2033
- Figure 38: Europe RNA Analytics Industry Volume Share (%), by End User 2025 & 2033
- Figure 39: Europe RNA Analytics Industry Revenue (billion), by Country 2025 & 2033
- Figure 40: Europe RNA Analytics Industry Volume (K Unit), by Country 2025 & 2033
- Figure 41: Europe RNA Analytics Industry Revenue Share (%), by Country 2025 & 2033
- Figure 42: Europe RNA Analytics Industry Volume Share (%), by Country 2025 & 2033
- Figure 43: Asia Pacific RNA Analytics Industry Revenue (billion), by Product Type 2025 & 2033
- Figure 44: Asia Pacific RNA Analytics Industry Volume (K Unit), by Product Type 2025 & 2033
- Figure 45: Asia Pacific RNA Analytics Industry Revenue Share (%), by Product Type 2025 & 2033
- Figure 46: Asia Pacific RNA Analytics Industry Volume Share (%), by Product Type 2025 & 2033
- Figure 47: Asia Pacific RNA Analytics Industry Revenue (billion), by Technology 2025 & 2033
- Figure 48: Asia Pacific RNA Analytics Industry Volume (K Unit), by Technology 2025 & 2033
- Figure 49: Asia Pacific RNA Analytics Industry Revenue Share (%), by Technology 2025 & 2033
- Figure 50: Asia Pacific RNA Analytics Industry Volume Share (%), by Technology 2025 & 2033
- Figure 51: Asia Pacific RNA Analytics Industry Revenue (billion), by Application 2025 & 2033
- Figure 52: Asia Pacific RNA Analytics Industry Volume (K Unit), by Application 2025 & 2033
- Figure 53: Asia Pacific RNA Analytics Industry Revenue Share (%), by Application 2025 & 2033
- Figure 54: Asia Pacific RNA Analytics Industry Volume Share (%), by Application 2025 & 2033
- Figure 55: Asia Pacific RNA Analytics Industry Revenue (billion), by End User 2025 & 2033
- Figure 56: Asia Pacific RNA Analytics Industry Volume (K Unit), by End User 2025 & 2033
- Figure 57: Asia Pacific RNA Analytics Industry Revenue Share (%), by End User 2025 & 2033
- Figure 58: Asia Pacific RNA Analytics Industry Volume Share (%), by End User 2025 & 2033
- Figure 59: Asia Pacific RNA Analytics Industry Revenue (billion), by Country 2025 & 2033
- Figure 60: Asia Pacific RNA Analytics Industry Volume (K Unit), by Country 2025 & 2033
- Figure 61: Asia Pacific RNA Analytics Industry Revenue Share (%), by Country 2025 & 2033
- Figure 62: Asia Pacific RNA Analytics Industry Volume Share (%), by Country 2025 & 2033
- Figure 63: Middle East and Africa RNA Analytics Industry Revenue (billion), by Product Type 2025 & 2033
- Figure 64: Middle East and Africa RNA Analytics Industry Volume (K Unit), by Product Type 2025 & 2033
- Figure 65: Middle East and Africa RNA Analytics Industry Revenue Share (%), by Product Type 2025 & 2033
- Figure 66: Middle East and Africa RNA Analytics Industry Volume Share (%), by Product Type 2025 & 2033
- Figure 67: Middle East and Africa RNA Analytics Industry Revenue (billion), by Technology 2025 & 2033
- Figure 68: Middle East and Africa RNA Analytics Industry Volume (K Unit), by Technology 2025 & 2033
- Figure 69: Middle East and Africa RNA Analytics Industry Revenue Share (%), by Technology 2025 & 2033
- Figure 70: Middle East and Africa RNA Analytics Industry Volume Share (%), by Technology 2025 & 2033
- Figure 71: Middle East and Africa RNA Analytics Industry Revenue (billion), by Application 2025 & 2033
- Figure 72: Middle East and Africa RNA Analytics Industry Volume (K Unit), by Application 2025 & 2033
- Figure 73: Middle East and Africa RNA Analytics Industry Revenue Share (%), by Application 2025 & 2033
- Figure 74: Middle East and Africa RNA Analytics Industry Volume Share (%), by Application 2025 & 2033
- Figure 75: Middle East and Africa RNA Analytics Industry Revenue (billion), by End User 2025 & 2033
- Figure 76: Middle East and Africa RNA Analytics Industry Volume (K Unit), by End User 2025 & 2033
- Figure 77: Middle East and Africa RNA Analytics Industry Revenue Share (%), by End User 2025 & 2033
- Figure 78: Middle East and Africa RNA Analytics Industry Volume Share (%), by End User 2025 & 2033
- Figure 79: Middle East and Africa RNA Analytics Industry Revenue (billion), by Country 2025 & 2033
- Figure 80: Middle East and Africa RNA Analytics Industry Volume (K Unit), by Country 2025 & 2033
- Figure 81: Middle East and Africa RNA Analytics Industry Revenue Share (%), by Country 2025 & 2033
- Figure 82: Middle East and Africa RNA Analytics Industry Volume Share (%), by Country 2025 & 2033
- Figure 83: South America RNA Analytics Industry Revenue (billion), by Product Type 2025 & 2033
- Figure 84: South America RNA Analytics Industry Volume (K Unit), by Product Type 2025 & 2033
- Figure 85: South America RNA Analytics Industry Revenue Share (%), by Product Type 2025 & 2033
- Figure 86: South America RNA Analytics Industry Volume Share (%), by Product Type 2025 & 2033
- Figure 87: South America RNA Analytics Industry Revenue (billion), by Technology 2025 & 2033
- Figure 88: South America RNA Analytics Industry Volume (K Unit), by Technology 2025 & 2033
- Figure 89: South America RNA Analytics Industry Revenue Share (%), by Technology 2025 & 2033
- Figure 90: South America RNA Analytics Industry Volume Share (%), by Technology 2025 & 2033
- Figure 91: South America RNA Analytics Industry Revenue (billion), by Application 2025 & 2033
- Figure 92: South America RNA Analytics Industry Volume (K Unit), by Application 2025 & 2033
- Figure 93: South America RNA Analytics Industry Revenue Share (%), by Application 2025 & 2033
- Figure 94: South America RNA Analytics Industry Volume Share (%), by Application 2025 & 2033
- Figure 95: South America RNA Analytics Industry Revenue (billion), by End User 2025 & 2033
- Figure 96: South America RNA Analytics Industry Volume (K Unit), by End User 2025 & 2033
- Figure 97: South America RNA Analytics Industry Revenue Share (%), by End User 2025 & 2033
- Figure 98: South America RNA Analytics Industry Volume Share (%), by End User 2025 & 2033
- Figure 99: South America RNA Analytics Industry Revenue (billion), by Country 2025 & 2033
- Figure 100: South America RNA Analytics Industry Volume (K Unit), by Country 2025 & 2033
- Figure 101: South America RNA Analytics Industry Revenue Share (%), by Country 2025 & 2033
- Figure 102: South America RNA Analytics Industry Volume Share (%), by Country 2025 & 2033
List of Tables
- Table 1: Global RNA Analytics Industry Revenue billion Forecast, by Product Type 2020 & 2033
- Table 2: Global RNA Analytics Industry Volume K Unit Forecast, by Product Type 2020 & 2033
- Table 3: Global RNA Analytics Industry Revenue billion Forecast, by Technology 2020 & 2033
- Table 4: Global RNA Analytics Industry Volume K Unit Forecast, by Technology 2020 & 2033
- Table 5: Global RNA Analytics Industry Revenue billion Forecast, by Application 2020 & 2033
- Table 6: Global RNA Analytics Industry Volume K Unit Forecast, by Application 2020 & 2033
- Table 7: Global RNA Analytics Industry Revenue billion Forecast, by End User 2020 & 2033
- Table 8: Global RNA Analytics Industry Volume K Unit Forecast, by End User 2020 & 2033
- Table 9: Global RNA Analytics Industry Revenue billion Forecast, by Region 2020 & 2033
- Table 10: Global RNA Analytics Industry Volume K Unit Forecast, by Region 2020 & 2033
- Table 11: Global RNA Analytics Industry Revenue billion Forecast, by Product Type 2020 & 2033
- Table 12: Global RNA Analytics Industry Volume K Unit Forecast, by Product Type 2020 & 2033
- Table 13: Global RNA Analytics Industry Revenue billion Forecast, by Technology 2020 & 2033
- Table 14: Global RNA Analytics Industry Volume K Unit Forecast, by Technology 2020 & 2033
- Table 15: Global RNA Analytics Industry Revenue billion Forecast, by Application 2020 & 2033
- Table 16: Global RNA Analytics Industry Volume K Unit Forecast, by Application 2020 & 2033
- Table 17: Global RNA Analytics Industry Revenue billion Forecast, by End User 2020 & 2033
- Table 18: Global RNA Analytics Industry Volume K Unit Forecast, by End User 2020 & 2033
- Table 19: Global RNA Analytics Industry Revenue billion Forecast, by Country 2020 & 2033
- Table 20: Global RNA Analytics Industry Volume K Unit Forecast, by Country 2020 & 2033
- Table 21: United States RNA Analytics Industry Revenue (billion) Forecast, by Application 2020 & 2033
- Table 22: United States RNA Analytics Industry Volume (K Unit) Forecast, by Application 2020 & 2033
- Table 23: Canada RNA Analytics Industry Revenue (billion) Forecast, by Application 2020 & 2033
- Table 24: Canada RNA Analytics Industry Volume (K Unit) Forecast, by Application 2020 & 2033
- Table 25: Mexico RNA Analytics Industry Revenue (billion) Forecast, by Application 2020 & 2033
- Table 26: Mexico RNA Analytics Industry Volume (K Unit) Forecast, by Application 2020 & 2033
- Table 27: Global RNA Analytics Industry Revenue billion Forecast, by Product Type 2020 & 2033
- Table 28: Global RNA Analytics Industry Volume K Unit Forecast, by Product Type 2020 & 2033
- Table 29: Global RNA Analytics Industry Revenue billion Forecast, by Technology 2020 & 2033
- Table 30: Global RNA Analytics Industry Volume K Unit Forecast, by Technology 2020 & 2033
- Table 31: Global RNA Analytics Industry Revenue billion Forecast, by Application 2020 & 2033
- Table 32: Global RNA Analytics Industry Volume K Unit Forecast, by Application 2020 & 2033
- Table 33: Global RNA Analytics Industry Revenue billion Forecast, by End User 2020 & 2033
- Table 34: Global RNA Analytics Industry Volume K Unit Forecast, by End User 2020 & 2033
- Table 35: Global RNA Analytics Industry Revenue billion Forecast, by Country 2020 & 2033
- Table 36: Global RNA Analytics Industry Volume K Unit Forecast, by Country 2020 & 2033
- Table 37: Germany RNA Analytics Industry Revenue (billion) Forecast, by Application 2020 & 2033
- Table 38: Germany RNA Analytics Industry Volume (K Unit) Forecast, by Application 2020 & 2033
- Table 39: United Kingdom RNA Analytics Industry Revenue (billion) Forecast, by Application 2020 & 2033
- Table 40: United Kingdom RNA Analytics Industry Volume (K Unit) Forecast, by Application 2020 & 2033
- Table 41: France RNA Analytics Industry Revenue (billion) Forecast, by Application 2020 & 2033
- Table 42: France RNA Analytics Industry Volume (K Unit) Forecast, by Application 2020 & 2033
- Table 43: Italy RNA Analytics Industry Revenue (billion) Forecast, by Application 2020 & 2033
- Table 44: Italy RNA Analytics Industry Volume (K Unit) Forecast, by Application 2020 & 2033
- Table 45: Spain RNA Analytics Industry Revenue (billion) Forecast, by Application 2020 & 2033
- Table 46: Spain RNA Analytics Industry Volume (K Unit) Forecast, by Application 2020 & 2033
- Table 47: Rest of Europe RNA Analytics Industry Revenue (billion) Forecast, by Application 2020 & 2033
- Table 48: Rest of Europe RNA Analytics Industry Volume (K Unit) Forecast, by Application 2020 & 2033
- Table 49: Global RNA Analytics Industry Revenue billion Forecast, by Product Type 2020 & 2033
- Table 50: Global RNA Analytics Industry Volume K Unit Forecast, by Product Type 2020 & 2033
- Table 51: Global RNA Analytics Industry Revenue billion Forecast, by Technology 2020 & 2033
- Table 52: Global RNA Analytics Industry Volume K Unit Forecast, by Technology 2020 & 2033
- Table 53: Global RNA Analytics Industry Revenue billion Forecast, by Application 2020 & 2033
- Table 54: Global RNA Analytics Industry Volume K Unit Forecast, by Application 2020 & 2033
- Table 55: Global RNA Analytics Industry Revenue billion Forecast, by End User 2020 & 2033
- Table 56: Global RNA Analytics Industry Volume K Unit Forecast, by End User 2020 & 2033
- Table 57: Global RNA Analytics Industry Revenue billion Forecast, by Country 2020 & 2033
- Table 58: Global RNA Analytics Industry Volume K Unit Forecast, by Country 2020 & 2033
- Table 59: China RNA Analytics Industry Revenue (billion) Forecast, by Application 2020 & 2033
- Table 60: China RNA Analytics Industry Volume (K Unit) Forecast, by Application 2020 & 2033
- Table 61: Japan RNA Analytics Industry Revenue (billion) Forecast, by Application 2020 & 2033
- Table 62: Japan RNA Analytics Industry Volume (K Unit) Forecast, by Application 2020 & 2033
- Table 63: India RNA Analytics Industry Revenue (billion) Forecast, by Application 2020 & 2033
- Table 64: India RNA Analytics Industry Volume (K Unit) Forecast, by Application 2020 & 2033
- Table 65: Australia RNA Analytics Industry Revenue (billion) Forecast, by Application 2020 & 2033
- Table 66: Australia RNA Analytics Industry Volume (K Unit) Forecast, by Application 2020 & 2033
- Table 67: South Korea RNA Analytics Industry Revenue (billion) Forecast, by Application 2020 & 2033
- Table 68: South Korea RNA Analytics Industry Volume (K Unit) Forecast, by Application 2020 & 2033
- Table 69: Rest of Asia Pacific RNA Analytics Industry Revenue (billion) Forecast, by Application 2020 & 2033
- Table 70: Rest of Asia Pacific RNA Analytics Industry Volume (K Unit) Forecast, by Application 2020 & 2033
- Table 71: Global RNA Analytics Industry Revenue billion Forecast, by Product Type 2020 & 2033
- Table 72: Global RNA Analytics Industry Volume K Unit Forecast, by Product Type 2020 & 2033
- Table 73: Global RNA Analytics Industry Revenue billion Forecast, by Technology 2020 & 2033
- Table 74: Global RNA Analytics Industry Volume K Unit Forecast, by Technology 2020 & 2033
- Table 75: Global RNA Analytics Industry Revenue billion Forecast, by Application 2020 & 2033
- Table 76: Global RNA Analytics Industry Volume K Unit Forecast, by Application 2020 & 2033
- Table 77: Global RNA Analytics Industry Revenue billion Forecast, by End User 2020 & 2033
- Table 78: Global RNA Analytics Industry Volume K Unit Forecast, by End User 2020 & 2033
- Table 79: Global RNA Analytics Industry Revenue billion Forecast, by Country 2020 & 2033
- Table 80: Global RNA Analytics Industry Volume K Unit Forecast, by Country 2020 & 2033
- Table 81: GCC RNA Analytics Industry Revenue (billion) Forecast, by Application 2020 & 2033
- Table 82: GCC RNA Analytics Industry Volume (K Unit) Forecast, by Application 2020 & 2033
- Table 83: South Africa RNA Analytics Industry Revenue (billion) Forecast, by Application 2020 & 2033
- Table 84: South Africa RNA Analytics Industry Volume (K Unit) Forecast, by Application 2020 & 2033
- Table 85: Rest of Middle East and Africa RNA Analytics Industry Revenue (billion) Forecast, by Application 2020 & 2033
- Table 86: Rest of Middle East and Africa RNA Analytics Industry Volume (K Unit) Forecast, by Application 2020 & 2033
- Table 87: Global RNA Analytics Industry Revenue billion Forecast, by Product Type 2020 & 2033
- Table 88: Global RNA Analytics Industry Volume K Unit Forecast, by Product Type 2020 & 2033
- Table 89: Global RNA Analytics Industry Revenue billion Forecast, by Technology 2020 & 2033
- Table 90: Global RNA Analytics Industry Volume K Unit Forecast, by Technology 2020 & 2033
- Table 91: Global RNA Analytics Industry Revenue billion Forecast, by Application 2020 & 2033
- Table 92: Global RNA Analytics Industry Volume K Unit Forecast, by Application 2020 & 2033
- Table 93: Global RNA Analytics Industry Revenue billion Forecast, by End User 2020 & 2033
- Table 94: Global RNA Analytics Industry Volume K Unit Forecast, by End User 2020 & 2033
- Table 95: Global RNA Analytics Industry Revenue billion Forecast, by Country 2020 & 2033
- Table 96: Global RNA Analytics Industry Volume K Unit Forecast, by Country 2020 & 2033
- Table 97: Brazil RNA Analytics Industry Revenue (billion) Forecast, by Application 2020 & 2033
- Table 98: Brazil RNA Analytics Industry Volume (K Unit) Forecast, by Application 2020 & 2033
- Table 99: Argentina RNA Analytics Industry Revenue (billion) Forecast, by Application 2020 & 2033
- Table 100: Argentina RNA Analytics Industry Volume (K Unit) Forecast, by Application 2020 & 2033
- Table 101: Rest of South America RNA Analytics Industry Revenue (billion) Forecast, by Application 2020 & 2033
- Table 102: Rest of South America RNA Analytics Industry Volume (K Unit) Forecast, by Application 2020 & 2033
Frequently Asked Questions
1. What is the projected Compound Annual Growth Rate (CAGR) of the RNA Analytics Industry?
The projected CAGR is approximately 17.1%.
2. Which companies are prominent players in the RNA Analytics Industry?
Key companies in the market include IlluminaInc, Promega Corporation, Bio-Rad Laboratories Inc, Merck KGaA, F Hoffmann-La Roche Ltd, Eurofins Scientific, Agilent Technologies Inc, LC Sciences, GenXPro GmbH, BioMérieux SA, Thermo Fisher Scientific, QIAGEN.
3. What are the main segments of the RNA Analytics Industry?
The market segments include Product Type, Technology, Application, End User.
4. Can you provide details about the market size?
The market size is estimated to be USD 8.8 billion as of 2022.
5. What are some drivers contributing to market growth?
Rising RNA Analysis in Cancer Personalized or Precision Medicine; Growing Applications of RNA Sequencing in Transcriptomics.
6. What are the notable trends driving market growth?
Reagents/Consumables Segment is Expected to Hold a Significant Share.
7. Are there any restraints impacting market growth?
High Cost Associated With Platforms; High Capital Investments for Research and Development.
8. Can you provide examples of recent developments in the market?
June 2022: Bio-Rad Laboratories, Inc. launched the SEQuoia Express Stranded RNA Library Prep Kit. The kit provides biopharmaceutical and research scientists with an easy-to-use solution for constructing robust libraries to support efficient RNA-Sequencing workflows for comprehensive transcriptome profiling.
9. What pricing options are available for accessing the report?
Pricing options include single-user, multi-user, and enterprise licenses priced at USD 4750, USD 5250, and USD 8750 respectively.
10. Is the market size provided in terms of value or volume?
The market size is provided in terms of value, measured in billion and volume, measured in K Unit.
11. Are there any specific market keywords associated with the report?
Yes, the market keyword associated with the report is "RNA Analytics Industry," which aids in identifying and referencing the specific market segment covered.
12. How do I determine which pricing option suits my needs best?
The pricing options vary based on user requirements and access needs. Individual users may opt for single-user licenses, while businesses requiring broader access may choose multi-user or enterprise licenses for cost-effective access to the report.
13. Are there any additional resources or data provided in the RNA Analytics Industry report?
While the report offers comprehensive insights, it's advisable to review the specific contents or supplementary materials provided to ascertain if additional resources or data are available.
14. How can I stay updated on further developments or reports in the RNA Analytics Industry?
To stay informed about further developments, trends, and reports in the RNA Analytics Industry, consider subscribing to industry newsletters, following relevant companies and organizations, or regularly checking reputable industry news sources and publications.
Methodology
Step 1 - Identification of Relevant Samples Size from Population Database


Step 2 - Approaches for Defining Global Market Size (Value, Volume* & Price*)

Note*: In applicable scenarios
Step 3 - Data Sources
Primary Research
- Web Analytics
- Survey Reports
- Research Institute
- Latest Research Reports
- Opinion Leaders
Secondary Research
- Annual Reports
- White Paper
- Latest Press Release
- Industry Association
- Paid Database
- Investor Presentations

Step 4 - Data Triangulation
Involves using different sources of information in order to increase the validity of a study
These sources are likely to be stakeholders in a program - participants, other researchers, program staff, other community members, and so on.
Then we put all data in single framework & apply various statistical tools to find out the dynamic on the market.
During the analysis stage, feedback from the stakeholder groups would be compared to determine areas of agreement as well as areas of divergence