

Key Insights
The global Serological Transplant Diagnostics market is poised for significant expansion, projected to reach USD 15.6 billion in 2025, driven by an impressive Compound Annual Growth Rate (CAGR) of 11.96%. This robust growth is underpinned by a confluence of factors, including the increasing prevalence of organ failure necessitating transplantation, advancements in serological testing methodologies, and a growing global awareness of organ donation and transplantation programs. The rising incidence of chronic diseases like diabetes and hypertension, which often lead to organ damage and the need for transplants, further fuels this demand. Moreover, the continuous development of more accurate and rapid diagnostic tools, coupled with supportive government initiatives and increased healthcare spending worldwide, are key contributors to the market's upward trajectory. The integration of sophisticated technologies like next-generation sequencing and automation in serological testing is enhancing efficiency and accuracy, thereby accelerating market penetration across various applications such as hospitals, blood banks, and research laboratories.
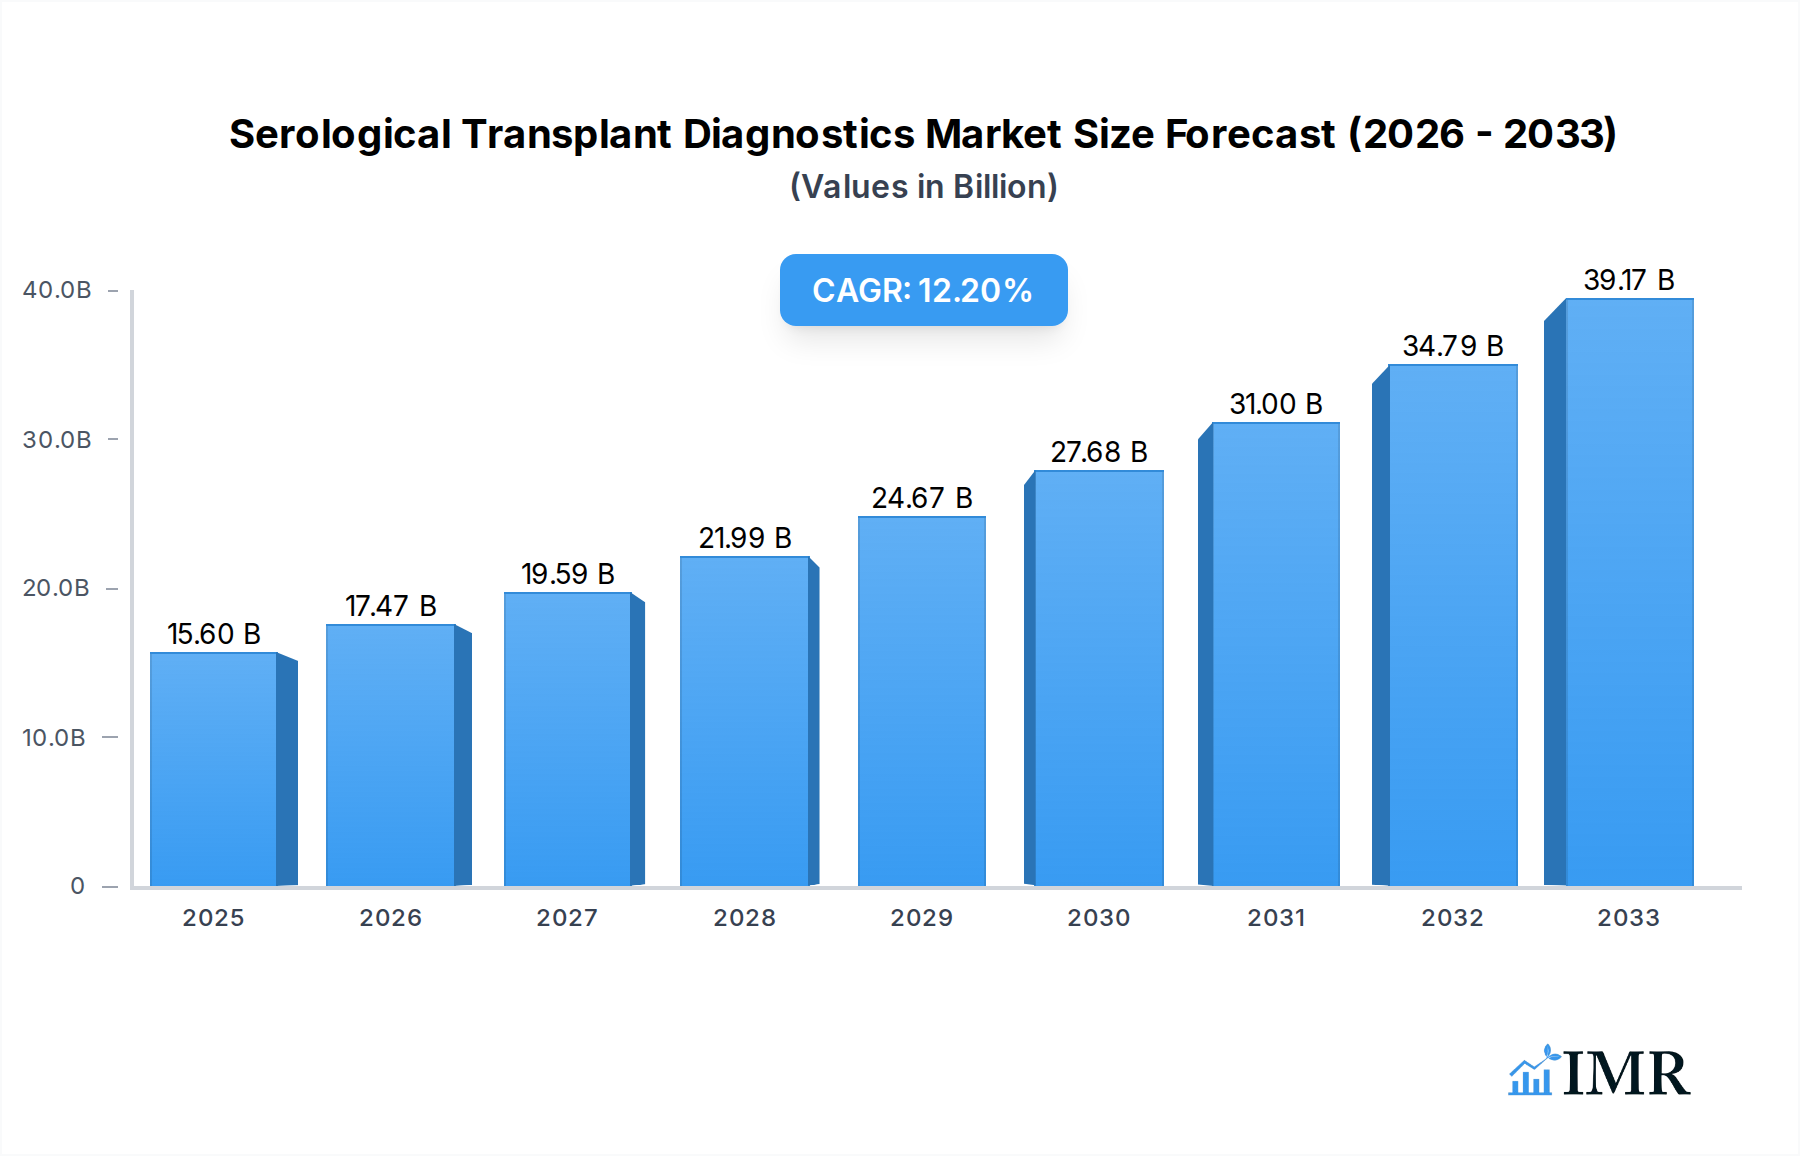
Serological Transplant Diagnostics Market Size (In Billion)
The market segmentation reveals a diverse landscape with significant opportunities across different transplant types and applications. Kidney and liver transplantations represent the largest segments due to their higher frequency, while advancements in technology are also driving growth in heart, lung, and pancreas transplant diagnostics. Geographically, North America and Europe currently dominate the market, owing to well-established healthcare infrastructures, high adoption rates of advanced diagnostics, and substantial investments in research and development. However, the Asia Pacific region is emerging as a high-growth market, fueled by a large and aging population, increasing healthcare expenditure, and a growing number of organ transplant procedures. Key players such as Bio-Rad Laboratories, Immucor, and Siemens Healthineers are actively involved in research and development, strategic collaborations, and product innovation to capture market share and address unmet needs in this dynamic sector. The market is also experiencing a trend towards personalized medicine, with a focus on developing more specific and sensitive serological markers for better patient outcomes and reduced transplant rejection rates.

Serological Transplant Diagnostics Company Market Share
Serological Transplant Diagnostics Market Dynamics & Structure
The serological transplant diagnostics market is characterized by a moderate to high concentration, with key players like Bio-Rad Laboratories, Immucor, Siemens Healthineers, Ortho Clinical Diagnostics, and Thermo Fisher Scientific holding significant influence. Technological innovation is a primary driver, with continuous advancements in serological assays, including next-generation sequencing (NGS) for HLA typing and advanced immunoassay platforms, enhancing sensitivity, specificity, and turnaround times. Regulatory frameworks, primarily driven by bodies like the FDA and EMA, are crucial in ensuring the safety and efficacy of these diagnostic tools, thereby impacting market entry and product development. Competitive product substitutes, though limited in direct serological replacement, can emerge from alternative diagnostic methodologies or advancements in non-serological donor matching techniques. End-user demographics are increasingly influenced by the rising prevalence of organ failure and the growing demand for transplants globally. Merger and acquisition (M&A) trends, while present, are selective, often focusing on acquiring niche technologies or expanding geographical reach rather than broad consolidation.
- Market Concentration: Dominated by a few major players, but with growing influence of specialized companies.
- Technological Innovation Drivers: High-throughput screening, automation, AI integration, and multiplex assays for improved HLA matching.
- Regulatory Frameworks: Strict guidelines for performance, validation, and post-market surveillance by global health authorities.
- Competitive Product Substitutes: Emerging non-serological methods and advancements in predictive modeling.
- End-User Demographics: Aging populations, increasing chronic diseases, and expanding organ transplant programs.
- M&A Trends: Strategic acquisitions for technology integration and market access.
Serological Transplant Diagnostics Growth Trends & Insights
The global serological transplant diagnostics market is poised for substantial growth, projected to reach approximately $10.5 billion by 2033, exhibiting a robust Compound Annual Growth Rate (CAGR) of 8.9% during the forecast period of 2025-2033. This expansion is fueled by a confluence of factors, including the increasing incidence of end-stage organ failure, advancements in transplant surgery, and a growing emphasis on pre-transplant serological testing for donor-recipient compatibility. The base year of 2025 sees the market valued at an estimated $5.2 billion, reflecting a steady upward trajectory from historical performance.
Adoption rates for advanced serological diagnostics, such as high-resolution HLA typing and antibody screening, are accelerating as transplant centers globally recognize their critical role in minimizing transplant rejection and improving patient outcomes. Technological disruptions are predominantly centered around the integration of automation and artificial intelligence (AI) into laboratory workflows, enhancing efficiency and accuracy. Furthermore, the development of more sensitive and specific assays for identifying pre-formed antibodies continues to be a key area of innovation.
Consumer behavior shifts are evident in the increasing demand for personalized medicine approaches within transplantation, where serological diagnostics play a pivotal role in tailoring treatment strategies. Patients and healthcare providers are increasingly prioritizing diagnostic solutions that offer comprehensive immunological profiling of both donors and recipients. The market penetration of advanced serological testing is expected to deepen, moving beyond traditional HLA typing to include broader antibody profiling and crossmatch technologies. The projected market size of $10.5 billion by 2033 signifies a significant expansion from the estimated $5.2 billion in 2025, underscoring the market's dynamic evolution. This growth is not merely quantitative; it reflects a qualitative shift towards more sophisticated and predictive diagnostic tools that are integral to successful organ transplantation. The historical period of 2019-2024 has laid the groundwork for this accelerated growth, characterized by steady technological advancements and increasing global transplant volumes.
Dominant Regions, Countries, or Segments in Serological Transplant Diagnostics
North America currently stands as the dominant region in the serological transplant diagnostics market, projected to maintain its leadership throughout the forecast period due to a combination of robust healthcare infrastructure, high transplant volumes, and significant investment in research and development. The United States, in particular, is a key contributor, driven by a high prevalence of organ failure, a well-established transplant network, and advanced diagnostic laboratories.
Within the application segment, Hospitals, Blood Banks and Transplant Centers collectively represent the largest and fastest-growing segment. These entities are at the forefront of organ procurement, recipient evaluation, and post-transplant patient management, making them primary consumers of serological transplant diagnostics. The increasing complexity of patient populations and the drive to improve graft survival rates necessitate comprehensive serological testing within these settings.
In terms of transplant types, Kidney Transplantation consistently leads the market. This is attributed to the widespread demand for kidney transplants, driven by the high incidence of kidney disease. However, the market share for Liver Transplantation is also substantial and growing, reflecting advancements in surgical techniques and improved patient selection criteria. The growth in Heart Transplantation and Lung Transplantation is also notable, albeit from a smaller base, as these procedures become more accessible and successful.
- North America's Dominance: Supported by advanced healthcare systems and high transplant rates.
- Application Segment Dominance: Hospitals, Blood Banks and Transplant Centers are crucial for demand.
- Application Segment Growth Drivers: Increasing patient complexity, focus on graft survival, and efficient workflow automation.
- Transplant Type Dominance: Kidney transplantation leads due to high prevalence of kidney disease.
- Transplant Type Growth Potential: Liver, Heart, and Lung transplant segments show significant upward trends.
- Key Drivers of Dominance:
- Economic Policies: Favorable reimbursement policies and government funding for transplant research and patient care.
- Infrastructure: Well-developed transplant centers with cutting-edge laboratory facilities.
- Technological Adoption: Early and widespread adoption of advanced serological diagnostic technologies.
- Regulatory Support: Streamlined regulatory pathways for diagnostic device approvals.
- Market Share: North America holding an estimated 45% market share in 2025, projected to remain above 40% by 2033.
- Growth Potential: Asia-Pacific is expected to exhibit the highest CAGR, driven by increasing healthcare expenditure and growing transplant programs.
Serological Transplant Diagnostics Product Landscape
The serological transplant diagnostics product landscape is evolving rapidly, with a strong emphasis on enhancing the accuracy, speed, and comprehensiveness of donor-recipient compatibility assessments. Key innovations include the development of high-resolution HLA typing kits utilizing next-generation sequencing (NGS) and the introduction of highly sensitive solid-phase immunoassays for detecting a broad spectrum of clinically relevant antibodies. These advanced kits offer superior specificity and the ability to identify low-frequency alleles, crucial for minimizing transplant rejection. Furthermore, the integration of automation and digital solutions within diagnostic platforms streamlines laboratory workflows, reducing turnaround times and improving overall efficiency. Performance metrics such as improved sensitivity, reduced false positive/negative rates, and enhanced throughput are defining unique selling propositions for leading products.
Key Drivers, Barriers & Challenges in Serological Transplant Diagnostics
The serological transplant diagnostics market is propelled by several key drivers, including the escalating incidence of organ failure, advancements in immunosuppressive therapies that necessitate precise pre-transplant immunological assessments, and the continuous technological innovation in HLA typing and antibody detection. Growing global awareness of the benefits of organ transplantation and increasing healthcare expenditure in emerging economies also contribute significantly to market expansion.
However, the market faces notable barriers and challenges. The high cost of advanced diagnostic equipment and reagents can be a significant restraint, particularly in resource-limited settings. Stringent regulatory approval processes for new diagnostic technologies can also lead to prolonged market entry times. Furthermore, a shortage of skilled laboratory professionals trained in complex serological techniques poses a challenge to widespread adoption. Supply chain disruptions for critical reagents and consumables, as witnessed during recent global events, can impact product availability and increase operational costs. Competitive pressures from alternative diagnostic modalities, while not directly replacing serological testing, can influence market dynamics.
Emerging Opportunities in Serological Transplant Diagnostics
Emerging opportunities in serological transplant diagnostics lie in the development of more personalized and predictive testing platforms. This includes leveraging AI and machine learning to interpret complex antibody profiles and predict individual patient risks of rejection. The untapped market potential in developing nations, where transplant programs are expanding but diagnostic infrastructure is still maturing, presents a significant growth avenue. Furthermore, innovative applications such as monitoring for de novo antibody formation post-transplant using liquid biopsy techniques and developing point-of-care serological testing solutions for rapid donor suitability assessments are areas ripe for exploration and commercialization.
Growth Accelerators in the Serological Transplant Diagnostics Industry
Growth accelerators in the serological transplant diagnostics industry are primarily driven by technological breakthroughs, strategic partnerships, and market expansion initiatives. The increasing integration of next-generation sequencing (NGS) for high-resolution HLA typing and the development of multiplex assays capable of simultaneously detecting multiple biomarkers are revolutionizing the field. Strategic collaborations between diagnostic companies and academic research institutions are fostering innovation and accelerating the translation of novel discoveries into clinical applications. Furthermore, market expansion strategies focusing on emerging economies, where the demand for organ transplantation is rising, coupled with the establishment of robust distribution networks, are significant catalysts for long-term growth.
Key Players Shaping the Serological Transplant Diagnostics Market
- Bio-Rad Laboratories
- Immucor
- Siemens Healthineers
- Ortho Clinical Diagnostics
- Thermo Fisher Scientific
- Agena Bioscience
- AVIOQ
- BAG Healthcare
- BD
- Beckman Coulter
- Biogenuix
- DIAGAST
- Grifols
- Hemo bioscience
- Institut de Biotechnologies
- Lorne Laboratories
- MTC Invitro
- Quotient Biodiagnostics
- Tulip Group
Notable Milestones in Serological Transplant Diagnostics Sector
- 2019: Introduction of enhanced high-resolution HLA typing kits utilizing NGS technology by Thermo Fisher Scientific, improving allele-level resolution.
- 2020: Siemens Healthineers launches a new automated immunoassay analyzer specifically designed for transplant diagnostics, significantly reducing turnaround times.
- 2021: Immucor acquires a specialized antibody detection technology, expanding its portfolio for complex crossmatch testing.
- 2022: Ortho Clinical Diagnostics introduces a novel bead-based assay for the detection of donor-specific antibodies (DSAs), enhancing graft survival prediction.
- 2023: Agena Bioscience partners with a leading research institution to develop AI-driven predictive algorithms for transplant rejection based on serological data.
- 2024: Bio-Rad Laboratories receives regulatory approval for its expanded Luminex® serological testing platform, enabling comprehensive antibody profiling.
In-Depth Serological Transplant Diagnostics Market Outlook
The future outlook for the serological transplant diagnostics market is exceptionally promising, driven by a sustained wave of innovation and increasing global demand for organ transplantation. Growth accelerators such as the widespread adoption of advanced sequencing technologies for precise HLA matching, the development of highly sensitive multiplex assays for comprehensive antibody profiling, and the integration of artificial intelligence for predictive analytics will continue to shape the market. Strategic partnerships between established diagnostic leaders and innovative biotech firms, coupled with the expansion of transplant programs in emerging economies, will further fuel market penetration. The market is poised for significant growth, projected to reach over $10.5 billion by 2033, offering substantial opportunities for stakeholders to contribute to improved patient outcomes and advance the field of organ transplantation.
Serological Transplant Diagnostics Segmentation
-
1. Application
- 1.1. Hospitals, Blood Banks and Transplant Centers
- 1.2. Donor Registries and Research Laboratories
-
2. Type
- 2.1. Kidney Transplantation
- 2.2. Liver Transplantation
- 2.3. Heart Transplantation
- 2.4. Lung Transplantation
- 2.5. Pancreas Transplantation
Serological Transplant Diagnostics Segmentation By Geography
-
1. North America
- 1.1. United States
- 1.2. Canada
- 1.3. Mexico
-
2. South America
- 2.1. Brazil
- 2.2. Argentina
- 2.3. Rest of South America
-
3. Europe
- 3.1. United Kingdom
- 3.2. Germany
- 3.3. France
- 3.4. Italy
- 3.5. Spain
- 3.6. Russia
- 3.7. Benelux
- 3.8. Nordics
- 3.9. Rest of Europe
-
4. Middle East & Africa
- 4.1. Turkey
- 4.2. Israel
- 4.3. GCC
- 4.4. North Africa
- 4.5. South Africa
- 4.6. Rest of Middle East & Africa
-
5. Asia Pacific
- 5.1. China
- 5.2. India
- 5.3. Japan
- 5.4. South Korea
- 5.5. ASEAN
- 5.6. Oceania
- 5.7. Rest of Asia Pacific
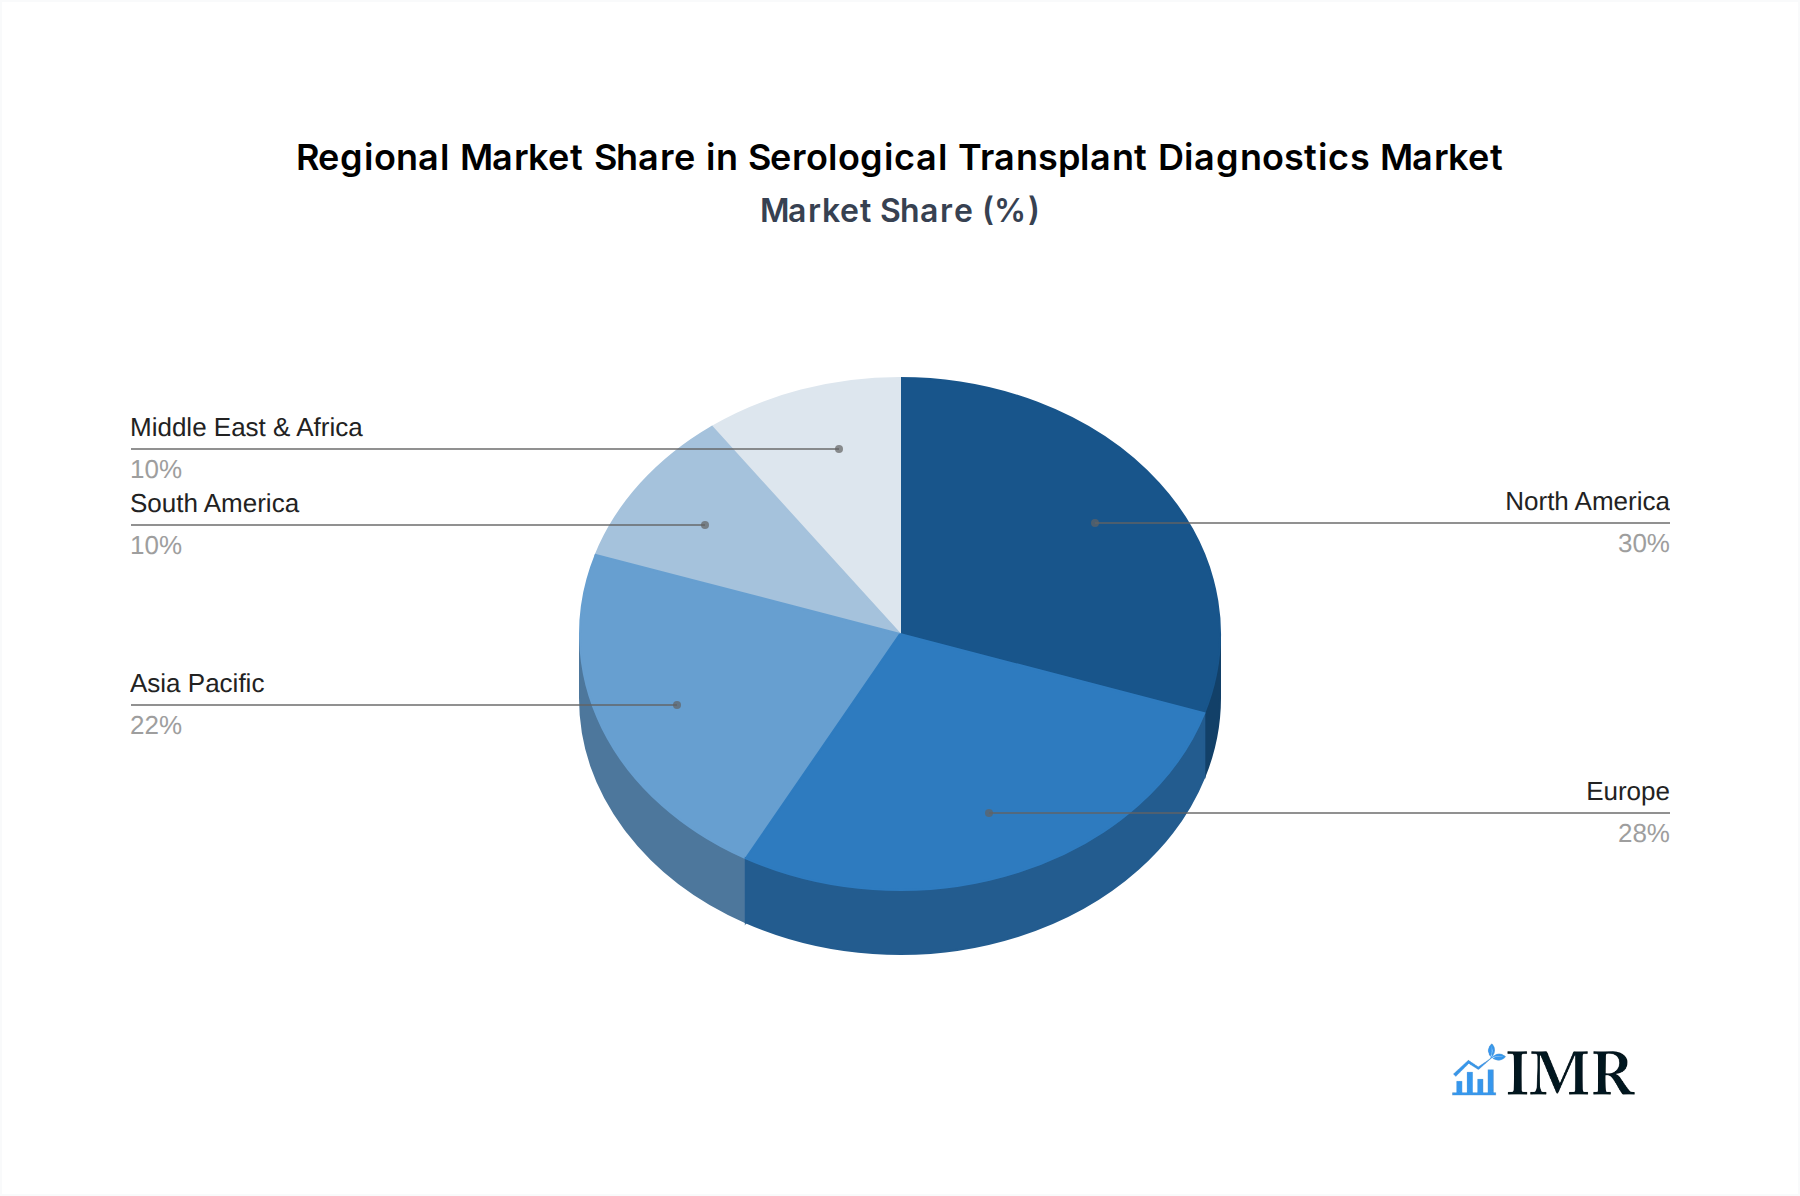
Serological Transplant Diagnostics Regional Market Share
Geographic Coverage of Serological Transplant Diagnostics
Serological Transplant Diagnostics REPORT HIGHLIGHTS
| Aspects | Details |
|---|---|
| Study Period | 2020-2034 |
| Base Year | 2025 |
| Estimated Year | 2026 |
| Forecast Period | 2026-2034 |
| Historical Period | 2020-2025 |
| Growth Rate | CAGR of 11.96% from 2020-2034 |
| Segmentation |
|
Table of Contents
- 1. Introduction
- 1.1. Research Scope
- 1.2. Market Segmentation
- 1.3. Research Objective
- 1.4. Definitions and Assumptions
- 2. Executive Summary
- 2.1. Market Snapshot
- 3. Market Dynamics
- 3.1. Market Drivers
- 3.2. Market Restrains
- 3.3. Market Trends
- 3.4. Market Opportunities
- 4. Market Factor Analysis
- 4.1. Porters Five Forces
- 4.1.1. Bargaining Power of Suppliers
- 4.1.2. Bargaining Power of Buyers
- 4.1.3. Threat of New Entrants
- 4.1.4. Threat of Substitutes
- 4.1.5. Competitive Rivalry
- 4.2. PESTEL analysis
- 4.3. BCG Analysis
- 4.3.1. Stars (High Growth, High Market Share)
- 4.3.2. Cash Cows (Low Growth, High Market Share)
- 4.3.3. Question Mark (High Growth, Low Market Share)
- 4.3.4. Dogs (Low Growth, Low Market Share)
- 4.4. Ansoff Matrix Analysis
- 4.5. Supply Chain Analysis
- 4.6. Regulatory Landscape
- 4.7. Current Market Potential and Opportunity Assessment (TAM–SAM–SOM Framework)
- 4.8. IMR Analyst Note
- 4.1. Porters Five Forces
- 5. Market Analysis, Insights and Forecast 2021-2033
- 5.1. Market Analysis, Insights and Forecast - by Application
- 5.1.1. Hospitals, Blood Banks and Transplant Centers
- 5.1.2. Donor Registries and Research Laboratories
- 5.2. Market Analysis, Insights and Forecast - by Type
- 5.2.1. Kidney Transplantation
- 5.2.2. Liver Transplantation
- 5.2.3. Heart Transplantation
- 5.2.4. Lung Transplantation
- 5.2.5. Pancreas Transplantation
- 5.3. Market Analysis, Insights and Forecast - by Region
- 5.3.1. North America
- 5.3.2. South America
- 5.3.3. Europe
- 5.3.4. Middle East & Africa
- 5.3.5. Asia Pacific
- 5.1. Market Analysis, Insights and Forecast - by Application
- 6. Global Serological Transplant Diagnostics Analysis, Insights and Forecast, 2021-2033
- 6.1. Market Analysis, Insights and Forecast - by Application
- 6.1.1. Hospitals, Blood Banks and Transplant Centers
- 6.1.2. Donor Registries and Research Laboratories
- 6.2. Market Analysis, Insights and Forecast - by Type
- 6.2.1. Kidney Transplantation
- 6.2.2. Liver Transplantation
- 6.2.3. Heart Transplantation
- 6.2.4. Lung Transplantation
- 6.2.5. Pancreas Transplantation
- 6.1. Market Analysis, Insights and Forecast - by Application
- 7. North America Serological Transplant Diagnostics Analysis, Insights and Forecast, 2020-2032
- 7.1. Market Analysis, Insights and Forecast - by Application
- 7.1.1. Hospitals, Blood Banks and Transplant Centers
- 7.1.2. Donor Registries and Research Laboratories
- 7.2. Market Analysis, Insights and Forecast - by Type
- 7.2.1. Kidney Transplantation
- 7.2.2. Liver Transplantation
- 7.2.3. Heart Transplantation
- 7.2.4. Lung Transplantation
- 7.2.5. Pancreas Transplantation
- 7.1. Market Analysis, Insights and Forecast - by Application
- 8. South America Serological Transplant Diagnostics Analysis, Insights and Forecast, 2020-2032
- 8.1. Market Analysis, Insights and Forecast - by Application
- 8.1.1. Hospitals, Blood Banks and Transplant Centers
- 8.1.2. Donor Registries and Research Laboratories
- 8.2. Market Analysis, Insights and Forecast - by Type
- 8.2.1. Kidney Transplantation
- 8.2.2. Liver Transplantation
- 8.2.3. Heart Transplantation
- 8.2.4. Lung Transplantation
- 8.2.5. Pancreas Transplantation
- 8.1. Market Analysis, Insights and Forecast - by Application
- 9. Europe Serological Transplant Diagnostics Analysis, Insights and Forecast, 2020-2032
- 9.1. Market Analysis, Insights and Forecast - by Application
- 9.1.1. Hospitals, Blood Banks and Transplant Centers
- 9.1.2. Donor Registries and Research Laboratories
- 9.2. Market Analysis, Insights and Forecast - by Type
- 9.2.1. Kidney Transplantation
- 9.2.2. Liver Transplantation
- 9.2.3. Heart Transplantation
- 9.2.4. Lung Transplantation
- 9.2.5. Pancreas Transplantation
- 9.1. Market Analysis, Insights and Forecast - by Application
- 10. Middle East & Africa Serological Transplant Diagnostics Analysis, Insights and Forecast, 2020-2032
- 10.1. Market Analysis, Insights and Forecast - by Application
- 10.1.1. Hospitals, Blood Banks and Transplant Centers
- 10.1.2. Donor Registries and Research Laboratories
- 10.2. Market Analysis, Insights and Forecast - by Type
- 10.2.1. Kidney Transplantation
- 10.2.2. Liver Transplantation
- 10.2.3. Heart Transplantation
- 10.2.4. Lung Transplantation
- 10.2.5. Pancreas Transplantation
- 10.1. Market Analysis, Insights and Forecast - by Application
- 11. Asia Pacific Serological Transplant Diagnostics Analysis, Insights and Forecast, 2020-2032
- 11.1. Market Analysis, Insights and Forecast - by Application
- 11.1.1. Hospitals, Blood Banks and Transplant Centers
- 11.1.2. Donor Registries and Research Laboratories
- 11.2. Market Analysis, Insights and Forecast - by Type
- 11.2.1. Kidney Transplantation
- 11.2.2. Liver Transplantation
- 11.2.3. Heart Transplantation
- 11.2.4. Lung Transplantation
- 11.2.5. Pancreas Transplantation
- 11.1. Market Analysis, Insights and Forecast - by Application
- 12. Competitive Analysis
- 12.1. Company Profiles
- 12.1.1 Bio-Rad Laboratories
- 12.1.1.1. Company Overview
- 12.1.1.2. Products
- 12.1.1.3. Company Financials
- 12.1.1.4. SWOT Analysis
- 12.1.2 Immucor
- 12.1.2.1. Company Overview
- 12.1.2.2. Products
- 12.1.2.3. Company Financials
- 12.1.2.4. SWOT Analysis
- 12.1.3 Siemens Healthineers
- 12.1.3.1. Company Overview
- 12.1.3.2. Products
- 12.1.3.3. Company Financials
- 12.1.3.4. SWOT Analysis
- 12.1.4 Ortho Clinical Diagnostics
- 12.1.4.1. Company Overview
- 12.1.4.2. Products
- 12.1.4.3. Company Financials
- 12.1.4.4. SWOT Analysis
- 12.1.5 Thermo Fisher Scientific
- 12.1.5.1. Company Overview
- 12.1.5.2. Products
- 12.1.5.3. Company Financials
- 12.1.5.4. SWOT Analysis
- 12.1.6 Agena Bioscience
- 12.1.6.1. Company Overview
- 12.1.6.2. Products
- 12.1.6.3. Company Financials
- 12.1.6.4. SWOT Analysis
- 12.1.7 AVIOQ
- 12.1.7.1. Company Overview
- 12.1.7.2. Products
- 12.1.7.3. Company Financials
- 12.1.7.4. SWOT Analysis
- 12.1.8 BAG Healthcare
- 12.1.8.1. Company Overview
- 12.1.8.2. Products
- 12.1.8.3. Company Financials
- 12.1.8.4. SWOT Analysis
- 12.1.9 BD
- 12.1.9.1. Company Overview
- 12.1.9.2. Products
- 12.1.9.3. Company Financials
- 12.1.9.4. SWOT Analysis
- 12.1.10 Beckman Coulter
- 12.1.10.1. Company Overview
- 12.1.10.2. Products
- 12.1.10.3. Company Financials
- 12.1.10.4. SWOT Analysis
- 12.1.11 Biogenuix
- 12.1.11.1. Company Overview
- 12.1.11.2. Products
- 12.1.11.3. Company Financials
- 12.1.11.4. SWOT Analysis
- 12.1.12 DIAGAST
- 12.1.12.1. Company Overview
- 12.1.12.2. Products
- 12.1.12.3. Company Financials
- 12.1.12.4. SWOT Analysis
- 12.1.13 Grifols
- 12.1.13.1. Company Overview
- 12.1.13.2. Products
- 12.1.13.3. Company Financials
- 12.1.13.4. SWOT Analysis
- 12.1.14 Hemo bioscience
- 12.1.14.1. Company Overview
- 12.1.14.2. Products
- 12.1.14.3. Company Financials
- 12.1.14.4. SWOT Analysis
- 12.1.15 Institut de Biotechnologies
- 12.1.15.1. Company Overview
- 12.1.15.2. Products
- 12.1.15.3. Company Financials
- 12.1.15.4. SWOT Analysis
- 12.1.16 Lorne Laboratories
- 12.1.16.1. Company Overview
- 12.1.16.2. Products
- 12.1.16.3. Company Financials
- 12.1.16.4. SWOT Analysis
- 12.1.17 MTC Invitro
- 12.1.17.1. Company Overview
- 12.1.17.2. Products
- 12.1.17.3. Company Financials
- 12.1.17.4. SWOT Analysis
- 12.1.18 Quotient Biodiagnostics
- 12.1.18.1. Company Overview
- 12.1.18.2. Products
- 12.1.18.3. Company Financials
- 12.1.18.4. SWOT Analysis
- 12.1.19 Tulip Group
- 12.1.19.1. Company Overview
- 12.1.19.2. Products
- 12.1.19.3. Company Financials
- 12.1.19.4. SWOT Analysis
- 12.1.1 Bio-Rad Laboratories
- 12.2. Market Entropy
- 12.2.1 Company's Key Areas Served
- 12.2.2 Recent Developments
- 12.3. Company Market Share Analysis 2025
- 12.3.1 Top 5 Companies Market Share Analysis
- 12.3.2 Top 3 Companies Market Share Analysis
- 12.4. List of Potential Customers
- 13. Research Methodology
List of Figures
- Figure 1: Global Serological Transplant Diagnostics Revenue Breakdown (billion, %) by Region 2025 & 2033
- Figure 2: North America Serological Transplant Diagnostics Revenue (billion), by Application 2025 & 2033
- Figure 3: North America Serological Transplant Diagnostics Revenue Share (%), by Application 2025 & 2033
- Figure 4: North America Serological Transplant Diagnostics Revenue (billion), by Type 2025 & 2033
- Figure 5: North America Serological Transplant Diagnostics Revenue Share (%), by Type 2025 & 2033
- Figure 6: North America Serological Transplant Diagnostics Revenue (billion), by Country 2025 & 2033
- Figure 7: North America Serological Transplant Diagnostics Revenue Share (%), by Country 2025 & 2033
- Figure 8: South America Serological Transplant Diagnostics Revenue (billion), by Application 2025 & 2033
- Figure 9: South America Serological Transplant Diagnostics Revenue Share (%), by Application 2025 & 2033
- Figure 10: South America Serological Transplant Diagnostics Revenue (billion), by Type 2025 & 2033
- Figure 11: South America Serological Transplant Diagnostics Revenue Share (%), by Type 2025 & 2033
- Figure 12: South America Serological Transplant Diagnostics Revenue (billion), by Country 2025 & 2033
- Figure 13: South America Serological Transplant Diagnostics Revenue Share (%), by Country 2025 & 2033
- Figure 14: Europe Serological Transplant Diagnostics Revenue (billion), by Application 2025 & 2033
- Figure 15: Europe Serological Transplant Diagnostics Revenue Share (%), by Application 2025 & 2033
- Figure 16: Europe Serological Transplant Diagnostics Revenue (billion), by Type 2025 & 2033
- Figure 17: Europe Serological Transplant Diagnostics Revenue Share (%), by Type 2025 & 2033
- Figure 18: Europe Serological Transplant Diagnostics Revenue (billion), by Country 2025 & 2033
- Figure 19: Europe Serological Transplant Diagnostics Revenue Share (%), by Country 2025 & 2033
- Figure 20: Middle East & Africa Serological Transplant Diagnostics Revenue (billion), by Application 2025 & 2033
- Figure 21: Middle East & Africa Serological Transplant Diagnostics Revenue Share (%), by Application 2025 & 2033
- Figure 22: Middle East & Africa Serological Transplant Diagnostics Revenue (billion), by Type 2025 & 2033
- Figure 23: Middle East & Africa Serological Transplant Diagnostics Revenue Share (%), by Type 2025 & 2033
- Figure 24: Middle East & Africa Serological Transplant Diagnostics Revenue (billion), by Country 2025 & 2033
- Figure 25: Middle East & Africa Serological Transplant Diagnostics Revenue Share (%), by Country 2025 & 2033
- Figure 26: Asia Pacific Serological Transplant Diagnostics Revenue (billion), by Application 2025 & 2033
- Figure 27: Asia Pacific Serological Transplant Diagnostics Revenue Share (%), by Application 2025 & 2033
- Figure 28: Asia Pacific Serological Transplant Diagnostics Revenue (billion), by Type 2025 & 2033
- Figure 29: Asia Pacific Serological Transplant Diagnostics Revenue Share (%), by Type 2025 & 2033
- Figure 30: Asia Pacific Serological Transplant Diagnostics Revenue (billion), by Country 2025 & 2033
- Figure 31: Asia Pacific Serological Transplant Diagnostics Revenue Share (%), by Country 2025 & 2033
List of Tables
- Table 1: Global Serological Transplant Diagnostics Revenue billion Forecast, by Application 2020 & 2033
- Table 2: Global Serological Transplant Diagnostics Revenue billion Forecast, by Type 2020 & 2033
- Table 3: Global Serological Transplant Diagnostics Revenue billion Forecast, by Region 2020 & 2033
- Table 4: Global Serological Transplant Diagnostics Revenue billion Forecast, by Application 2020 & 2033
- Table 5: Global Serological Transplant Diagnostics Revenue billion Forecast, by Type 2020 & 2033
- Table 6: Global Serological Transplant Diagnostics Revenue billion Forecast, by Country 2020 & 2033
- Table 7: United States Serological Transplant Diagnostics Revenue (billion) Forecast, by Application 2020 & 2033
- Table 8: Canada Serological Transplant Diagnostics Revenue (billion) Forecast, by Application 2020 & 2033
- Table 9: Mexico Serological Transplant Diagnostics Revenue (billion) Forecast, by Application 2020 & 2033
- Table 10: Global Serological Transplant Diagnostics Revenue billion Forecast, by Application 2020 & 2033
- Table 11: Global Serological Transplant Diagnostics Revenue billion Forecast, by Type 2020 & 2033
- Table 12: Global Serological Transplant Diagnostics Revenue billion Forecast, by Country 2020 & 2033
- Table 13: Brazil Serological Transplant Diagnostics Revenue (billion) Forecast, by Application 2020 & 2033
- Table 14: Argentina Serological Transplant Diagnostics Revenue (billion) Forecast, by Application 2020 & 2033
- Table 15: Rest of South America Serological Transplant Diagnostics Revenue (billion) Forecast, by Application 2020 & 2033
- Table 16: Global Serological Transplant Diagnostics Revenue billion Forecast, by Application 2020 & 2033
- Table 17: Global Serological Transplant Diagnostics Revenue billion Forecast, by Type 2020 & 2033
- Table 18: Global Serological Transplant Diagnostics Revenue billion Forecast, by Country 2020 & 2033
- Table 19: United Kingdom Serological Transplant Diagnostics Revenue (billion) Forecast, by Application 2020 & 2033
- Table 20: Germany Serological Transplant Diagnostics Revenue (billion) Forecast, by Application 2020 & 2033
- Table 21: France Serological Transplant Diagnostics Revenue (billion) Forecast, by Application 2020 & 2033
- Table 22: Italy Serological Transplant Diagnostics Revenue (billion) Forecast, by Application 2020 & 2033
- Table 23: Spain Serological Transplant Diagnostics Revenue (billion) Forecast, by Application 2020 & 2033
- Table 24: Russia Serological Transplant Diagnostics Revenue (billion) Forecast, by Application 2020 & 2033
- Table 25: Benelux Serological Transplant Diagnostics Revenue (billion) Forecast, by Application 2020 & 2033
- Table 26: Nordics Serological Transplant Diagnostics Revenue (billion) Forecast, by Application 2020 & 2033
- Table 27: Rest of Europe Serological Transplant Diagnostics Revenue (billion) Forecast, by Application 2020 & 2033
- Table 28: Global Serological Transplant Diagnostics Revenue billion Forecast, by Application 2020 & 2033
- Table 29: Global Serological Transplant Diagnostics Revenue billion Forecast, by Type 2020 & 2033
- Table 30: Global Serological Transplant Diagnostics Revenue billion Forecast, by Country 2020 & 2033
- Table 31: Turkey Serological Transplant Diagnostics Revenue (billion) Forecast, by Application 2020 & 2033
- Table 32: Israel Serological Transplant Diagnostics Revenue (billion) Forecast, by Application 2020 & 2033
- Table 33: GCC Serological Transplant Diagnostics Revenue (billion) Forecast, by Application 2020 & 2033
- Table 34: North Africa Serological Transplant Diagnostics Revenue (billion) Forecast, by Application 2020 & 2033
- Table 35: South Africa Serological Transplant Diagnostics Revenue (billion) Forecast, by Application 2020 & 2033
- Table 36: Rest of Middle East & Africa Serological Transplant Diagnostics Revenue (billion) Forecast, by Application 2020 & 2033
- Table 37: Global Serological Transplant Diagnostics Revenue billion Forecast, by Application 2020 & 2033
- Table 38: Global Serological Transplant Diagnostics Revenue billion Forecast, by Type 2020 & 2033
- Table 39: Global Serological Transplant Diagnostics Revenue billion Forecast, by Country 2020 & 2033
- Table 40: China Serological Transplant Diagnostics Revenue (billion) Forecast, by Application 2020 & 2033
- Table 41: India Serological Transplant Diagnostics Revenue (billion) Forecast, by Application 2020 & 2033
- Table 42: Japan Serological Transplant Diagnostics Revenue (billion) Forecast, by Application 2020 & 2033
- Table 43: South Korea Serological Transplant Diagnostics Revenue (billion) Forecast, by Application 2020 & 2033
- Table 44: ASEAN Serological Transplant Diagnostics Revenue (billion) Forecast, by Application 2020 & 2033
- Table 45: Oceania Serological Transplant Diagnostics Revenue (billion) Forecast, by Application 2020 & 2033
- Table 46: Rest of Asia Pacific Serological Transplant Diagnostics Revenue (billion) Forecast, by Application 2020 & 2033
Frequently Asked Questions
1. What is the projected Compound Annual Growth Rate (CAGR) of the Serological Transplant Diagnostics?
The projected CAGR is approximately 11.96%.
2. Which companies are prominent players in the Serological Transplant Diagnostics?
Key companies in the market include Bio-Rad Laboratories, Immucor, Siemens Healthineers, Ortho Clinical Diagnostics, Thermo Fisher Scientific, Agena Bioscience, AVIOQ, BAG Healthcare, BD, Beckman Coulter, Biogenuix, DIAGAST, Grifols, Hemo bioscience, Institut de Biotechnologies, Lorne Laboratories, MTC Invitro, Quotient Biodiagnostics, Tulip Group.
3. What are the main segments of the Serological Transplant Diagnostics?
The market segments include Application, Type.
4. Can you provide details about the market size?
The market size is estimated to be USD 15.6 billion as of 2022.
5. What are some drivers contributing to market growth?
N/A
6. What are the notable trends driving market growth?
N/A
7. Are there any restraints impacting market growth?
N/A
8. Can you provide examples of recent developments in the market?
N/A
9. What pricing options are available for accessing the report?
Pricing options include single-user, multi-user, and enterprise licenses priced at USD 2900.00, USD 4350.00, and USD 5800.00 respectively.
10. Is the market size provided in terms of value or volume?
The market size is provided in terms of value, measured in billion.
11. Are there any specific market keywords associated with the report?
Yes, the market keyword associated with the report is "Serological Transplant Diagnostics," which aids in identifying and referencing the specific market segment covered.
12. How do I determine which pricing option suits my needs best?
The pricing options vary based on user requirements and access needs. Individual users may opt for single-user licenses, while businesses requiring broader access may choose multi-user or enterprise licenses for cost-effective access to the report.
13. Are there any additional resources or data provided in the Serological Transplant Diagnostics report?
While the report offers comprehensive insights, it's advisable to review the specific contents or supplementary materials provided to ascertain if additional resources or data are available.
14. How can I stay updated on further developments or reports in the Serological Transplant Diagnostics?
To stay informed about further developments, trends, and reports in the Serological Transplant Diagnostics, consider subscribing to industry newsletters, following relevant companies and organizations, or regularly checking reputable industry news sources and publications.
Methodology
Step 1 - Identification of Relevant Samples Size from Population Database


Step 2 - Approaches for Defining Global Market Size (Value, Volume* & Price*)

Note*: In applicable scenarios
Step 3 - Data Sources
Primary Research
- Web Analytics
- Survey Reports
- Research Institute
- Latest Research Reports
- Opinion Leaders
Secondary Research
- Annual Reports
- White Paper
- Latest Press Release
- Industry Association
- Paid Database
- Investor Presentations

Step 4 - Data Triangulation
Involves using different sources of information in order to increase the validity of a study
These sources are likely to be stakeholders in a program - participants, other researchers, program staff, other community members, and so on.
Then we put all data in single framework & apply various statistical tools to find out the dynamic on the market.
During the analysis stage, feedback from the stakeholder groups would be compared to determine areas of agreement as well as areas of divergence