

Key Insights
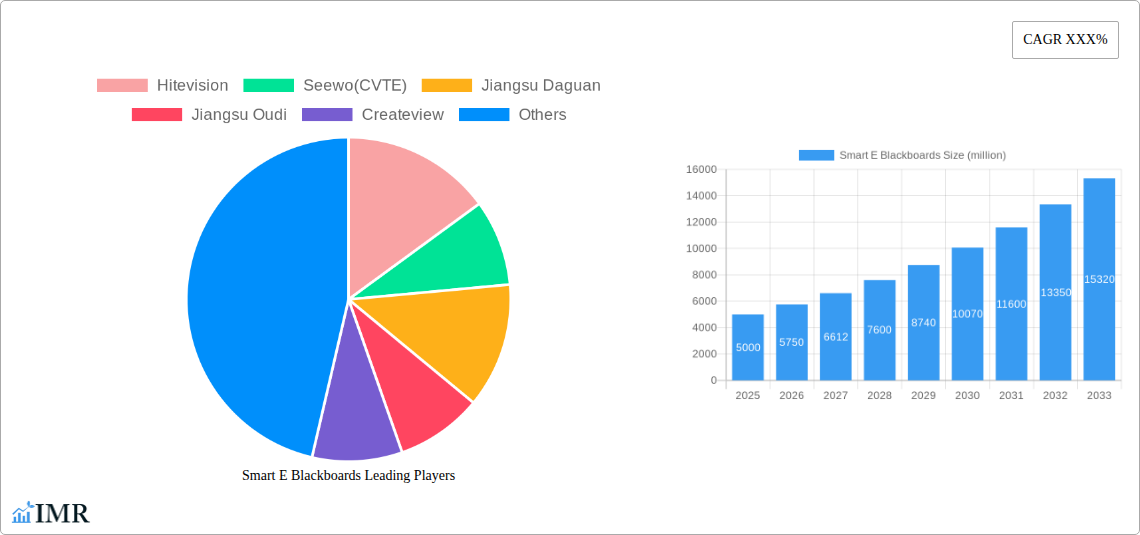
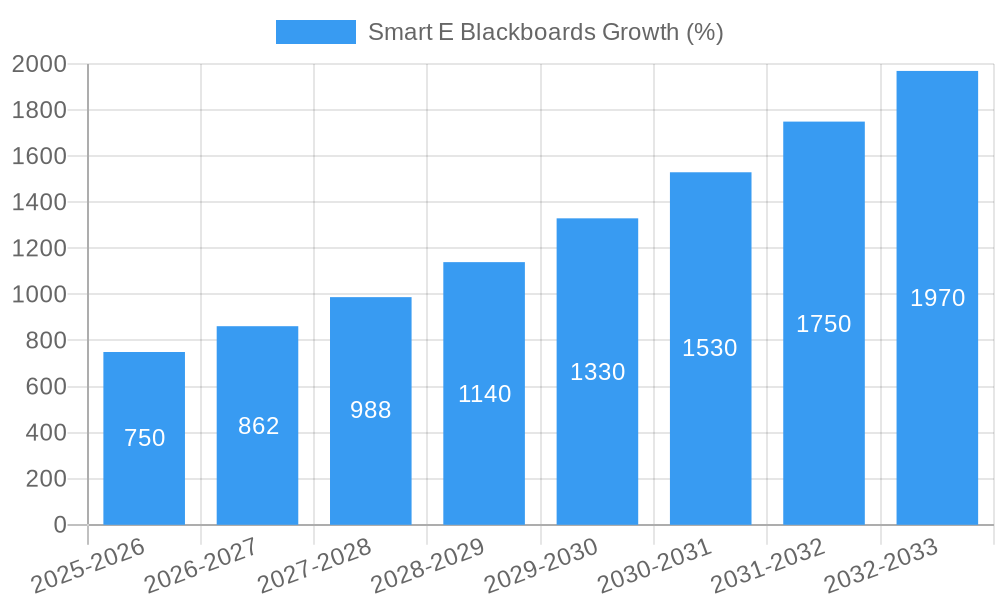
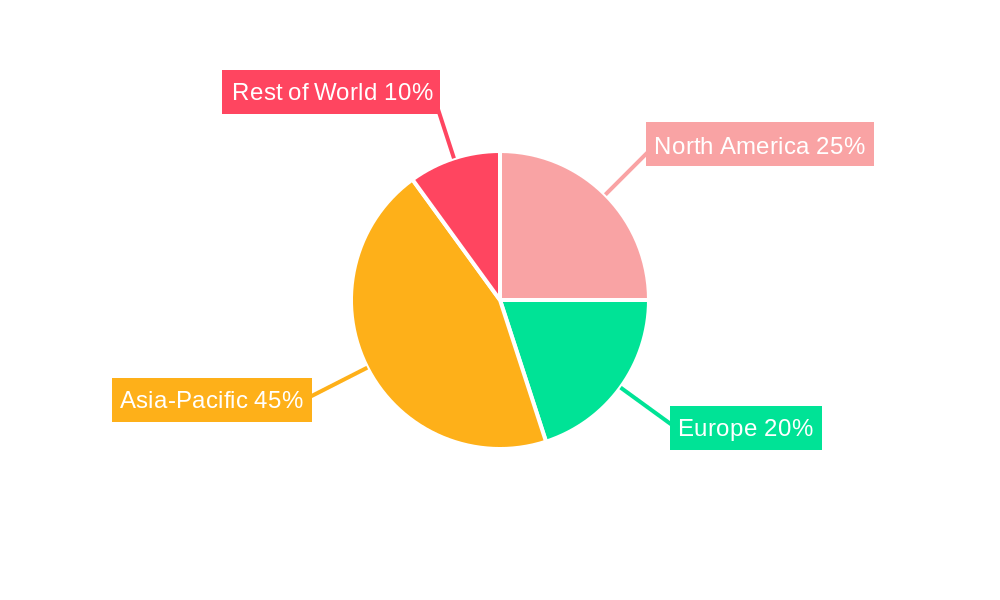
The global smart e-blackboard market is experiencing robust growth, driven by increasing digitalization in education and a rising demand for interactive learning solutions. The market, estimated at $5 billion in 2025, is projected to expand at a compound annual growth rate (CAGR) of 15% from 2025 to 2033, reaching approximately $15 billion by 2033. This growth is fueled by several key factors, including government initiatives promoting technological advancements in education, the rising adoption of BYOD (Bring Your Own Device) policies in schools, and the increasing preference for interactive and engaging learning experiences among students and educators. Furthermore, the integration of advanced features like touch-screen capabilities, cloud connectivity, and collaboration tools is significantly boosting market appeal. Key players like Hitevision, Seewo (CVTE), and Hikvision are leading the innovation drive, consistently introducing feature-rich products and expanding their market presence through strategic partnerships and distribution networks. The market is segmented by various factors including screen size, technology, and application (K-12, higher education, corporate training). The Asia-Pacific region is currently the largest market, while North America and Europe are expected to witness significant growth in the coming years.
Despite the promising outlook, the market faces certain challenges. High initial investment costs for schools and institutions can act as a restraint for wider adoption, particularly in developing economies. Furthermore, the need for robust IT infrastructure and ongoing maintenance can prove to be a hurdle. However, these challenges are being mitigated by the increasing availability of affordable financing options and the growing trend of cloud-based solutions that reduce the burden of on-site infrastructure management. The continued technological advancements, coupled with government support and innovative financing models, are expected to overcome these restraints and further propel the market towards sustained growth in the coming years.
Smart E Blackboards Market Report: 2019-2033
This comprehensive report provides an in-depth analysis of the global Smart E Blackboards market, encompassing market dynamics, growth trends, regional dominance, product landscape, key players, and future outlook. The study period covers 2019-2033, with 2025 as the base and estimated year. The forecast period spans 2025-2033, and the historical period covers 2019-2024. This report is crucial for industry professionals, investors, and strategic decision-makers seeking to understand and capitalize on the opportunities within this rapidly evolving market. The parent market is the interactive display market and the child market is the smart classroom technology market.
Smart E Blackboards Market Dynamics & Structure
The global Smart E Blackboards market, valued at $xx million in 2024, is experiencing significant growth driven by technological advancements and increasing adoption across educational institutions and corporate settings. Market concentration is moderately high, with key players like Hitevision, Seewo (CVTE), and Hikvision holding significant market share. However, the market is also witnessing the emergence of several innovative smaller players.
- Market Concentration: The top 5 players hold approximately xx% of the market share in 2024.
- Technological Innovation: Integration of AI, cloud computing, and interactive features are driving market growth. However, challenges remain in ensuring seamless integration and interoperability across different platforms.
- Regulatory Frameworks: Government initiatives promoting digital education and smart classroom technologies are positively impacting market growth, particularly in regions like Asia-Pacific and North America. However, variations in regulations across different countries create complexities for global players.
- Competitive Product Substitutes: Traditional whiteboards and projectors pose a competitive threat, although the superior functionality and engagement offered by Smart E Blackboards are gradually eroding their market share.
- End-User Demographics: The primary end-users are educational institutions (K-12 and higher education), corporate training centers, and government organizations. The increasing demand from the corporate sector is a key growth driver.
- M&A Trends: The past five years have witnessed xx M&A deals, primarily focused on consolidating market share and expanding product portfolios.
Smart E Blackboards Growth Trends & Insights
The Smart E Blackboards market is projected to witness robust growth, with a Compound Annual Growth Rate (CAGR) of xx% during the forecast period (2025-2033). Market size is expected to reach $xx million by 2033. This growth is fueled by several factors, including rising investments in education technology, increasing demand for interactive learning environments, and the adoption of BYOD (Bring Your Own Device) policies in educational institutions. Technological advancements such as the integration of Augmented Reality (AR) and Virtual Reality (VR) are further enhancing the appeal of Smart E Blackboards. Consumer behavior is shifting towards more engaging and interactive learning experiences, driving the adoption of these advanced technologies. Market penetration is expected to increase from xx% in 2024 to xx% by 2033.
Dominant Regions, Countries, or Segments in Smart E Blackboards
The North American and Asia-Pacific regions are currently leading the Smart E Blackboards market, driven by robust economic growth, supportive government policies, and a high concentration of educational institutions and corporations. Within Asia-Pacific, China and India are experiencing particularly rapid growth.
- Key Drivers in North America: High per capita income, strong investments in education technology, and advanced digital infrastructure.
- Key Drivers in Asia-Pacific: Growing economies, rising government spending on education, and increasing adoption of technology in educational settings.
- Market Share: North America holds approximately xx% of the market share, while Asia-Pacific holds approximately xx%.
- Growth Potential: Significant growth potential exists in emerging economies, particularly in Latin America and Africa, as these regions increasingly invest in upgrading their education systems.
Smart E Blackboards Product Landscape
Smart E Blackboards are characterized by their interactive features, including touch-sensitive displays, integrated software, and connectivity options. Recent innovations include seamless integration with cloud-based platforms, advanced collaboration tools, and the incorporation of AI-powered features for personalized learning. Key selling propositions include enhanced engagement, improved learning outcomes, and streamlined classroom management.
Key Drivers, Barriers & Challenges in Smart E Blackboards
Key Drivers:
- Rising demand for interactive learning experiences in educational settings.
- Government initiatives promoting digital education and smart classrooms.
- Technological advancements, such as the integration of AI and cloud computing.
- Increasing adoption of BYOD policies.
Key Challenges:
- High initial investment costs can be a barrier for smaller institutions.
- Concerns regarding data security and privacy related to cloud-based solutions.
- Limited technical support and training resources in certain regions.
- Competition from traditional whiteboards and projectors. This competition reduces the market share by approximately xx% in 2024.
Emerging Opportunities in Smart E Blackboards
- Expansion into untapped markets, particularly in developing countries.
- Development of specialized Smart E Blackboards for specific industries (e.g., healthcare, corporate training).
- Integration of advanced technologies, such as AR/VR and gamification, to enhance user experience.
- Development of user-friendly software and intuitive interfaces.
Growth Accelerators in the Smart E Blackboards Industry
Strategic partnerships between hardware manufacturers and software developers are accelerating market growth. Furthermore, the development of robust cloud-based platforms is enabling seamless integration and scalability, while the integration of AI and machine learning is driving personalization and enhancing learning outcomes. Market expansion into new geographical regions and the development of specialized applications will further fuel growth.
Key Players Shaping the Smart E Blackboards Market
- Hitevision
- Seewo (CVTE)
- Jiangsu Daguan
- Jiangsu Oudi
- Createview
- Lighton
- Horion
- Hikvision
- Hanvon
- Odin Technology
- Thinkpanel
- STboard
- Guangzhou Yichuang Electronic Technology Co
- Guangdong Asano Technology Co
Notable Milestones in Smart E Blackboards Sector
- 2020: Seewo (CVTE) launched its next-generation Smart E Blackboard with enhanced AI capabilities.
- 2021: Hikvision introduced a series of Smart E Blackboards optimized for corporate training environments.
- 2022: Several mergers and acquisitions occurred, consolidating market share among key players.
- 2023: Significant advancements in AR/VR integration were seen in several new product releases.
In-Depth Smart E Blackboards Market Outlook
The Smart E Blackboards market is poised for continued growth, driven by ongoing technological innovations, increasing demand from both the education and corporate sectors, and favorable government policies. Strategic investments in research and development, along with strategic partnerships and market expansion initiatives, will be critical for sustained growth and success in this dynamic market. The projected market size of $xx million by 2033 presents significant opportunities for both established players and new entrants.
Smart E Blackboards Segmentation
-
1. Application
- 1.1. K-12 Education
- 1.2. Higher Education
-
2. Type
- 2.1. < 55 Inch
- 2.2. 56-65 Inch
- 2.3. 66-75 Inch
- 2.4. 76-85 Inch
- 2.5. > 85 Inch
Smart E Blackboards Segmentation By Geography
-
1. North America
- 1.1. United States
- 1.2. Canada
- 1.3. Mexico
-
2. South America
- 2.1. Brazil
- 2.2. Argentina
- 2.3. Rest of South America
-
3. Europe
- 3.1. United Kingdom
- 3.2. Germany
- 3.3. France
- 3.4. Italy
- 3.5. Spain
- 3.6. Russia
- 3.7. Benelux
- 3.8. Nordics
- 3.9. Rest of Europe
-
4. Middle East & Africa
- 4.1. Turkey
- 4.2. Israel
- 4.3. GCC
- 4.4. North Africa
- 4.5. South Africa
- 4.6. Rest of Middle East & Africa
-
5. Asia Pacific
- 5.1. China
- 5.2. India
- 5.3. Japan
- 5.4. South Korea
- 5.5. ASEAN
- 5.6. Oceania
- 5.7. Rest of Asia Pacific
Smart E Blackboards REPORT HIGHLIGHTS
| Aspects | Details |
|---|---|
| Study Period | 2019-2033 |
| Base Year | 2024 |
| Estimated Year | 2025 |
| Forecast Period | 2025-2033 |
| Historical Period | 2019-2024 |
| Growth Rate | CAGR of XXX% from 2019-2033 |
| Segmentation |
|
Table of Contents
- 1. Introduction
- 1.1. Research Scope
- 1.2. Market Segmentation
- 1.3. Research Methodology
- 1.4. Definitions and Assumptions
- 2. Executive Summary
- 2.1. Introduction
- 3. Market Dynamics
- 3.1. Introduction
- 3.2. Market Drivers
- 3.3. Market Restrains
- 3.4. Market Trends
- 4. Market Factor Analysis
- 4.1. Porters Five Forces
- 4.2. Supply/Value Chain
- 4.3. PESTEL analysis
- 4.4. Market Entropy
- 4.5. Patent/Trademark Analysis
- 5. Global Smart E Blackboards Analysis, Insights and Forecast, 2019-2031
- 5.1. Market Analysis, Insights and Forecast - by Application
- 5.1.1. K-12 Education
- 5.1.2. Higher Education
- 5.2. Market Analysis, Insights and Forecast - by Type
- 5.2.1. < 55 Inch
- 5.2.2. 56-65 Inch
- 5.2.3. 66-75 Inch
- 5.2.4. 76-85 Inch
- 5.2.5. > 85 Inch
- 5.3. Market Analysis, Insights and Forecast - by Region
- 5.3.1. North America
- 5.3.2. South America
- 5.3.3. Europe
- 5.3.4. Middle East & Africa
- 5.3.5. Asia Pacific
- 5.1. Market Analysis, Insights and Forecast - by Application
- 6. North America Smart E Blackboards Analysis, Insights and Forecast, 2019-2031
- 6.1. Market Analysis, Insights and Forecast - by Application
- 6.1.1. K-12 Education
- 6.1.2. Higher Education
- 6.2. Market Analysis, Insights and Forecast - by Type
- 6.2.1. < 55 Inch
- 6.2.2. 56-65 Inch
- 6.2.3. 66-75 Inch
- 6.2.4. 76-85 Inch
- 6.2.5. > 85 Inch
- 6.1. Market Analysis, Insights and Forecast - by Application
- 7. South America Smart E Blackboards Analysis, Insights and Forecast, 2019-2031
- 7.1. Market Analysis, Insights and Forecast - by Application
- 7.1.1. K-12 Education
- 7.1.2. Higher Education
- 7.2. Market Analysis, Insights and Forecast - by Type
- 7.2.1. < 55 Inch
- 7.2.2. 56-65 Inch
- 7.2.3. 66-75 Inch
- 7.2.4. 76-85 Inch
- 7.2.5. > 85 Inch
- 7.1. Market Analysis, Insights and Forecast - by Application
- 8. Europe Smart E Blackboards Analysis, Insights and Forecast, 2019-2031
- 8.1. Market Analysis, Insights and Forecast - by Application
- 8.1.1. K-12 Education
- 8.1.2. Higher Education
- 8.2. Market Analysis, Insights and Forecast - by Type
- 8.2.1. < 55 Inch
- 8.2.2. 56-65 Inch
- 8.2.3. 66-75 Inch
- 8.2.4. 76-85 Inch
- 8.2.5. > 85 Inch
- 8.1. Market Analysis, Insights and Forecast - by Application
- 9. Middle East & Africa Smart E Blackboards Analysis, Insights and Forecast, 2019-2031
- 9.1. Market Analysis, Insights and Forecast - by Application
- 9.1.1. K-12 Education
- 9.1.2. Higher Education
- 9.2. Market Analysis, Insights and Forecast - by Type
- 9.2.1. < 55 Inch
- 9.2.2. 56-65 Inch
- 9.2.3. 66-75 Inch
- 9.2.4. 76-85 Inch
- 9.2.5. > 85 Inch
- 9.1. Market Analysis, Insights and Forecast - by Application
- 10. Asia Pacific Smart E Blackboards Analysis, Insights and Forecast, 2019-2031
- 10.1. Market Analysis, Insights and Forecast - by Application
- 10.1.1. K-12 Education
- 10.1.2. Higher Education
- 10.2. Market Analysis, Insights and Forecast - by Type
- 10.2.1. < 55 Inch
- 10.2.2. 56-65 Inch
- 10.2.3. 66-75 Inch
- 10.2.4. 76-85 Inch
- 10.2.5. > 85 Inch
- 10.1. Market Analysis, Insights and Forecast - by Application
- 11. Competitive Analysis
- 11.1. Global Market Share Analysis 2024
- 11.2. Company Profiles
- 11.2.1 Hitevision
- 11.2.1.1. Overview
- 11.2.1.2. Products
- 11.2.1.3. SWOT Analysis
- 11.2.1.4. Recent Developments
- 11.2.1.5. Financials (Based on Availability)
- 11.2.2 Seewo(CVTE)
- 11.2.2.1. Overview
- 11.2.2.2. Products
- 11.2.2.3. SWOT Analysis
- 11.2.2.4. Recent Developments
- 11.2.2.5. Financials (Based on Availability)
- 11.2.3 Jiangsu Daguan
- 11.2.3.1. Overview
- 11.2.3.2. Products
- 11.2.3.3. SWOT Analysis
- 11.2.3.4. Recent Developments
- 11.2.3.5. Financials (Based on Availability)
- 11.2.4 Jiangsu Oudi
- 11.2.4.1. Overview
- 11.2.4.2. Products
- 11.2.4.3. SWOT Analysis
- 11.2.4.4. Recent Developments
- 11.2.4.5. Financials (Based on Availability)
- 11.2.5 Createview
- 11.2.5.1. Overview
- 11.2.5.2. Products
- 11.2.5.3. SWOT Analysis
- 11.2.5.4. Recent Developments
- 11.2.5.5. Financials (Based on Availability)
- 11.2.6 Lighton
- 11.2.6.1. Overview
- 11.2.6.2. Products
- 11.2.6.3. SWOT Analysis
- 11.2.6.4. Recent Developments
- 11.2.6.5. Financials (Based on Availability)
- 11.2.7 Horion
- 11.2.7.1. Overview
- 11.2.7.2. Products
- 11.2.7.3. SWOT Analysis
- 11.2.7.4. Recent Developments
- 11.2.7.5. Financials (Based on Availability)
- 11.2.8 Hikvision
- 11.2.8.1. Overview
- 11.2.8.2. Products
- 11.2.8.3. SWOT Analysis
- 11.2.8.4. Recent Developments
- 11.2.8.5. Financials (Based on Availability)
- 11.2.9 Hanvon
- 11.2.9.1. Overview
- 11.2.9.2. Products
- 11.2.9.3. SWOT Analysis
- 11.2.9.4. Recent Developments
- 11.2.9.5. Financials (Based on Availability)
- 11.2.10 Odin Technology
- 11.2.10.1. Overview
- 11.2.10.2. Products
- 11.2.10.3. SWOT Analysis
- 11.2.10.4. Recent Developments
- 11.2.10.5. Financials (Based on Availability)
- 11.2.11 Thinkpanel
- 11.2.11.1. Overview
- 11.2.11.2. Products
- 11.2.11.3. SWOT Analysis
- 11.2.11.4. Recent Developments
- 11.2.11.5. Financials (Based on Availability)
- 11.2.12 STboard
- 11.2.12.1. Overview
- 11.2.12.2. Products
- 11.2.12.3. SWOT Analysis
- 11.2.12.4. Recent Developments
- 11.2.12.5. Financials (Based on Availability)
- 11.2.13 Guangzhou Yichuang Electronic Technology Co
- 11.2.13.1. Overview
- 11.2.13.2. Products
- 11.2.13.3. SWOT Analysis
- 11.2.13.4. Recent Developments
- 11.2.13.5. Financials (Based on Availability)
- 11.2.14 Guangdong Asano Technology Co
- 11.2.14.1. Overview
- 11.2.14.2. Products
- 11.2.14.3. SWOT Analysis
- 11.2.14.4. Recent Developments
- 11.2.14.5. Financials (Based on Availability)
- 11.2.1 Hitevision
List of Figures
- Figure 1: Global Smart E Blackboards Revenue Breakdown (million, %) by Region 2024 & 2032
- Figure 2: Global Smart E Blackboards Volume Breakdown (K, %) by Region 2024 & 2032
- Figure 3: North America Smart E Blackboards Revenue (million), by Application 2024 & 2032
- Figure 4: North America Smart E Blackboards Volume (K), by Application 2024 & 2032
- Figure 5: North America Smart E Blackboards Revenue Share (%), by Application 2024 & 2032
- Figure 6: North America Smart E Blackboards Volume Share (%), by Application 2024 & 2032
- Figure 7: North America Smart E Blackboards Revenue (million), by Type 2024 & 2032
- Figure 8: North America Smart E Blackboards Volume (K), by Type 2024 & 2032
- Figure 9: North America Smart E Blackboards Revenue Share (%), by Type 2024 & 2032
- Figure 10: North America Smart E Blackboards Volume Share (%), by Type 2024 & 2032
- Figure 11: North America Smart E Blackboards Revenue (million), by Country 2024 & 2032
- Figure 12: North America Smart E Blackboards Volume (K), by Country 2024 & 2032
- Figure 13: North America Smart E Blackboards Revenue Share (%), by Country 2024 & 2032
- Figure 14: North America Smart E Blackboards Volume Share (%), by Country 2024 & 2032
- Figure 15: South America Smart E Blackboards Revenue (million), by Application 2024 & 2032
- Figure 16: South America Smart E Blackboards Volume (K), by Application 2024 & 2032
- Figure 17: South America Smart E Blackboards Revenue Share (%), by Application 2024 & 2032
- Figure 18: South America Smart E Blackboards Volume Share (%), by Application 2024 & 2032
- Figure 19: South America Smart E Blackboards Revenue (million), by Type 2024 & 2032
- Figure 20: South America Smart E Blackboards Volume (K), by Type 2024 & 2032
- Figure 21: South America Smart E Blackboards Revenue Share (%), by Type 2024 & 2032
- Figure 22: South America Smart E Blackboards Volume Share (%), by Type 2024 & 2032
- Figure 23: South America Smart E Blackboards Revenue (million), by Country 2024 & 2032
- Figure 24: South America Smart E Blackboards Volume (K), by Country 2024 & 2032
- Figure 25: South America Smart E Blackboards Revenue Share (%), by Country 2024 & 2032
- Figure 26: South America Smart E Blackboards Volume Share (%), by Country 2024 & 2032
- Figure 27: Europe Smart E Blackboards Revenue (million), by Application 2024 & 2032
- Figure 28: Europe Smart E Blackboards Volume (K), by Application 2024 & 2032
- Figure 29: Europe Smart E Blackboards Revenue Share (%), by Application 2024 & 2032
- Figure 30: Europe Smart E Blackboards Volume Share (%), by Application 2024 & 2032
- Figure 31: Europe Smart E Blackboards Revenue (million), by Type 2024 & 2032
- Figure 32: Europe Smart E Blackboards Volume (K), by Type 2024 & 2032
- Figure 33: Europe Smart E Blackboards Revenue Share (%), by Type 2024 & 2032
- Figure 34: Europe Smart E Blackboards Volume Share (%), by Type 2024 & 2032
- Figure 35: Europe Smart E Blackboards Revenue (million), by Country 2024 & 2032
- Figure 36: Europe Smart E Blackboards Volume (K), by Country 2024 & 2032
- Figure 37: Europe Smart E Blackboards Revenue Share (%), by Country 2024 & 2032
- Figure 38: Europe Smart E Blackboards Volume Share (%), by Country 2024 & 2032
- Figure 39: Middle East & Africa Smart E Blackboards Revenue (million), by Application 2024 & 2032
- Figure 40: Middle East & Africa Smart E Blackboards Volume (K), by Application 2024 & 2032
- Figure 41: Middle East & Africa Smart E Blackboards Revenue Share (%), by Application 2024 & 2032
- Figure 42: Middle East & Africa Smart E Blackboards Volume Share (%), by Application 2024 & 2032
- Figure 43: Middle East & Africa Smart E Blackboards Revenue (million), by Type 2024 & 2032
- Figure 44: Middle East & Africa Smart E Blackboards Volume (K), by Type 2024 & 2032
- Figure 45: Middle East & Africa Smart E Blackboards Revenue Share (%), by Type 2024 & 2032
- Figure 46: Middle East & Africa Smart E Blackboards Volume Share (%), by Type 2024 & 2032
- Figure 47: Middle East & Africa Smart E Blackboards Revenue (million), by Country 2024 & 2032
- Figure 48: Middle East & Africa Smart E Blackboards Volume (K), by Country 2024 & 2032
- Figure 49: Middle East & Africa Smart E Blackboards Revenue Share (%), by Country 2024 & 2032
- Figure 50: Middle East & Africa Smart E Blackboards Volume Share (%), by Country 2024 & 2032
- Figure 51: Asia Pacific Smart E Blackboards Revenue (million), by Application 2024 & 2032
- Figure 52: Asia Pacific Smart E Blackboards Volume (K), by Application 2024 & 2032
- Figure 53: Asia Pacific Smart E Blackboards Revenue Share (%), by Application 2024 & 2032
- Figure 54: Asia Pacific Smart E Blackboards Volume Share (%), by Application 2024 & 2032
- Figure 55: Asia Pacific Smart E Blackboards Revenue (million), by Type 2024 & 2032
- Figure 56: Asia Pacific Smart E Blackboards Volume (K), by Type 2024 & 2032
- Figure 57: Asia Pacific Smart E Blackboards Revenue Share (%), by Type 2024 & 2032
- Figure 58: Asia Pacific Smart E Blackboards Volume Share (%), by Type 2024 & 2032
- Figure 59: Asia Pacific Smart E Blackboards Revenue (million), by Country 2024 & 2032
- Figure 60: Asia Pacific Smart E Blackboards Volume (K), by Country 2024 & 2032
- Figure 61: Asia Pacific Smart E Blackboards Revenue Share (%), by Country 2024 & 2032
- Figure 62: Asia Pacific Smart E Blackboards Volume Share (%), by Country 2024 & 2032
List of Tables
- Table 1: Global Smart E Blackboards Revenue million Forecast, by Region 2019 & 2032
- Table 2: Global Smart E Blackboards Volume K Forecast, by Region 2019 & 2032
- Table 3: Global Smart E Blackboards Revenue million Forecast, by Application 2019 & 2032
- Table 4: Global Smart E Blackboards Volume K Forecast, by Application 2019 & 2032
- Table 5: Global Smart E Blackboards Revenue million Forecast, by Type 2019 & 2032
- Table 6: Global Smart E Blackboards Volume K Forecast, by Type 2019 & 2032
- Table 7: Global Smart E Blackboards Revenue million Forecast, by Region 2019 & 2032
- Table 8: Global Smart E Blackboards Volume K Forecast, by Region 2019 & 2032
- Table 9: Global Smart E Blackboards Revenue million Forecast, by Application 2019 & 2032
- Table 10: Global Smart E Blackboards Volume K Forecast, by Application 2019 & 2032
- Table 11: Global Smart E Blackboards Revenue million Forecast, by Type 2019 & 2032
- Table 12: Global Smart E Blackboards Volume K Forecast, by Type 2019 & 2032
- Table 13: Global Smart E Blackboards Revenue million Forecast, by Country 2019 & 2032
- Table 14: Global Smart E Blackboards Volume K Forecast, by Country 2019 & 2032
- Table 15: United States Smart E Blackboards Revenue (million) Forecast, by Application 2019 & 2032
- Table 16: United States Smart E Blackboards Volume (K) Forecast, by Application 2019 & 2032
- Table 17: Canada Smart E Blackboards Revenue (million) Forecast, by Application 2019 & 2032
- Table 18: Canada Smart E Blackboards Volume (K) Forecast, by Application 2019 & 2032
- Table 19: Mexico Smart E Blackboards Revenue (million) Forecast, by Application 2019 & 2032
- Table 20: Mexico Smart E Blackboards Volume (K) Forecast, by Application 2019 & 2032
- Table 21: Global Smart E Blackboards Revenue million Forecast, by Application 2019 & 2032
- Table 22: Global Smart E Blackboards Volume K Forecast, by Application 2019 & 2032
- Table 23: Global Smart E Blackboards Revenue million Forecast, by Type 2019 & 2032
- Table 24: Global Smart E Blackboards Volume K Forecast, by Type 2019 & 2032
- Table 25: Global Smart E Blackboards Revenue million Forecast, by Country 2019 & 2032
- Table 26: Global Smart E Blackboards Volume K Forecast, by Country 2019 & 2032
- Table 27: Brazil Smart E Blackboards Revenue (million) Forecast, by Application 2019 & 2032
- Table 28: Brazil Smart E Blackboards Volume (K) Forecast, by Application 2019 & 2032
- Table 29: Argentina Smart E Blackboards Revenue (million) Forecast, by Application 2019 & 2032
- Table 30: Argentina Smart E Blackboards Volume (K) Forecast, by Application 2019 & 2032
- Table 31: Rest of South America Smart E Blackboards Revenue (million) Forecast, by Application 2019 & 2032
- Table 32: Rest of South America Smart E Blackboards Volume (K) Forecast, by Application 2019 & 2032
- Table 33: Global Smart E Blackboards Revenue million Forecast, by Application 2019 & 2032
- Table 34: Global Smart E Blackboards Volume K Forecast, by Application 2019 & 2032
- Table 35: Global Smart E Blackboards Revenue million Forecast, by Type 2019 & 2032
- Table 36: Global Smart E Blackboards Volume K Forecast, by Type 2019 & 2032
- Table 37: Global Smart E Blackboards Revenue million Forecast, by Country 2019 & 2032
- Table 38: Global Smart E Blackboards Volume K Forecast, by Country 2019 & 2032
- Table 39: United Kingdom Smart E Blackboards Revenue (million) Forecast, by Application 2019 & 2032
- Table 40: United Kingdom Smart E Blackboards Volume (K) Forecast, by Application 2019 & 2032
- Table 41: Germany Smart E Blackboards Revenue (million) Forecast, by Application 2019 & 2032
- Table 42: Germany Smart E Blackboards Volume (K) Forecast, by Application 2019 & 2032
- Table 43: France Smart E Blackboards Revenue (million) Forecast, by Application 2019 & 2032
- Table 44: France Smart E Blackboards Volume (K) Forecast, by Application 2019 & 2032
- Table 45: Italy Smart E Blackboards Revenue (million) Forecast, by Application 2019 & 2032
- Table 46: Italy Smart E Blackboards Volume (K) Forecast, by Application 2019 & 2032
- Table 47: Spain Smart E Blackboards Revenue (million) Forecast, by Application 2019 & 2032
- Table 48: Spain Smart E Blackboards Volume (K) Forecast, by Application 2019 & 2032
- Table 49: Russia Smart E Blackboards Revenue (million) Forecast, by Application 2019 & 2032
- Table 50: Russia Smart E Blackboards Volume (K) Forecast, by Application 2019 & 2032
- Table 51: Benelux Smart E Blackboards Revenue (million) Forecast, by Application 2019 & 2032
- Table 52: Benelux Smart E Blackboards Volume (K) Forecast, by Application 2019 & 2032
- Table 53: Nordics Smart E Blackboards Revenue (million) Forecast, by Application 2019 & 2032
- Table 54: Nordics Smart E Blackboards Volume (K) Forecast, by Application 2019 & 2032
- Table 55: Rest of Europe Smart E Blackboards Revenue (million) Forecast, by Application 2019 & 2032
- Table 56: Rest of Europe Smart E Blackboards Volume (K) Forecast, by Application 2019 & 2032
- Table 57: Global Smart E Blackboards Revenue million Forecast, by Application 2019 & 2032
- Table 58: Global Smart E Blackboards Volume K Forecast, by Application 2019 & 2032
- Table 59: Global Smart E Blackboards Revenue million Forecast, by Type 2019 & 2032
- Table 60: Global Smart E Blackboards Volume K Forecast, by Type 2019 & 2032
- Table 61: Global Smart E Blackboards Revenue million Forecast, by Country 2019 & 2032
- Table 62: Global Smart E Blackboards Volume K Forecast, by Country 2019 & 2032
- Table 63: Turkey Smart E Blackboards Revenue (million) Forecast, by Application 2019 & 2032
- Table 64: Turkey Smart E Blackboards Volume (K) Forecast, by Application 2019 & 2032
- Table 65: Israel Smart E Blackboards Revenue (million) Forecast, by Application 2019 & 2032
- Table 66: Israel Smart E Blackboards Volume (K) Forecast, by Application 2019 & 2032
- Table 67: GCC Smart E Blackboards Revenue (million) Forecast, by Application 2019 & 2032
- Table 68: GCC Smart E Blackboards Volume (K) Forecast, by Application 2019 & 2032
- Table 69: North Africa Smart E Blackboards Revenue (million) Forecast, by Application 2019 & 2032
- Table 70: North Africa Smart E Blackboards Volume (K) Forecast, by Application 2019 & 2032
- Table 71: South Africa Smart E Blackboards Revenue (million) Forecast, by Application 2019 & 2032
- Table 72: South Africa Smart E Blackboards Volume (K) Forecast, by Application 2019 & 2032
- Table 73: Rest of Middle East & Africa Smart E Blackboards Revenue (million) Forecast, by Application 2019 & 2032
- Table 74: Rest of Middle East & Africa Smart E Blackboards Volume (K) Forecast, by Application 2019 & 2032
- Table 75: Global Smart E Blackboards Revenue million Forecast, by Application 2019 & 2032
- Table 76: Global Smart E Blackboards Volume K Forecast, by Application 2019 & 2032
- Table 77: Global Smart E Blackboards Revenue million Forecast, by Type 2019 & 2032
- Table 78: Global Smart E Blackboards Volume K Forecast, by Type 2019 & 2032
- Table 79: Global Smart E Blackboards Revenue million Forecast, by Country 2019 & 2032
- Table 80: Global Smart E Blackboards Volume K Forecast, by Country 2019 & 2032
- Table 81: China Smart E Blackboards Revenue (million) Forecast, by Application 2019 & 2032
- Table 82: China Smart E Blackboards Volume (K) Forecast, by Application 2019 & 2032
- Table 83: India Smart E Blackboards Revenue (million) Forecast, by Application 2019 & 2032
- Table 84: India Smart E Blackboards Volume (K) Forecast, by Application 2019 & 2032
- Table 85: Japan Smart E Blackboards Revenue (million) Forecast, by Application 2019 & 2032
- Table 86: Japan Smart E Blackboards Volume (K) Forecast, by Application 2019 & 2032
- Table 87: South Korea Smart E Blackboards Revenue (million) Forecast, by Application 2019 & 2032
- Table 88: South Korea Smart E Blackboards Volume (K) Forecast, by Application 2019 & 2032
- Table 89: ASEAN Smart E Blackboards Revenue (million) Forecast, by Application 2019 & 2032
- Table 90: ASEAN Smart E Blackboards Volume (K) Forecast, by Application 2019 & 2032
- Table 91: Oceania Smart E Blackboards Revenue (million) Forecast, by Application 2019 & 2032
- Table 92: Oceania Smart E Blackboards Volume (K) Forecast, by Application 2019 & 2032
- Table 93: Rest of Asia Pacific Smart E Blackboards Revenue (million) Forecast, by Application 2019 & 2032
- Table 94: Rest of Asia Pacific Smart E Blackboards Volume (K) Forecast, by Application 2019 & 2032
Frequently Asked Questions
1. What is the projected Compound Annual Growth Rate (CAGR) of the Smart E Blackboards?
The projected CAGR is approximately XXX%.
2. Which companies are prominent players in the Smart E Blackboards?
Key companies in the market include Hitevision, Seewo(CVTE), Jiangsu Daguan, Jiangsu Oudi, Createview, Lighton, Horion, Hikvision, Hanvon, Odin Technology, Thinkpanel, STboard, Guangzhou Yichuang Electronic Technology Co, Guangdong Asano Technology Co.
3. What are the main segments of the Smart E Blackboards?
The market segments include Application, Type.
4. Can you provide details about the market size?
The market size is estimated to be USD XXX million as of 2022.
5. What are some drivers contributing to market growth?
N/A
6. What are the notable trends driving market growth?
N/A
7. Are there any restraints impacting market growth?
N/A
8. Can you provide examples of recent developments in the market?
N/A
9. What pricing options are available for accessing the report?
Pricing options include single-user, multi-user, and enterprise licenses priced at USD 3950.00, USD 5925.00, and USD 7900.00 respectively.
10. Is the market size provided in terms of value or volume?
The market size is provided in terms of value, measured in million and volume, measured in K.
11. Are there any specific market keywords associated with the report?
Yes, the market keyword associated with the report is "Smart E Blackboards," which aids in identifying and referencing the specific market segment covered.
12. How do I determine which pricing option suits my needs best?
The pricing options vary based on user requirements and access needs. Individual users may opt for single-user licenses, while businesses requiring broader access may choose multi-user or enterprise licenses for cost-effective access to the report.
13. Are there any additional resources or data provided in the Smart E Blackboards report?
While the report offers comprehensive insights, it's advisable to review the specific contents or supplementary materials provided to ascertain if additional resources or data are available.
14. How can I stay updated on further developments or reports in the Smart E Blackboards?
To stay informed about further developments, trends, and reports in the Smart E Blackboards, consider subscribing to industry newsletters, following relevant companies and organizations, or regularly checking reputable industry news sources and publications.
Methodology
Step 1 - Identification of Relevant Samples Size from Population Database


Step 2 - Approaches for Defining Global Market Size (Value, Volume* & Price*)

Note*: In applicable scenarios
Step 3 - Data Sources
Primary Research
- Web Analytics
- Survey Reports
- Research Institute
- Latest Research Reports
- Opinion Leaders
Secondary Research
- Annual Reports
- White Paper
- Latest Press Release
- Industry Association
- Paid Database
- Investor Presentations

Step 4 - Data Triangulation
Involves using different sources of information in order to increase the validity of a study
These sources are likely to be stakeholders in a program - participants, other researchers, program staff, other community members, and so on.
Then we put all data in single framework & apply various statistical tools to find out the dynamic on the market.
During the analysis stage, feedback from the stakeholder groups would be compared to determine areas of agreement as well as areas of divergence
