

Key Insights
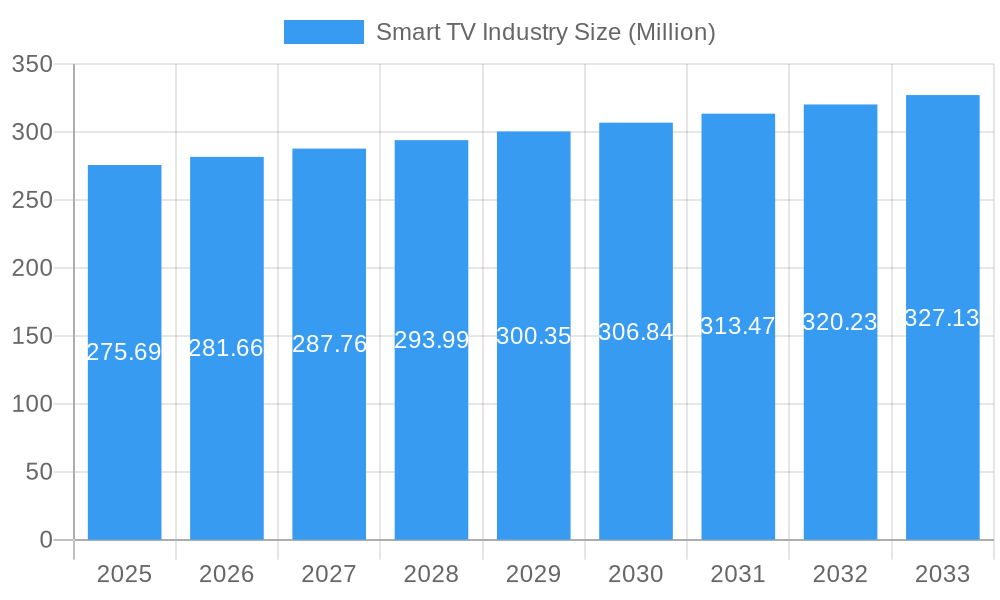
The global smart TV market, valued at $275.69 million in 2025, is projected to experience steady growth, driven by several key factors. The increasing adoption of streaming services and the demand for high-resolution displays are significant contributors to this expansion. Consumers are increasingly drawn to larger screen sizes, with 4K and 8K resolutions gaining popularity, pushing the market towards premium offerings. Technological advancements in panel types, such as OLED and QLED, are also fueling market growth by offering superior picture quality and enhanced viewing experiences. However, the market faces challenges including economic fluctuations influencing consumer spending and the potential saturation of the high-end market segment. The competitive landscape is characterized by established players like Samsung, LG, Hisense, and TCL, alongside emerging brands like Xiaomi, constantly innovating to capture market share. Regional variations exist, with North America and Europe representing significant mature markets, while the Asia-Pacific region, particularly India and Southeast Asia, displays substantial growth potential fueled by rising disposable incomes and increasing internet penetration. The consistent improvements in smart TV technology and a broadening of the available features continue to increase the market size year on year.
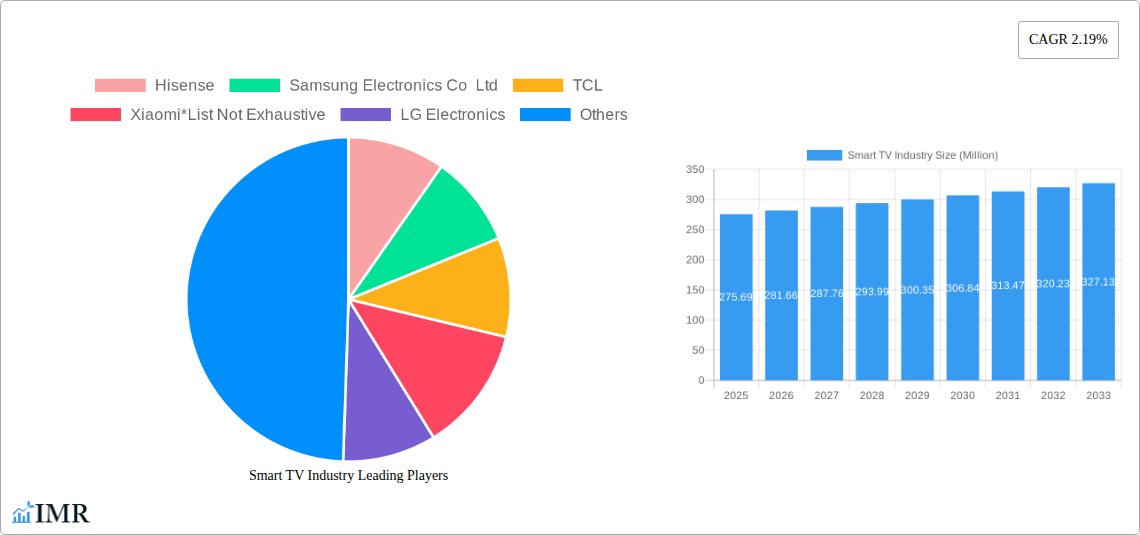
Smart TV Industry Market Size (In Million)
This steady growth is expected to continue through 2033, with a Compound Annual Growth Rate (CAGR) of 2.19%. This CAGR will likely be influenced by factors like technological advancements, shifting consumer preferences towards larger screen sizes and superior picture quality, and the continuous expansion of streaming content. Despite potential economic headwinds, the integration of smart features, such as voice assistants and improved user interfaces, is expected to stimulate demand across various segments. The market segmentation by resolution type (HD/FHD, 4K, 8K), screen size (various inch categories), and panel type (LCD, OLED, QLED) provides a granular view of market dynamics, allowing companies to tailor their strategies to specific consumer needs and preferences. The continued competition among leading brands will likely drive innovation and price reductions, making smart TVs more accessible to a wider consumer base.
Smart TV Industry Company Market Share
Smart TV Industry Market Report: 2019-2033
This comprehensive report provides a detailed analysis of the global Smart TV industry, covering market dynamics, growth trends, regional dominance, product landscape, key players, and future outlook. The study period spans from 2019 to 2033, with 2025 as the base and estimated year. This report is essential for industry professionals, investors, and strategic decision-makers seeking a deep understanding of this rapidly evolving market. We analyze the parent market (Consumer Electronics) and the child market (Smart TVs) to provide a holistic perspective.
Smart TV Industry Market Dynamics & Structure
The Smart TV market exhibits a moderately concentrated structure, with key players like Samsung Electronics Co Ltd, LG Electronics, Hisense, TCL, and Xiaomi holding significant market share. However, the market is dynamic, with continuous entry and exit of players. Technological innovation, particularly in display technologies (OLED, QLED, Mini-LED), resolution (8K), and smart features (AI integration, voice control), are primary growth drivers. Regulatory frameworks concerning energy efficiency and data privacy also influence market dynamics. Competitive substitutes, such as projectors and streaming devices, exert pressure, while the increasing demand for large-screen displays fuels market expansion. M&A activities are relatively frequent, driven by the need to secure technology, expand geographical reach, and enhance product portfolios. We estimate that xx% of the market was driven by M&A activity between 2019 and 2024.
- Market Concentration: Moderately concentrated, with top 5 players holding xx% market share in 2024.
- Technological Innovation: Key drivers include advancements in display technologies (OLED, QLED, 8K), AI integration, and improved user interfaces.
- Regulatory Landscape: Stringent energy efficiency standards and data privacy regulations shape market dynamics.
- Competitive Substitutes: Projectors and streaming devices pose a competitive threat.
- End-User Demographics: Growing demand from millennials and Gen Z drives sales of larger screen sizes and advanced features.
- M&A Trends: Consolidation is observed through strategic acquisitions aimed at technology and market expansion.
Smart TV Industry Growth Trends & Insights
The global Smart TV market witnessed substantial growth during the historical period (2019-2024), with a Compound Annual Growth Rate (CAGR) of xx%. This growth is attributed to factors such as rising disposable incomes, increasing internet penetration, and the growing popularity of streaming services. Market penetration continues to increase, with xx% of households owning at least one Smart TV in 2024. Technological disruptions, including the introduction of 8K resolution and advancements in HDR technology, are further fueling adoption rates. Consumer behavior shifts indicate a preference for larger screen sizes, improved picture quality, and enhanced smart features. We project a CAGR of xx% for the forecast period (2025-2033), with the market size reaching xx million units by 2033.
Dominant Regions, Countries, or Segments in Smart TV Industry
North America and Asia-Pacific are the leading regions, representing xx% and xx% of the global market in 2024, respectively. Within these regions, countries like the United States, China, and India exhibit the highest growth rates. The 4K resolution segment dominates the market by resolution type, holding xx% of market share in 2024. The 55-inch size category dominates the market by screen size, with sales reaching xx million units. LCD remains the most prevalent panel type, but the OLED and QLED segments show strong growth potential.
- Key Drivers: Strong economic growth, high internet penetration, and government initiatives promoting digitalization.
- Dominance Factors: Large consumer base, robust infrastructure, and strong technological advancements.
- Growth Potential: Emerging markets in Asia-Pacific and Latin America offer significant untapped opportunities.
Smart TV Industry Product Landscape
Smart TVs are characterized by continuous innovation, focusing on enhancing picture quality, expanding smart functionalities, and improving user experience. Key features include high-resolution displays (4K, 8K), HDR support (HDR10, Dolby Vision), advanced sound systems, integrated voice assistants (Alexa, Google Assistant), and access to numerous streaming services. The market also witnesses a rise in specialized Smart TVs, including gaming TVs, fitness TVs, and commercial displays, catering to niche markets. Unique selling propositions focus on superior picture quality, intuitive user interfaces, and seamless integration with smart home ecosystems.
Key Drivers, Barriers & Challenges in Smart TV Industry
Key Drivers:
- Increasing disposable incomes globally.
- Expanding internet and broadband penetration.
- Growing popularity of streaming services (Netflix, Amazon Prime, Disney+).
- Technological advancements in display technologies and smart features.
Key Challenges and Restraints:
- Intense competition among manufacturers.
- Supply chain disruptions impacting component availability and cost.
- Rising raw material prices.
- Regulatory hurdles and differing standards across regions.
- Fluctuations in global economic conditions.
Emerging Opportunities in Smart TV Industry
- Expanding into developing markets with high growth potential.
- Development of specialized Smart TVs for niche applications (e.g., gaming, fitness).
- Integration with smart home ecosystems and IoT devices.
- Focus on user experience and personalized content recommendations.
- Development of sustainable and energy-efficient Smart TV models.
Growth Accelerators in the Smart TV Industry
The Smart TV industry's long-term growth hinges on continuous technological breakthroughs, notably in mini-LED and MicroLED display technologies, which will enhance picture quality and energy efficiency. Strategic partnerships between manufacturers and content providers will expand the offering and value proposition. Expansion into emerging markets and the development of new applications for Smart TVs, like immersive gaming and interactive education platforms, will also fuel growth.
Key Players Shaping the Smart TV Industry Market
Notable Milestones in Smart TV Industry Sector
- January 2021: Hisense launched its TriChroma Laser TV line, featuring improved color accuracy and brightness.
- August 2021: Xiaomi launched the Mi TV 5X series in India, expanding its presence in the region.
In-Depth Smart TV Industry Market Outlook
The Smart TV market exhibits strong growth potential, driven by continued technological innovation, rising consumer demand for superior viewing experiences, and expansion into emerging markets. Strategic partnerships and diversification into specialized applications will define market leadership. The focus on improved energy efficiency and sustainable manufacturing practices will also play a key role in shaping the future of the industry.
Smart TV Industry Segmentation
-
1. Resolution Type
- 1.1. HD/FHD
- 1.2. 4K
- 1.3. 8K
-
2. Size (in inches)
- 2.1. Greater than 32
- 2.2. 39-43
- 2.3. 48-50
- 2.4. 55-60
- 2.5. Less than 65
-
3. Panel Type
- 3.1. LCD
- 3.2. OLED
- 3.3. QLED
Smart TV Industry Segmentation By Geography
- 1. North America
- 2. Europe
-
3. Asia Pacific
- 3.1. India
- 3.2. Southeast Asia
- 4. Latin America
- 5. Middle East and Africa
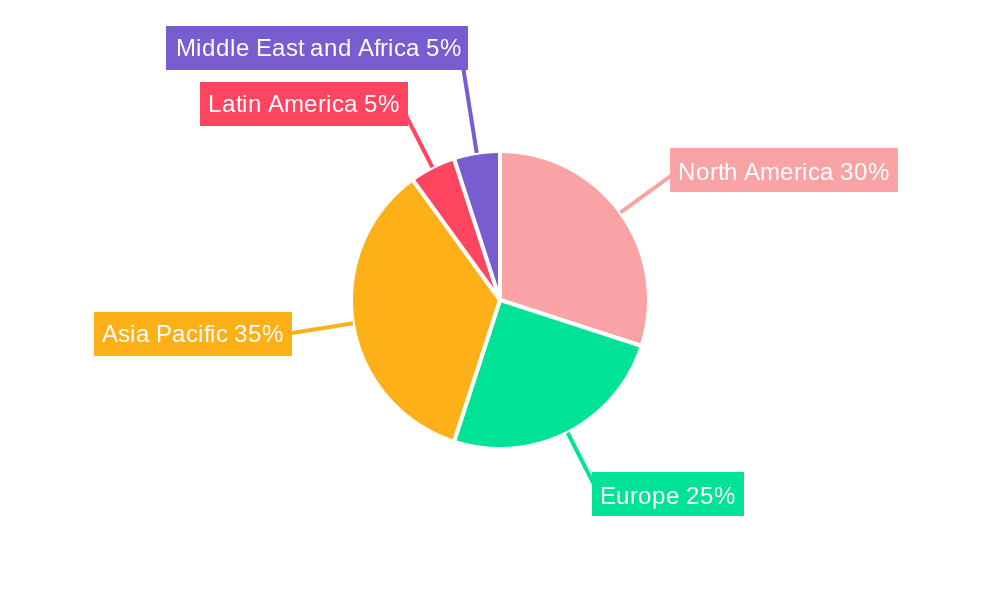
Smart TV Industry Regional Market Share
Geographic Coverage of Smart TV Industry
Smart TV Industry REPORT HIGHLIGHTS
| Aspects | Details |
|---|---|
| Study Period | 2020-2034 |
| Base Year | 2025 |
| Estimated Year | 2026 |
| Forecast Period | 2026-2034 |
| Historical Period | 2020-2025 |
| Growth Rate | CAGR of 2.19% from 2020-2034 |
| Segmentation |
|
Table of Contents
- 1. Introduction
- 1.1. Research Scope
- 1.2. Market Segmentation
- 1.3. Research Methodology
- 1.4. Definitions and Assumptions
- 2. Executive Summary
- 2.1. Introduction
- 3. Market Dynamics
- 3.1. Introduction
- 3.2. Market Drivers
- 3.2.1. Growing Disposable Income Across Emerging Economies; Rising Trend of Video-on-Demand Service
- 3.3. Market Restrains
- 3.3.1. The Need for High Investment in Content Creation and Broadcasting; Bandwidth Allocation for 4K Resolution
- 3.4. Market Trends
- 3.4.1. QLED is Expected to Witness Significant Growth
- 4. Market Factor Analysis
- 4.1. Porters Five Forces
- 4.2. Supply/Value Chain
- 4.3. PESTEL analysis
- 4.4. Market Entropy
- 4.5. Patent/Trademark Analysis
- 5. Global Smart TV Industry Analysis, Insights and Forecast, 2020-2032
- 5.1. Market Analysis, Insights and Forecast - by Resolution Type
- 5.1.1. HD/FHD
- 5.1.2. 4K
- 5.1.3. 8K
- 5.2. Market Analysis, Insights and Forecast - by Size (in inches)
- 5.2.1. Greater than 32
- 5.2.2. 39-43
- 5.2.3. 48-50
- 5.2.4. 55-60
- 5.2.5. Less than 65
- 5.3. Market Analysis, Insights and Forecast - by Panel Type
- 5.3.1. LCD
- 5.3.2. OLED
- 5.3.3. QLED
- 5.4. Market Analysis, Insights and Forecast - by Region
- 5.4.1. North America
- 5.4.2. Europe
- 5.4.3. Asia Pacific
- 5.4.4. Latin America
- 5.4.5. Middle East and Africa
- 5.1. Market Analysis, Insights and Forecast - by Resolution Type
- 6. North America Smart TV Industry Analysis, Insights and Forecast, 2020-2032
- 6.1. Market Analysis, Insights and Forecast - by Resolution Type
- 6.1.1. HD/FHD
- 6.1.2. 4K
- 6.1.3. 8K
- 6.2. Market Analysis, Insights and Forecast - by Size (in inches)
- 6.2.1. Greater than 32
- 6.2.2. 39-43
- 6.2.3. 48-50
- 6.2.4. 55-60
- 6.2.5. Less than 65
- 6.3. Market Analysis, Insights and Forecast - by Panel Type
- 6.3.1. LCD
- 6.3.2. OLED
- 6.3.3. QLED
- 6.1. Market Analysis, Insights and Forecast - by Resolution Type
- 7. Europe Smart TV Industry Analysis, Insights and Forecast, 2020-2032
- 7.1. Market Analysis, Insights and Forecast - by Resolution Type
- 7.1.1. HD/FHD
- 7.1.2. 4K
- 7.1.3. 8K
- 7.2. Market Analysis, Insights and Forecast - by Size (in inches)
- 7.2.1. Greater than 32
- 7.2.2. 39-43
- 7.2.3. 48-50
- 7.2.4. 55-60
- 7.2.5. Less than 65
- 7.3. Market Analysis, Insights and Forecast - by Panel Type
- 7.3.1. LCD
- 7.3.2. OLED
- 7.3.3. QLED
- 7.1. Market Analysis, Insights and Forecast - by Resolution Type
- 8. Asia Pacific Smart TV Industry Analysis, Insights and Forecast, 2020-2032
- 8.1. Market Analysis, Insights and Forecast - by Resolution Type
- 8.1.1. HD/FHD
- 8.1.2. 4K
- 8.1.3. 8K
- 8.2. Market Analysis, Insights and Forecast - by Size (in inches)
- 8.2.1. Greater than 32
- 8.2.2. 39-43
- 8.2.3. 48-50
- 8.2.4. 55-60
- 8.2.5. Less than 65
- 8.3. Market Analysis, Insights and Forecast - by Panel Type
- 8.3.1. LCD
- 8.3.2. OLED
- 8.3.3. QLED
- 8.1. Market Analysis, Insights and Forecast - by Resolution Type
- 9. Latin America Smart TV Industry Analysis, Insights and Forecast, 2020-2032
- 9.1. Market Analysis, Insights and Forecast - by Resolution Type
- 9.1.1. HD/FHD
- 9.1.2. 4K
- 9.1.3. 8K
- 9.2. Market Analysis, Insights and Forecast - by Size (in inches)
- 9.2.1. Greater than 32
- 9.2.2. 39-43
- 9.2.3. 48-50
- 9.2.4. 55-60
- 9.2.5. Less than 65
- 9.3. Market Analysis, Insights and Forecast - by Panel Type
- 9.3.1. LCD
- 9.3.2. OLED
- 9.3.3. QLED
- 9.1. Market Analysis, Insights and Forecast - by Resolution Type
- 10. Middle East and Africa Smart TV Industry Analysis, Insights and Forecast, 2020-2032
- 10.1. Market Analysis, Insights and Forecast - by Resolution Type
- 10.1.1. HD/FHD
- 10.1.2. 4K
- 10.1.3. 8K
- 10.2. Market Analysis, Insights and Forecast - by Size (in inches)
- 10.2.1. Greater than 32
- 10.2.2. 39-43
- 10.2.3. 48-50
- 10.2.4. 55-60
- 10.2.5. Less than 65
- 10.3. Market Analysis, Insights and Forecast - by Panel Type
- 10.3.1. LCD
- 10.3.2. OLED
- 10.3.3. QLED
- 10.1. Market Analysis, Insights and Forecast - by Resolution Type
- 11. Competitive Analysis
- 11.1. Global Market Share Analysis 2025
- 11.2. Company Profiles
- 11.2.1 Hisense
- 11.2.1.1. Overview
- 11.2.1.2. Products
- 11.2.1.3. SWOT Analysis
- 11.2.1.4. Recent Developments
- 11.2.1.5. Financials (Based on Availability)
- 11.2.2 Samsung Electronics Co Ltd
- 11.2.2.1. Overview
- 11.2.2.2. Products
- 11.2.2.3. SWOT Analysis
- 11.2.2.4. Recent Developments
- 11.2.2.5. Financials (Based on Availability)
- 11.2.3 TCL
- 11.2.3.1. Overview
- 11.2.3.2. Products
- 11.2.3.3. SWOT Analysis
- 11.2.3.4. Recent Developments
- 11.2.3.5. Financials (Based on Availability)
- 11.2.4 Xiaomi*List Not Exhaustive
- 11.2.4.1. Overview
- 11.2.4.2. Products
- 11.2.4.3. SWOT Analysis
- 11.2.4.4. Recent Developments
- 11.2.4.5. Financials (Based on Availability)
- 11.2.5 LG Electronics
- 11.2.5.1. Overview
- 11.2.5.2. Products
- 11.2.5.3. SWOT Analysis
- 11.2.5.4. Recent Developments
- 11.2.5.5. Financials (Based on Availability)
- 11.2.1 Hisense
List of Figures
- Figure 1: Global Smart TV Industry Revenue Breakdown (Million, %) by Region 2025 & 2033
- Figure 2: North America Smart TV Industry Revenue (Million), by Resolution Type 2025 & 2033
- Figure 3: North America Smart TV Industry Revenue Share (%), by Resolution Type 2025 & 2033
- Figure 4: North America Smart TV Industry Revenue (Million), by Size (in inches) 2025 & 2033
- Figure 5: North America Smart TV Industry Revenue Share (%), by Size (in inches) 2025 & 2033
- Figure 6: North America Smart TV Industry Revenue (Million), by Panel Type 2025 & 2033
- Figure 7: North America Smart TV Industry Revenue Share (%), by Panel Type 2025 & 2033
- Figure 8: North America Smart TV Industry Revenue (Million), by Country 2025 & 2033
- Figure 9: North America Smart TV Industry Revenue Share (%), by Country 2025 & 2033
- Figure 10: Europe Smart TV Industry Revenue (Million), by Resolution Type 2025 & 2033
- Figure 11: Europe Smart TV Industry Revenue Share (%), by Resolution Type 2025 & 2033
- Figure 12: Europe Smart TV Industry Revenue (Million), by Size (in inches) 2025 & 2033
- Figure 13: Europe Smart TV Industry Revenue Share (%), by Size (in inches) 2025 & 2033
- Figure 14: Europe Smart TV Industry Revenue (Million), by Panel Type 2025 & 2033
- Figure 15: Europe Smart TV Industry Revenue Share (%), by Panel Type 2025 & 2033
- Figure 16: Europe Smart TV Industry Revenue (Million), by Country 2025 & 2033
- Figure 17: Europe Smart TV Industry Revenue Share (%), by Country 2025 & 2033
- Figure 18: Asia Pacific Smart TV Industry Revenue (Million), by Resolution Type 2025 & 2033
- Figure 19: Asia Pacific Smart TV Industry Revenue Share (%), by Resolution Type 2025 & 2033
- Figure 20: Asia Pacific Smart TV Industry Revenue (Million), by Size (in inches) 2025 & 2033
- Figure 21: Asia Pacific Smart TV Industry Revenue Share (%), by Size (in inches) 2025 & 2033
- Figure 22: Asia Pacific Smart TV Industry Revenue (Million), by Panel Type 2025 & 2033
- Figure 23: Asia Pacific Smart TV Industry Revenue Share (%), by Panel Type 2025 & 2033
- Figure 24: Asia Pacific Smart TV Industry Revenue (Million), by Country 2025 & 2033
- Figure 25: Asia Pacific Smart TV Industry Revenue Share (%), by Country 2025 & 2033
- Figure 26: Latin America Smart TV Industry Revenue (Million), by Resolution Type 2025 & 2033
- Figure 27: Latin America Smart TV Industry Revenue Share (%), by Resolution Type 2025 & 2033
- Figure 28: Latin America Smart TV Industry Revenue (Million), by Size (in inches) 2025 & 2033
- Figure 29: Latin America Smart TV Industry Revenue Share (%), by Size (in inches) 2025 & 2033
- Figure 30: Latin America Smart TV Industry Revenue (Million), by Panel Type 2025 & 2033
- Figure 31: Latin America Smart TV Industry Revenue Share (%), by Panel Type 2025 & 2033
- Figure 32: Latin America Smart TV Industry Revenue (Million), by Country 2025 & 2033
- Figure 33: Latin America Smart TV Industry Revenue Share (%), by Country 2025 & 2033
- Figure 34: Middle East and Africa Smart TV Industry Revenue (Million), by Resolution Type 2025 & 2033
- Figure 35: Middle East and Africa Smart TV Industry Revenue Share (%), by Resolution Type 2025 & 2033
- Figure 36: Middle East and Africa Smart TV Industry Revenue (Million), by Size (in inches) 2025 & 2033
- Figure 37: Middle East and Africa Smart TV Industry Revenue Share (%), by Size (in inches) 2025 & 2033
- Figure 38: Middle East and Africa Smart TV Industry Revenue (Million), by Panel Type 2025 & 2033
- Figure 39: Middle East and Africa Smart TV Industry Revenue Share (%), by Panel Type 2025 & 2033
- Figure 40: Middle East and Africa Smart TV Industry Revenue (Million), by Country 2025 & 2033
- Figure 41: Middle East and Africa Smart TV Industry Revenue Share (%), by Country 2025 & 2033
List of Tables
- Table 1: Global Smart TV Industry Revenue Million Forecast, by Resolution Type 2020 & 2033
- Table 2: Global Smart TV Industry Revenue Million Forecast, by Size (in inches) 2020 & 2033
- Table 3: Global Smart TV Industry Revenue Million Forecast, by Panel Type 2020 & 2033
- Table 4: Global Smart TV Industry Revenue Million Forecast, by Region 2020 & 2033
- Table 5: Global Smart TV Industry Revenue Million Forecast, by Resolution Type 2020 & 2033
- Table 6: Global Smart TV Industry Revenue Million Forecast, by Size (in inches) 2020 & 2033
- Table 7: Global Smart TV Industry Revenue Million Forecast, by Panel Type 2020 & 2033
- Table 8: Global Smart TV Industry Revenue Million Forecast, by Country 2020 & 2033
- Table 9: Global Smart TV Industry Revenue Million Forecast, by Resolution Type 2020 & 2033
- Table 10: Global Smart TV Industry Revenue Million Forecast, by Size (in inches) 2020 & 2033
- Table 11: Global Smart TV Industry Revenue Million Forecast, by Panel Type 2020 & 2033
- Table 12: Global Smart TV Industry Revenue Million Forecast, by Country 2020 & 2033
- Table 13: Global Smart TV Industry Revenue Million Forecast, by Resolution Type 2020 & 2033
- Table 14: Global Smart TV Industry Revenue Million Forecast, by Size (in inches) 2020 & 2033
- Table 15: Global Smart TV Industry Revenue Million Forecast, by Panel Type 2020 & 2033
- Table 16: Global Smart TV Industry Revenue Million Forecast, by Country 2020 & 2033
- Table 17: India Smart TV Industry Revenue (Million) Forecast, by Application 2020 & 2033
- Table 18: Southeast Asia Smart TV Industry Revenue (Million) Forecast, by Application 2020 & 2033
- Table 19: Global Smart TV Industry Revenue Million Forecast, by Resolution Type 2020 & 2033
- Table 20: Global Smart TV Industry Revenue Million Forecast, by Size (in inches) 2020 & 2033
- Table 21: Global Smart TV Industry Revenue Million Forecast, by Panel Type 2020 & 2033
- Table 22: Global Smart TV Industry Revenue Million Forecast, by Country 2020 & 2033
- Table 23: Global Smart TV Industry Revenue Million Forecast, by Resolution Type 2020 & 2033
- Table 24: Global Smart TV Industry Revenue Million Forecast, by Size (in inches) 2020 & 2033
- Table 25: Global Smart TV Industry Revenue Million Forecast, by Panel Type 2020 & 2033
- Table 26: Global Smart TV Industry Revenue Million Forecast, by Country 2020 & 2033
Frequently Asked Questions
1. What is the projected Compound Annual Growth Rate (CAGR) of the Smart TV Industry?
The projected CAGR is approximately 2.19%.
2. Which companies are prominent players in the Smart TV Industry?
Key companies in the market include Hisense, Samsung Electronics Co Ltd, TCL, Xiaomi*List Not Exhaustive, LG Electronics.
3. What are the main segments of the Smart TV Industry?
The market segments include Resolution Type, Size (in inches), Panel Type.
4. Can you provide details about the market size?
The market size is estimated to be USD 275.69 Million as of 2022.
5. What are some drivers contributing to market growth?
Growing Disposable Income Across Emerging Economies; Rising Trend of Video-on-Demand Service.
6. What are the notable trends driving market growth?
QLED is Expected to Witness Significant Growth.
7. Are there any restraints impacting market growth?
The Need for High Investment in Content Creation and Broadcasting; Bandwidth Allocation for 4K Resolution.
8. Can you provide examples of recent developments in the market?
January 2021 - Hisense launched a new product line of laser TV, TriChroma Laser TV, using its cutting-edge display technology. The laser TV will control and package separate lasers to get purer colors for display. TriChroma will have 20% brightness enhancement at the pixel level with a 430-nit picture brightness. The new TV product line will be offered in various screen sizes, including 75-inch to 100-inch giant screens. The company also aims to provide its customers with customized solutions, home fitness screens, and various professional options for different industries.
9. What pricing options are available for accessing the report?
Pricing options include single-user, multi-user, and enterprise licenses priced at USD 4750, USD 5250, and USD 8750 respectively.
10. Is the market size provided in terms of value or volume?
The market size is provided in terms of value, measured in Million.
11. Are there any specific market keywords associated with the report?
Yes, the market keyword associated with the report is "Smart TV Industry," which aids in identifying and referencing the specific market segment covered.
12. How do I determine which pricing option suits my needs best?
The pricing options vary based on user requirements and access needs. Individual users may opt for single-user licenses, while businesses requiring broader access may choose multi-user or enterprise licenses for cost-effective access to the report.
13. Are there any additional resources or data provided in the Smart TV Industry report?
While the report offers comprehensive insights, it's advisable to review the specific contents or supplementary materials provided to ascertain if additional resources or data are available.
14. How can I stay updated on further developments or reports in the Smart TV Industry?
To stay informed about further developments, trends, and reports in the Smart TV Industry, consider subscribing to industry newsletters, following relevant companies and organizations, or regularly checking reputable industry news sources and publications.
Methodology
Step 1 - Identification of Relevant Samples Size from Population Database


Step 2 - Approaches for Defining Global Market Size (Value, Volume* & Price*)

Note*: In applicable scenarios
Step 3 - Data Sources
Primary Research
- Web Analytics
- Survey Reports
- Research Institute
- Latest Research Reports
- Opinion Leaders
Secondary Research
- Annual Reports
- White Paper
- Latest Press Release
- Industry Association
- Paid Database
- Investor Presentations

Step 4 - Data Triangulation
Involves using different sources of information in order to increase the validity of a study
These sources are likely to be stakeholders in a program - participants, other researchers, program staff, other community members, and so on.
Then we put all data in single framework & apply various statistical tools to find out the dynamic on the market.
During the analysis stage, feedback from the stakeholder groups would be compared to determine areas of agreement as well as areas of divergence