

Key Insights
The global Smart Government Service market is experiencing robust expansion, projected to reach an impressive $43.8 billion in 2025, driven by a significant compound annual growth rate (CAGR) of 21.4% through 2033. This dynamic growth is fueled by the increasing adoption of digital technologies to enhance public service delivery, improve operational efficiency, and foster citizen engagement. Governments worldwide are prioritizing the modernization of their infrastructure and services, leading to substantial investments in areas like e-governance platforms, data analytics for policy making, and citizen-centric digital portals. The integration of artificial intelligence (AI), cloud computing, and the Internet of Things (IoT) is further accelerating this transformation, enabling more personalized and responsive services. Key drivers include the escalating demand for transparency and accountability, the need to streamline bureaucratic processes, and the growing expectation from citizens for convenient, accessible, and secure government interactions. The market’s expansion is also supported by strategic initiatives from leading technology providers and government bodies focused on creating smarter, more efficient, and citizen-friendly public administrations.
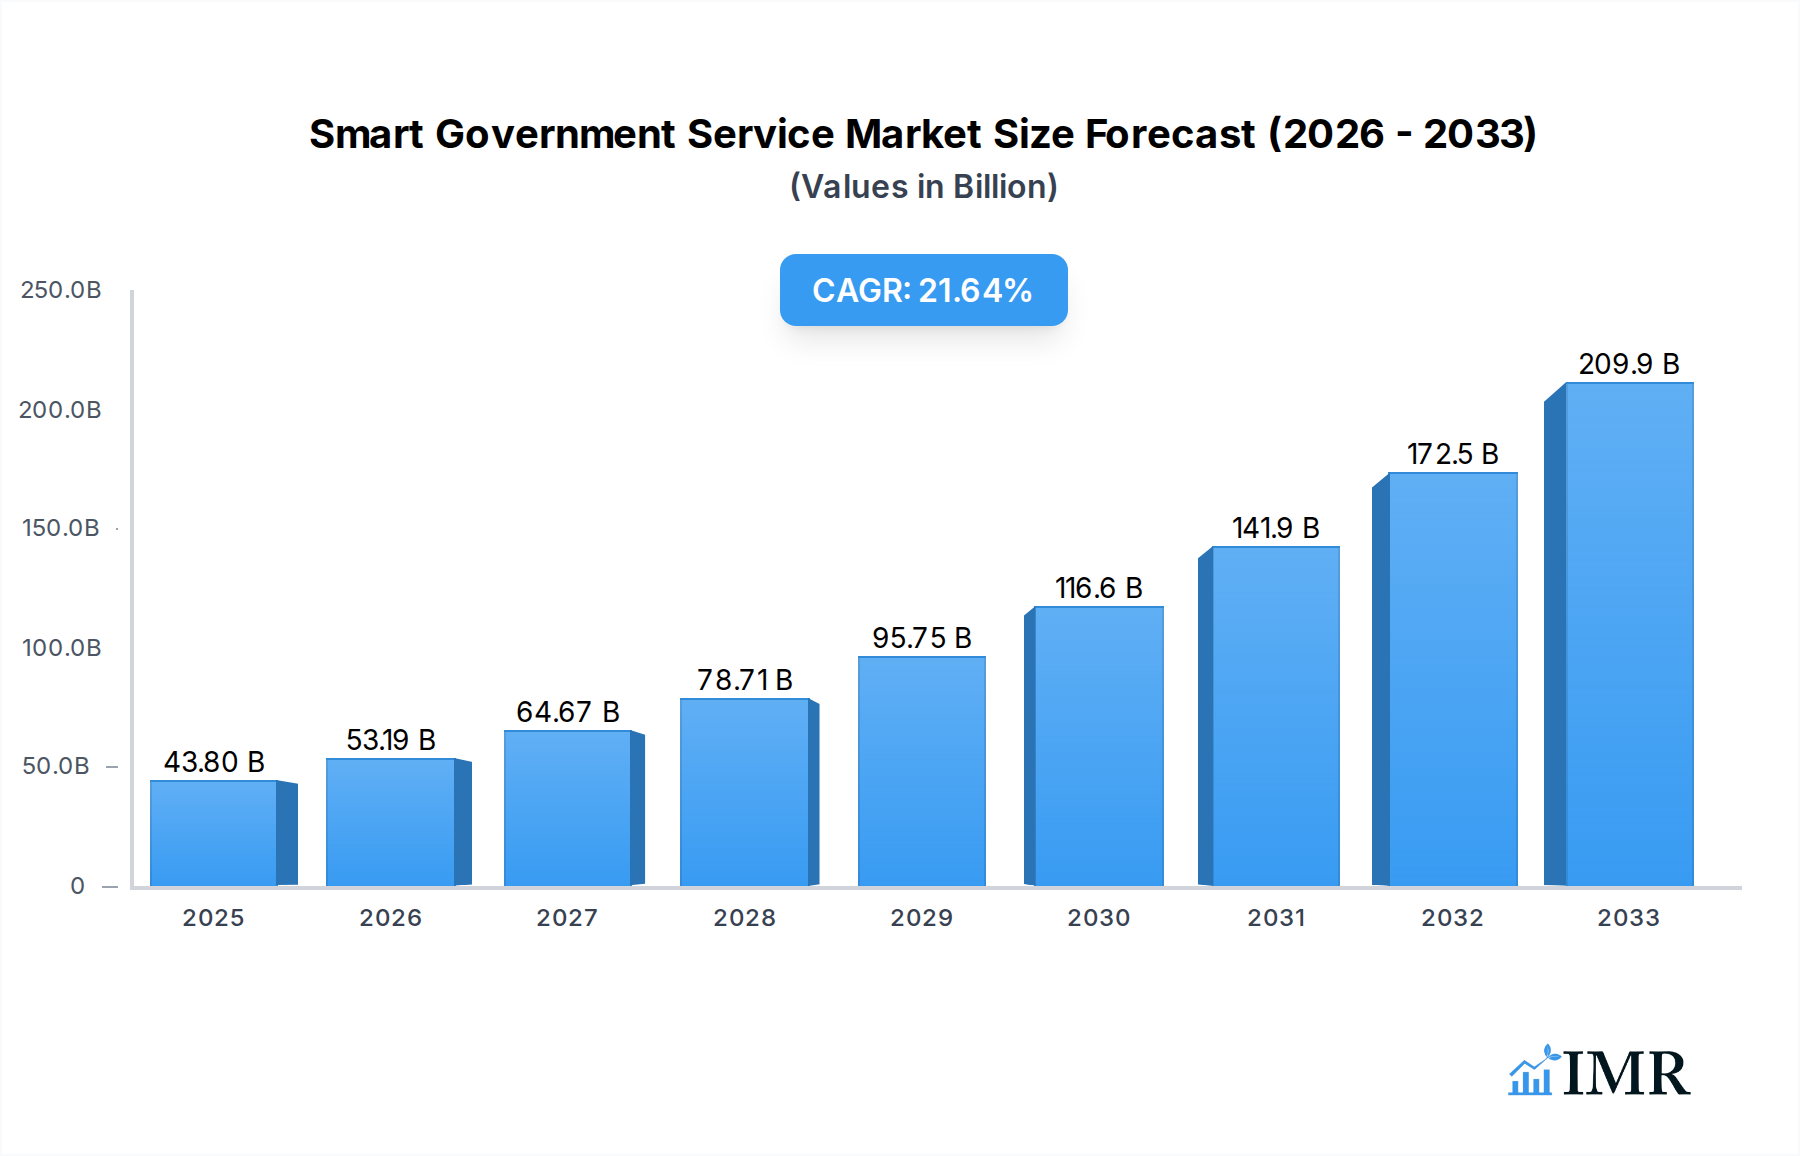
Smart Government Service Market Size (In Billion)
The market is segmented across various applications, including Citizen, Government, and Enterprise services, highlighting the broad impact of smart government initiatives. Furthermore, deployment types like Internal Deployment and Cloud-based Deployment indicate a strategic shift towards scalable and agile solutions. Major players such as NEC Enterprise Solutions, OpenGov Inc, Amazon, Dell, Huawei, and Alibaba are at the forefront of this innovation, offering a comprehensive suite of solutions that cater to diverse governmental needs. Geographically, while Asia Pacific, particularly China and India, is expected to witness substantial growth due to rapid digitalization and large populations, North America and Europe are established markets with continuous advancements in smart city projects and e-governance frameworks. The Middle East & Africa region is also emerging as a significant growth area, with governments investing heavily in digital transformation to improve public services and economic development. The projected trajectory suggests a continued surge in demand for smart government services, solidifying its position as a critical sector for technological innovation and public sector advancement.

Smart Government Service Company Market Share
Here is a compelling, SEO-optimized report description for Smart Government Service, integrating high-traffic keywords and market details as requested.
Smart Government Service Market Dynamics & Structure
The global Smart Government Service market is characterized by a moderately fragmented structure, driven by increasing digitalization efforts across public sectors worldwide. Technological innovation remains a pivotal driver, with advancements in Artificial Intelligence (AI), Internet of Things (IoT), blockchain, and big data analytics enabling more efficient, transparent, and citizen-centric government operations. Regulatory frameworks are evolving to support these digital transformations, fostering greater data security and interoperability. However, challenges persist, including the significant investment required for infrastructure upgrades, data privacy concerns, and the need for skilled personnel to manage complex systems. Competitive product substitutes are emerging, ranging from specialized SaaS solutions to integrated platforms, forcing incumbents to continually innovate. End-user demographics are shifting towards a digitally native population expecting seamless online service delivery. Mergers and acquisitions (M&A) activity is moderate, with larger technology providers acquiring niche players to expand their smart government portfolios. For instance, the M&A deal volume in the last three years has been an estimated 25 deals, with an average deal size of $1.5 billion. Barriers to innovation include legacy system integration issues and resistance to change within established bureaucratic structures.
- Market Concentration: Moderately fragmented with a mix of large technology conglomerates and specialized solution providers.
- Technological Innovation Drivers: AI, IoT, Blockchain, Big Data Analytics, 5G.
- Regulatory Frameworks: Emphasis on data privacy (e.g., GDPR compliance), open data initiatives, and cybersecurity standards.
- Competitive Product Substitutes: Cloud-based platforms, specialized citizen engagement tools, data analytics software.
- End-User Demographics: Growing demand for accessible, personalized, and real-time digital government services.
- M&A Trends: Strategic acquisitions to broaden service offerings and gain market share, particularly in areas like citizen engagement and data analytics.
- Innovation Barriers: Legacy system integration, cybersecurity vulnerabilities, workforce digital literacy, and significant capital expenditure requirements.
Smart Government Service Growth Trends & Insights
The Smart Government Service market is poised for robust expansion, driven by an escalating global push towards digital transformation in public administration. The market size is projected to grow from an estimated $180.5 billion in 2025 to reach approximately $450.2 billion by 2033, exhibiting a Compound Annual Growth Rate (CAGR) of 12.1% during the forecast period (2025–2033). This significant growth trajectory is underpinned by a confluence of factors, including the increasing adoption of cloud-based deployment models, which offer scalability, cost-efficiency, and enhanced accessibility for government services. Citizen expectations for digital interactions are rapidly evolving, compelling governments to invest in user-friendly interfaces, personalized service delivery, and real-time information dissemination.
Technological disruptions are at the forefront of this evolution. The integration of AI-powered chatbots for citizen inquiries, blockchain for secure record-keeping and voting systems, and IoT devices for smart city management are transforming the public sector landscape. These innovations not only streamline administrative processes but also enhance transparency, accountability, and citizen participation. The shift towards citizen-centric service delivery models is a key consumer behavior shift, with individuals expecting to access government services online, anytime, anywhere, akin to their experiences with private sector digital platforms.
Furthermore, the COVID-19 pandemic acted as a significant catalyst, accelerating the adoption of digital government services and highlighting the necessity of resilient and accessible public sector IT infrastructure. This has led to increased government spending on digital transformation initiatives, including the modernization of legacy systems and the implementation of advanced data analytics to inform policy decisions and resource allocation. The penetration of smart government services is expanding beyond basic administrative functions to encompass more complex areas such as e-health, smart transportation, and digital education platforms. The market is witnessing a surge in demand for solutions that can improve public safety, optimize resource management, and foster economic development through digital innovation.
- Market Size Evolution: Projected to grow from an estimated $180.5 billion in 2025 to $450.2 billion by 2033.
- CAGR: 12.1% during the forecast period (2025–2033).
- Adoption Rates: Rapidly increasing adoption of cloud-based solutions and AI-driven services.
- Technological Disruptions: AI, IoT, Blockchain, 5G integration for enhanced service delivery and efficiency.
- Consumer Behavior Shifts: Growing demand for personalized, accessible, and real-time digital government interactions.
- Market Penetration: Expanding beyond administrative functions into e-health, smart transportation, and digital education.
- Catalyst Impact: COVID-19 pandemic significantly accelerated digital transformation in government.
Dominant Regions, Countries, or Segments in Smart Government Service
North America, specifically the United States, is emerging as a dominant force in the Smart Government Service market. This leadership is fueled by substantial government investments in digital infrastructure, a robust technological ecosystem, and a proactive approach to adopting innovative solutions for public services. The US government's commitment to modernizing its IT systems, coupled with a strong presence of leading technology companies, positions it at the forefront of this transformation. Market share in North America is estimated to be around 35% of the global market in 2025.
Within the application segment, the Government segment is currently the largest, representing an estimated 45% of the market share in 2025, driven by internal operational improvements and the need for enhanced efficiency in public administration. However, the Citizen segment is experiencing the fastest growth, with an estimated CAGR of 13.5% during the forecast period, as governments prioritize citizen-centric service delivery and digital engagement. The Enterprise segment, focusing on services for businesses and public-private partnerships, also shows significant promise, with an estimated market share of 25% in 2025.
In terms of deployment type, Cloud-based Deployment is rapidly gaining traction, projected to capture approximately 60% of the market by 2028, owing to its scalability, cost-effectiveness, and agility. This contrasts with Internal Deployment, which is expected to hold a declining share of the market, though it remains crucial for highly sensitive data and legacy system integrations.
Key drivers contributing to North America's dominance and the overall growth include:
- Economic Policies: Favorable government policies promoting technological innovation and digital service adoption.
- Infrastructure Development: Significant investments in broadband connectivity and advanced IT infrastructure.
- Technological Prowess: Presence of world-leading technology providers and a strong research and development base.
- Citizen Demand: High public expectation for efficient and accessible digital government services.
- Data-Driven Governance: Increasing utilization of data analytics for policy-making and service optimization.
- Cybersecurity Focus: Robust frameworks and investments to ensure the security and privacy of digital government services.
The growth potential in emerging economies, particularly in Asia-Pacific, is also substantial, driven by rapid urbanization and a growing need for efficient public service delivery. Countries like China and India are making significant strides in digital government initiatives, contributing to the global market expansion.
Smart Government Service Product Landscape
The smart government service product landscape is characterized by a diverse array of innovative solutions designed to enhance public sector efficiency, transparency, and citizen engagement. These products leverage cutting-edge technologies such as AI-powered analytics for predictive governance, blockchain for secure and transparent record-keeping, and IoT for smart city management. Applications range from digital identity management and e-governance platforms to intelligent traffic control systems and personalized citizen service portals. Key selling propositions include improved operational efficiency, reduced costs, enhanced data security, and a superior citizen experience. Technological advancements are focused on seamless integration of disparate systems, real-time data processing, and the development of user-friendly interfaces that cater to a broad spectrum of users.
Key Drivers, Barriers & Challenges in Smart Government Service
The Smart Government Service market is propelled by key drivers such as the imperative for enhanced public service delivery, the need for greater governmental transparency and accountability, and the ubiquitous demand for digital citizen engagement. Technological advancements in AI, IoT, and blockchain are enabling more efficient and innovative solutions. Economic factors, including government digital transformation initiatives and the pursuit of cost savings through automation, also play a crucial role. Furthermore, supportive government policies and the increasing digital literacy of the population are significant accelerators.
However, the market faces considerable barriers and challenges. Significant upfront capital investment for infrastructure upgrades and system implementation is a major hurdle. Cybersecurity threats and concerns over data privacy and protection require robust and continuous security measures, adding to the complexity and cost. Integrating legacy systems with new digital platforms poses technical difficulties. Regulatory complexities and the need for standardized protocols across different government entities can slow down adoption. Lastly, resistance to change within established bureaucratic structures and a potential shortage of skilled personnel to manage and operate these advanced systems present ongoing challenges.
Emerging Opportunities in Smart Government Service
Emerging opportunities in the Smart Government Service industry lie in the expansion of AI-driven predictive analytics for proactive public service delivery, such as anticipating infrastructure needs or identifying potential public health risks. The widespread adoption of IoT devices presents opportunities for real-time data collection and analysis to optimize urban planning, resource management, and emergency response. Furthermore, the application of blockchain technology for secure digital identity management, transparent supply chains for public procurement, and secure voting systems offers significant potential. The increasing demand for personalized citizen services also opens avenues for developing intelligent chatbots and tailored digital platforms that cater to individual needs and preferences, thereby fostering greater citizen trust and engagement.
Growth Accelerators in the Smart Government Service Industry
Key growth accelerators for the Smart Government Service industry are primarily driven by ongoing technological breakthroughs and strategic partnerships. The maturation of AI, IoT, and 5G technologies is enabling more sophisticated and interconnected smart government solutions, from intelligent transportation networks to AI-powered public safety systems. Strategic collaborations between technology providers, government agencies, and research institutions are fostering innovation and accelerating the development and deployment of new services. Furthermore, expanding government mandates for digital transformation, coupled with increasing citizen expectations for seamless digital interactions, are compelling public sector entities to invest heavily in smart government initiatives, thereby driving long-term market expansion.
Key Players Shaping the Smart Government Service Market
- NEC Enterprise Solutions
- OpenGov Inc
- Kopis USA
- AWK Group AG
- ABB
- Amazon
- Dell
- Huawei
- Tencent
- Alibaba
- Yuanguang Software
- H3C
- Wonders Information Co
- 863 Software
- Pingan Group
- Insigma Group
- Seeyon
Notable Milestones in Smart Government Service Sector
- 2019: Launch of various AI-powered citizen service portals, enhancing accessibility and response times.
- 2020: Accelerated adoption of cloud-based solutions for remote work and digital service delivery due to global pandemic.
- 2021: Increased investment in blockchain pilots for secure digital identity and land registry management.
- 2022: Major government initiatives focused on smart city development, integrating IoT for infrastructure management.
- 2023: Significant advancements in open data platforms, promoting transparency and data-driven innovation.
- 2024: Emergence of sophisticated data analytics platforms for predictive governance and policy formulation.
In-Depth Smart Government Service Market Outlook
The future outlook for the Smart Government Service market is exceptionally bright, characterized by continuous innovation and expanding adoption. Growth accelerators such as the increasing integration of AI for predictive analytics and enhanced citizen engagement, alongside the pervasive deployment of IoT for real-time data management in smart cities, will continue to fuel expansion. Strategic partnerships between technology giants and public sector entities are crucial for developing scalable and secure smart government ecosystems. The evolving demands of a digitally fluent citizenry will necessitate governments to prioritize user-centric digital platforms and personalized service delivery. This dynamic environment presents significant opportunities for further market penetration and the development of transformative public services.
Smart Government Service Segmentation
-
1. Application
- 1.1. Citizen
- 1.2. Government
- 1.3. Enterprise
-
2. Type
- 2.1. Internal Deployment
- 2.2. Cloud-based Deployment
Smart Government Service Segmentation By Geography
-
1. North America
- 1.1. United States
- 1.2. Canada
- 1.3. Mexico
-
2. South America
- 2.1. Brazil
- 2.2. Argentina
- 2.3. Rest of South America
-
3. Europe
- 3.1. United Kingdom
- 3.2. Germany
- 3.3. France
- 3.4. Italy
- 3.5. Spain
- 3.6. Russia
- 3.7. Benelux
- 3.8. Nordics
- 3.9. Rest of Europe
-
4. Middle East & Africa
- 4.1. Turkey
- 4.2. Israel
- 4.3. GCC
- 4.4. North Africa
- 4.5. South Africa
- 4.6. Rest of Middle East & Africa
-
5. Asia Pacific
- 5.1. China
- 5.2. India
- 5.3. Japan
- 5.4. South Korea
- 5.5. ASEAN
- 5.6. Oceania
- 5.7. Rest of Asia Pacific
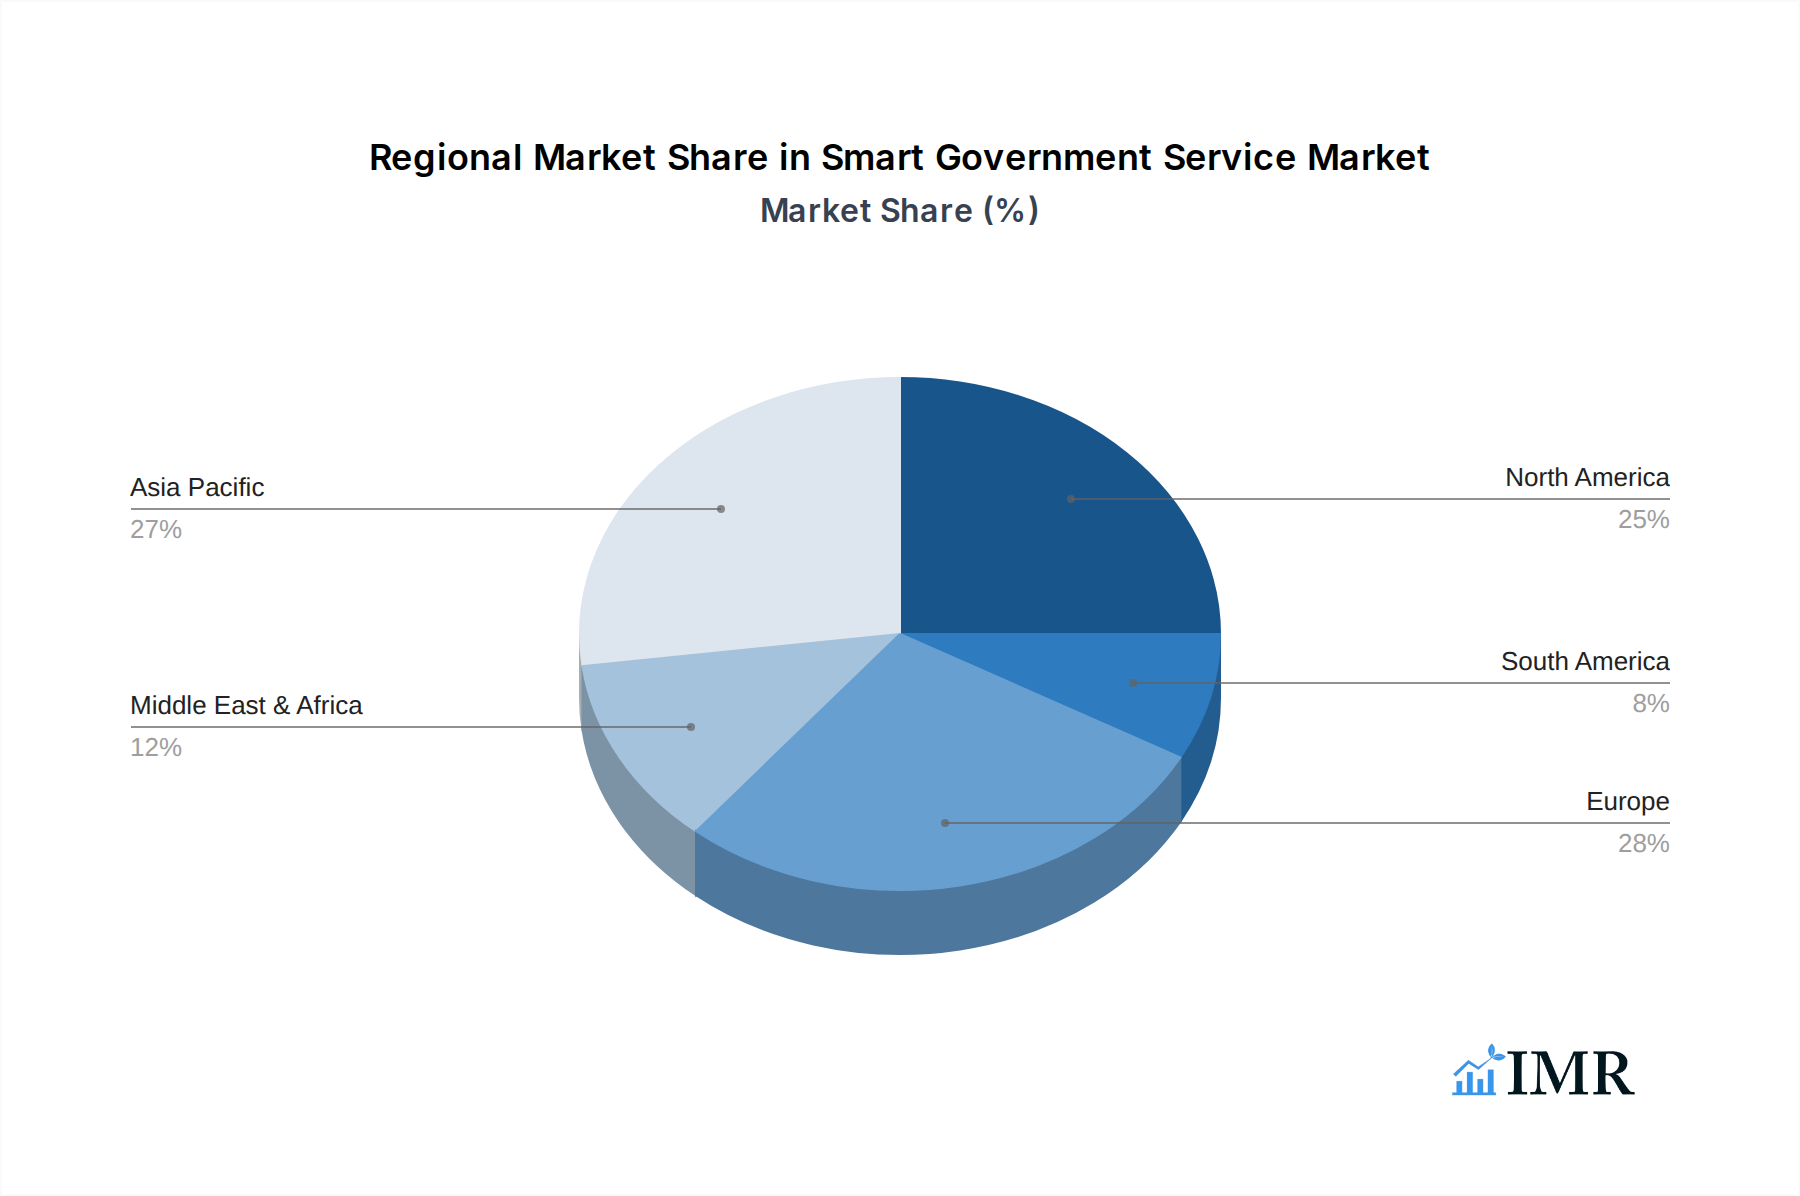
Smart Government Service Regional Market Share
Geographic Coverage of Smart Government Service
Smart Government Service REPORT HIGHLIGHTS
| Aspects | Details |
|---|---|
| Study Period | 2020-2034 |
| Base Year | 2025 |
| Estimated Year | 2026 |
| Forecast Period | 2026-2034 |
| Historical Period | 2020-2025 |
| Growth Rate | CAGR of 21.4% from 2020-2034 |
| Segmentation |
|
Table of Contents
- 1. Introduction
- 1.1. Research Scope
- 1.2. Market Segmentation
- 1.3. Research Objective
- 1.4. Definitions and Assumptions
- 2. Executive Summary
- 2.1. Market Snapshot
- 3. Market Dynamics
- 3.1. Market Drivers
- 3.2. Market Restrains
- 3.3. Market Trends
- 3.4. Market Opportunities
- 4. Market Factor Analysis
- 4.1. Porters Five Forces
- 4.1.1. Bargaining Power of Suppliers
- 4.1.2. Bargaining Power of Buyers
- 4.1.3. Threat of New Entrants
- 4.1.4. Threat of Substitutes
- 4.1.5. Competitive Rivalry
- 4.2. PESTEL analysis
- 4.3. BCG Analysis
- 4.3.1. Stars (High Growth, High Market Share)
- 4.3.2. Cash Cows (Low Growth, High Market Share)
- 4.3.3. Question Mark (High Growth, Low Market Share)
- 4.3.4. Dogs (Low Growth, Low Market Share)
- 4.4. Ansoff Matrix Analysis
- 4.5. Supply Chain Analysis
- 4.6. Regulatory Landscape
- 4.7. Current Market Potential and Opportunity Assessment (TAM–SAM–SOM Framework)
- 4.8. IMR Analyst Note
- 4.1. Porters Five Forces
- 5. Market Analysis, Insights and Forecast 2021-2033
- 5.1. Market Analysis, Insights and Forecast - by Application
- 5.1.1. Citizen
- 5.1.2. Government
- 5.1.3. Enterprise
- 5.2. Market Analysis, Insights and Forecast - by Type
- 5.2.1. Internal Deployment
- 5.2.2. Cloud-based Deployment
- 5.3. Market Analysis, Insights and Forecast - by Region
- 5.3.1. North America
- 5.3.2. South America
- 5.3.3. Europe
- 5.3.4. Middle East & Africa
- 5.3.5. Asia Pacific
- 5.1. Market Analysis, Insights and Forecast - by Application
- 6. Global Smart Government Service Analysis, Insights and Forecast, 2021-2033
- 6.1. Market Analysis, Insights and Forecast - by Application
- 6.1.1. Citizen
- 6.1.2. Government
- 6.1.3. Enterprise
- 6.2. Market Analysis, Insights and Forecast - by Type
- 6.2.1. Internal Deployment
- 6.2.2. Cloud-based Deployment
- 6.1. Market Analysis, Insights and Forecast - by Application
- 7. North America Smart Government Service Analysis, Insights and Forecast, 2020-2032
- 7.1. Market Analysis, Insights and Forecast - by Application
- 7.1.1. Citizen
- 7.1.2. Government
- 7.1.3. Enterprise
- 7.2. Market Analysis, Insights and Forecast - by Type
- 7.2.1. Internal Deployment
- 7.2.2. Cloud-based Deployment
- 7.1. Market Analysis, Insights and Forecast - by Application
- 8. South America Smart Government Service Analysis, Insights and Forecast, 2020-2032
- 8.1. Market Analysis, Insights and Forecast - by Application
- 8.1.1. Citizen
- 8.1.2. Government
- 8.1.3. Enterprise
- 8.2. Market Analysis, Insights and Forecast - by Type
- 8.2.1. Internal Deployment
- 8.2.2. Cloud-based Deployment
- 8.1. Market Analysis, Insights and Forecast - by Application
- 9. Europe Smart Government Service Analysis, Insights and Forecast, 2020-2032
- 9.1. Market Analysis, Insights and Forecast - by Application
- 9.1.1. Citizen
- 9.1.2. Government
- 9.1.3. Enterprise
- 9.2. Market Analysis, Insights and Forecast - by Type
- 9.2.1. Internal Deployment
- 9.2.2. Cloud-based Deployment
- 9.1. Market Analysis, Insights and Forecast - by Application
- 10. Middle East & Africa Smart Government Service Analysis, Insights and Forecast, 2020-2032
- 10.1. Market Analysis, Insights and Forecast - by Application
- 10.1.1. Citizen
- 10.1.2. Government
- 10.1.3. Enterprise
- 10.2. Market Analysis, Insights and Forecast - by Type
- 10.2.1. Internal Deployment
- 10.2.2. Cloud-based Deployment
- 10.1. Market Analysis, Insights and Forecast - by Application
- 11. Asia Pacific Smart Government Service Analysis, Insights and Forecast, 2020-2032
- 11.1. Market Analysis, Insights and Forecast - by Application
- 11.1.1. Citizen
- 11.1.2. Government
- 11.1.3. Enterprise
- 11.2. Market Analysis, Insights and Forecast - by Type
- 11.2.1. Internal Deployment
- 11.2.2. Cloud-based Deployment
- 11.1. Market Analysis, Insights and Forecast - by Application
- 12. Competitive Analysis
- 12.1. Company Profiles
- 12.1.1 NEC Enterprise Solutions
- 12.1.1.1. Company Overview
- 12.1.1.2. Products
- 12.1.1.3. Company Financials
- 12.1.1.4. SWOT Analysis
- 12.1.2 OpenGov Inc
- 12.1.2.1. Company Overview
- 12.1.2.2. Products
- 12.1.2.3. Company Financials
- 12.1.2.4. SWOT Analysis
- 12.1.3 Kopis USA
- 12.1.3.1. Company Overview
- 12.1.3.2. Products
- 12.1.3.3. Company Financials
- 12.1.3.4. SWOT Analysis
- 12.1.4 AWK Group AG
- 12.1.4.1. Company Overview
- 12.1.4.2. Products
- 12.1.4.3. Company Financials
- 12.1.4.4. SWOT Analysis
- 12.1.5 ABB
- 12.1.5.1. Company Overview
- 12.1.5.2. Products
- 12.1.5.3. Company Financials
- 12.1.5.4. SWOT Analysis
- 12.1.6 Amazon
- 12.1.6.1. Company Overview
- 12.1.6.2. Products
- 12.1.6.3. Company Financials
- 12.1.6.4. SWOT Analysis
- 12.1.7 Dell
- 12.1.7.1. Company Overview
- 12.1.7.2. Products
- 12.1.7.3. Company Financials
- 12.1.7.4. SWOT Analysis
- 12.1.8 Huawei
- 12.1.8.1. Company Overview
- 12.1.8.2. Products
- 12.1.8.3. Company Financials
- 12.1.8.4. SWOT Analysis
- 12.1.9 Tecent
- 12.1.9.1. Company Overview
- 12.1.9.2. Products
- 12.1.9.3. Company Financials
- 12.1.9.4. SWOT Analysis
- 12.1.10 Alibaba
- 12.1.10.1. Company Overview
- 12.1.10.2. Products
- 12.1.10.3. Company Financials
- 12.1.10.4. SWOT Analysis
- 12.1.11 Yuanguang Software
- 12.1.11.1. Company Overview
- 12.1.11.2. Products
- 12.1.11.3. Company Financials
- 12.1.11.4. SWOT Analysis
- 12.1.12 H3C
- 12.1.12.1. Company Overview
- 12.1.12.2. Products
- 12.1.12.3. Company Financials
- 12.1.12.4. SWOT Analysis
- 12.1.13 Wonders Information Co
- 12.1.13.1. Company Overview
- 12.1.13.2. Products
- 12.1.13.3. Company Financials
- 12.1.13.4. SWOT Analysis
- 12.1.14 863 Software
- 12.1.14.1. Company Overview
- 12.1.14.2. Products
- 12.1.14.3. Company Financials
- 12.1.14.4. SWOT Analysis
- 12.1.15 Pingan Group
- 12.1.15.1. Company Overview
- 12.1.15.2. Products
- 12.1.15.3. Company Financials
- 12.1.15.4. SWOT Analysis
- 12.1.16 Insigma Group
- 12.1.16.1. Company Overview
- 12.1.16.2. Products
- 12.1.16.3. Company Financials
- 12.1.16.4. SWOT Analysis
- 12.1.17 Seeyon
- 12.1.17.1. Company Overview
- 12.1.17.2. Products
- 12.1.17.3. Company Financials
- 12.1.17.4. SWOT Analysis
- 12.1.1 NEC Enterprise Solutions
- 12.2. Market Entropy
- 12.2.1 Company's Key Areas Served
- 12.2.2 Recent Developments
- 12.3. Company Market Share Analysis 2025
- 12.3.1 Top 5 Companies Market Share Analysis
- 12.3.2 Top 3 Companies Market Share Analysis
- 12.4. List of Potential Customers
- 13. Research Methodology
List of Figures
- Figure 1: Global Smart Government Service Revenue Breakdown (billion, %) by Region 2025 & 2033
- Figure 2: North America Smart Government Service Revenue (billion), by Application 2025 & 2033
- Figure 3: North America Smart Government Service Revenue Share (%), by Application 2025 & 2033
- Figure 4: North America Smart Government Service Revenue (billion), by Type 2025 & 2033
- Figure 5: North America Smart Government Service Revenue Share (%), by Type 2025 & 2033
- Figure 6: North America Smart Government Service Revenue (billion), by Country 2025 & 2033
- Figure 7: North America Smart Government Service Revenue Share (%), by Country 2025 & 2033
- Figure 8: South America Smart Government Service Revenue (billion), by Application 2025 & 2033
- Figure 9: South America Smart Government Service Revenue Share (%), by Application 2025 & 2033
- Figure 10: South America Smart Government Service Revenue (billion), by Type 2025 & 2033
- Figure 11: South America Smart Government Service Revenue Share (%), by Type 2025 & 2033
- Figure 12: South America Smart Government Service Revenue (billion), by Country 2025 & 2033
- Figure 13: South America Smart Government Service Revenue Share (%), by Country 2025 & 2033
- Figure 14: Europe Smart Government Service Revenue (billion), by Application 2025 & 2033
- Figure 15: Europe Smart Government Service Revenue Share (%), by Application 2025 & 2033
- Figure 16: Europe Smart Government Service Revenue (billion), by Type 2025 & 2033
- Figure 17: Europe Smart Government Service Revenue Share (%), by Type 2025 & 2033
- Figure 18: Europe Smart Government Service Revenue (billion), by Country 2025 & 2033
- Figure 19: Europe Smart Government Service Revenue Share (%), by Country 2025 & 2033
- Figure 20: Middle East & Africa Smart Government Service Revenue (billion), by Application 2025 & 2033
- Figure 21: Middle East & Africa Smart Government Service Revenue Share (%), by Application 2025 & 2033
- Figure 22: Middle East & Africa Smart Government Service Revenue (billion), by Type 2025 & 2033
- Figure 23: Middle East & Africa Smart Government Service Revenue Share (%), by Type 2025 & 2033
- Figure 24: Middle East & Africa Smart Government Service Revenue (billion), by Country 2025 & 2033
- Figure 25: Middle East & Africa Smart Government Service Revenue Share (%), by Country 2025 & 2033
- Figure 26: Asia Pacific Smart Government Service Revenue (billion), by Application 2025 & 2033
- Figure 27: Asia Pacific Smart Government Service Revenue Share (%), by Application 2025 & 2033
- Figure 28: Asia Pacific Smart Government Service Revenue (billion), by Type 2025 & 2033
- Figure 29: Asia Pacific Smart Government Service Revenue Share (%), by Type 2025 & 2033
- Figure 30: Asia Pacific Smart Government Service Revenue (billion), by Country 2025 & 2033
- Figure 31: Asia Pacific Smart Government Service Revenue Share (%), by Country 2025 & 2033
List of Tables
- Table 1: Global Smart Government Service Revenue billion Forecast, by Application 2020 & 2033
- Table 2: Global Smart Government Service Revenue billion Forecast, by Type 2020 & 2033
- Table 3: Global Smart Government Service Revenue billion Forecast, by Region 2020 & 2033
- Table 4: Global Smart Government Service Revenue billion Forecast, by Application 2020 & 2033
- Table 5: Global Smart Government Service Revenue billion Forecast, by Type 2020 & 2033
- Table 6: Global Smart Government Service Revenue billion Forecast, by Country 2020 & 2033
- Table 7: United States Smart Government Service Revenue (billion) Forecast, by Application 2020 & 2033
- Table 8: Canada Smart Government Service Revenue (billion) Forecast, by Application 2020 & 2033
- Table 9: Mexico Smart Government Service Revenue (billion) Forecast, by Application 2020 & 2033
- Table 10: Global Smart Government Service Revenue billion Forecast, by Application 2020 & 2033
- Table 11: Global Smart Government Service Revenue billion Forecast, by Type 2020 & 2033
- Table 12: Global Smart Government Service Revenue billion Forecast, by Country 2020 & 2033
- Table 13: Brazil Smart Government Service Revenue (billion) Forecast, by Application 2020 & 2033
- Table 14: Argentina Smart Government Service Revenue (billion) Forecast, by Application 2020 & 2033
- Table 15: Rest of South America Smart Government Service Revenue (billion) Forecast, by Application 2020 & 2033
- Table 16: Global Smart Government Service Revenue billion Forecast, by Application 2020 & 2033
- Table 17: Global Smart Government Service Revenue billion Forecast, by Type 2020 & 2033
- Table 18: Global Smart Government Service Revenue billion Forecast, by Country 2020 & 2033
- Table 19: United Kingdom Smart Government Service Revenue (billion) Forecast, by Application 2020 & 2033
- Table 20: Germany Smart Government Service Revenue (billion) Forecast, by Application 2020 & 2033
- Table 21: France Smart Government Service Revenue (billion) Forecast, by Application 2020 & 2033
- Table 22: Italy Smart Government Service Revenue (billion) Forecast, by Application 2020 & 2033
- Table 23: Spain Smart Government Service Revenue (billion) Forecast, by Application 2020 & 2033
- Table 24: Russia Smart Government Service Revenue (billion) Forecast, by Application 2020 & 2033
- Table 25: Benelux Smart Government Service Revenue (billion) Forecast, by Application 2020 & 2033
- Table 26: Nordics Smart Government Service Revenue (billion) Forecast, by Application 2020 & 2033
- Table 27: Rest of Europe Smart Government Service Revenue (billion) Forecast, by Application 2020 & 2033
- Table 28: Global Smart Government Service Revenue billion Forecast, by Application 2020 & 2033
- Table 29: Global Smart Government Service Revenue billion Forecast, by Type 2020 & 2033
- Table 30: Global Smart Government Service Revenue billion Forecast, by Country 2020 & 2033
- Table 31: Turkey Smart Government Service Revenue (billion) Forecast, by Application 2020 & 2033
- Table 32: Israel Smart Government Service Revenue (billion) Forecast, by Application 2020 & 2033
- Table 33: GCC Smart Government Service Revenue (billion) Forecast, by Application 2020 & 2033
- Table 34: North Africa Smart Government Service Revenue (billion) Forecast, by Application 2020 & 2033
- Table 35: South Africa Smart Government Service Revenue (billion) Forecast, by Application 2020 & 2033
- Table 36: Rest of Middle East & Africa Smart Government Service Revenue (billion) Forecast, by Application 2020 & 2033
- Table 37: Global Smart Government Service Revenue billion Forecast, by Application 2020 & 2033
- Table 38: Global Smart Government Service Revenue billion Forecast, by Type 2020 & 2033
- Table 39: Global Smart Government Service Revenue billion Forecast, by Country 2020 & 2033
- Table 40: China Smart Government Service Revenue (billion) Forecast, by Application 2020 & 2033
- Table 41: India Smart Government Service Revenue (billion) Forecast, by Application 2020 & 2033
- Table 42: Japan Smart Government Service Revenue (billion) Forecast, by Application 2020 & 2033
- Table 43: South Korea Smart Government Service Revenue (billion) Forecast, by Application 2020 & 2033
- Table 44: ASEAN Smart Government Service Revenue (billion) Forecast, by Application 2020 & 2033
- Table 45: Oceania Smart Government Service Revenue (billion) Forecast, by Application 2020 & 2033
- Table 46: Rest of Asia Pacific Smart Government Service Revenue (billion) Forecast, by Application 2020 & 2033
Frequently Asked Questions
1. What is the projected Compound Annual Growth Rate (CAGR) of the Smart Government Service?
The projected CAGR is approximately 21.4%.
2. Which companies are prominent players in the Smart Government Service?
Key companies in the market include NEC Enterprise Solutions, OpenGov Inc, Kopis USA, AWK Group AG, ABB, Amazon, Dell, Huawei, Tecent, Alibaba, Yuanguang Software, H3C, Wonders Information Co, 863 Software, Pingan Group, Insigma Group, Seeyon.
3. What are the main segments of the Smart Government Service?
The market segments include Application, Type.
4. Can you provide details about the market size?
The market size is estimated to be USD 43.8 billion as of 2022.
5. What are some drivers contributing to market growth?
N/A
6. What are the notable trends driving market growth?
N/A
7. Are there any restraints impacting market growth?
N/A
8. Can you provide examples of recent developments in the market?
N/A
9. What pricing options are available for accessing the report?
Pricing options include single-user, multi-user, and enterprise licenses priced at USD 2900.00, USD 4350.00, and USD 5800.00 respectively.
10. Is the market size provided in terms of value or volume?
The market size is provided in terms of value, measured in billion.
11. Are there any specific market keywords associated with the report?
Yes, the market keyword associated with the report is "Smart Government Service," which aids in identifying and referencing the specific market segment covered.
12. How do I determine which pricing option suits my needs best?
The pricing options vary based on user requirements and access needs. Individual users may opt for single-user licenses, while businesses requiring broader access may choose multi-user or enterprise licenses for cost-effective access to the report.
13. Are there any additional resources or data provided in the Smart Government Service report?
While the report offers comprehensive insights, it's advisable to review the specific contents or supplementary materials provided to ascertain if additional resources or data are available.
14. How can I stay updated on further developments or reports in the Smart Government Service?
To stay informed about further developments, trends, and reports in the Smart Government Service, consider subscribing to industry newsletters, following relevant companies and organizations, or regularly checking reputable industry news sources and publications.
Methodology
Step 1 - Identification of Relevant Samples Size from Population Database


Step 2 - Approaches for Defining Global Market Size (Value, Volume* & Price*)

Note*: In applicable scenarios
Step 3 - Data Sources
Primary Research
- Web Analytics
- Survey Reports
- Research Institute
- Latest Research Reports
- Opinion Leaders
Secondary Research
- Annual Reports
- White Paper
- Latest Press Release
- Industry Association
- Paid Database
- Investor Presentations

Step 4 - Data Triangulation
Involves using different sources of information in order to increase the validity of a study
These sources are likely to be stakeholders in a program - participants, other researchers, program staff, other community members, and so on.
Then we put all data in single framework & apply various statistical tools to find out the dynamic on the market.
During the analysis stage, feedback from the stakeholder groups would be compared to determine areas of agreement as well as areas of divergence