

Key Insights
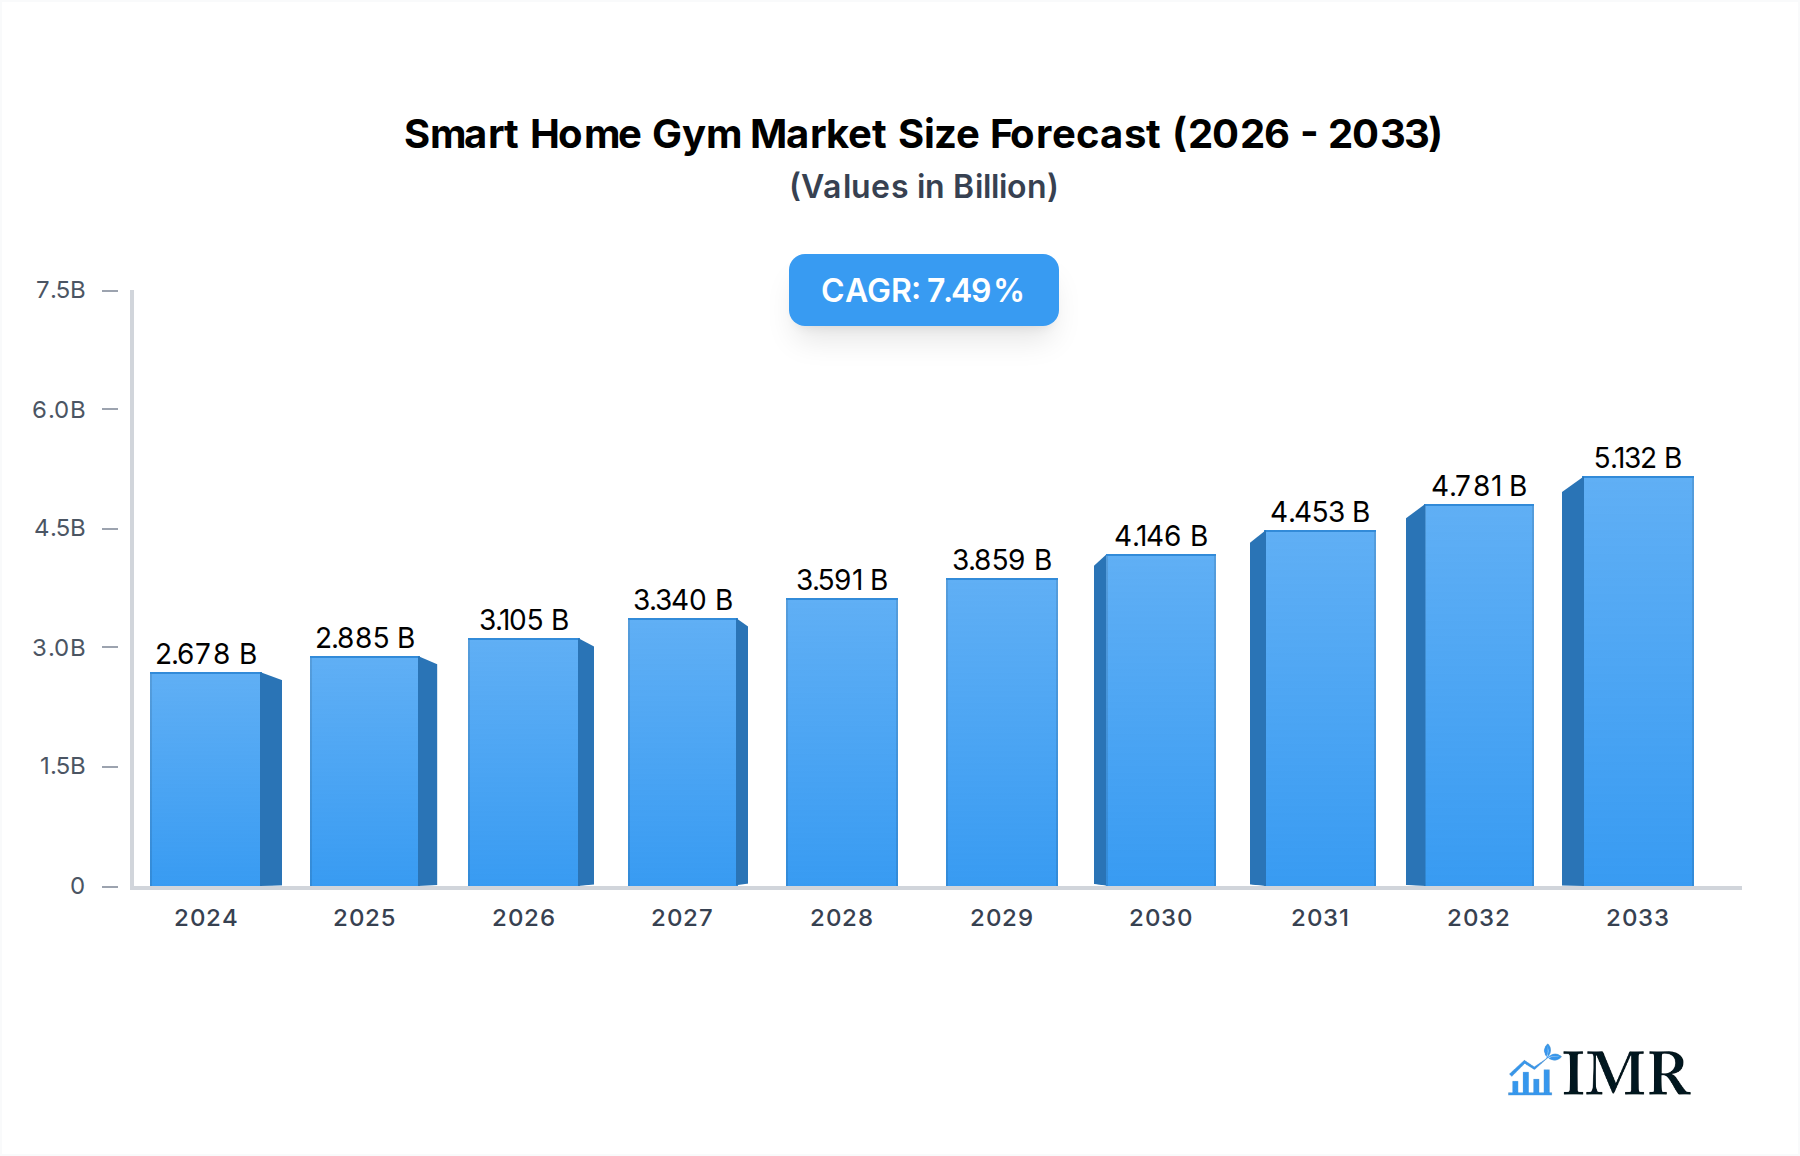
The smart home gym market is experiencing robust growth, projected to reach $2885 million by 2025, with a significant Compound Annual Growth Rate (CAGR) of 7.6% through 2033. This expansion is primarily fueled by evolving consumer lifestyles, a growing emphasis on health and wellness, and the increasing adoption of connected fitness solutions. The convenience of personalized workouts accessible from the comfort of one's home, coupled with advancements in interactive fitness technology, is driving demand across both Personal Fitness and Group and Social Fitness applications. Key segments include Fitness Equipment, offering innovative connected devices; Fitness Services, encompassing on-demand classes and virtual coaching; and Fitness Software, enabling seamless user experience and data tracking. The market is witnessing a surge in sophisticated fitness equipment that integrates AI, augmented reality, and personalized training programs, making it more engaging and effective for users.

Smart Home Gym Market Size (In Billion)
The competitive landscape is dynamic, with a considerable number of players, including established brands like Peloton and Technogym, alongside emerging innovators such as Tonal, Tempo, and Speediance. These companies are differentiating themselves through unique technological offerings, subscription models, and community-building features. Geographically, North America and Europe are currently leading the market, driven by high disposable incomes and a strong fitness culture. However, the Asia Pacific region is poised for substantial growth, spurred by increasing urbanization, rising health consciousness, and a growing middle class. While the market offers immense opportunities, potential restraints such as the high initial cost of some smart gym equipment and concerns regarding data privacy and security need to be addressed to ensure sustained, widespread adoption. The ongoing integration of AI and data analytics promises to further personalize user experiences and optimize training outcomes, solidifying the smart home gym's position as a cornerstone of modern fitness.
Smart Home Gym Company Market Share
Smart Home Gym Market Report Description
This comprehensive Smart Home Gym market report offers an in-depth analysis of a rapidly evolving industry, providing critical insights for industry professionals, investors, and stakeholders. Spanning from 2019 to 2033, with a base year of 2025, this report delivers meticulously researched data and strategic forecasts. We delve into the dynamics shaping the connected fitness and digital health sectors, focusing on the booming smart gym equipment and home fitness solutions. Explore the lucrative parent market of the broader fitness industry and the burgeoning child market of specialized smart home gym offerings.
Keywords: Smart Home Gym, Connected Fitness, Digital Health, Smart Gym Equipment, Home Fitness Solutions, Wearable Fitness Trackers, Fitness Apps, Virtual Fitness, AI Fitness, Personalized Training, Smart Workout, Health Tech, Global Fitness Market, Exercise Equipment, Fitness Services, Fitness Software, Personal Fitness, Group Fitness, Social Fitness, NordicTrack, Tonal, Tempo, Peloton, Technogym, Speediance, OxeFit, Flow Fitness, MAXPRO, Unitree PUMP, SmartGym, Teeter, Aroleap, amp, Magic, Squatz, Innodigym, Welcare, Aopen, Future of Fitness, Fitness Technology.
Smart Home Gym Market Dynamics & Structure
The smart home gym market exhibits a dynamic structure characterized by increasing market concentration driven by strategic mergers and acquisitions, particularly within the connected fitness segment. Technological innovation remains a primary driver, with advancements in AI-powered coaching, virtual reality training, and personalized workout algorithms fueling product development. Regulatory frameworks, while generally supportive of health and wellness initiatives, are evolving to address data privacy and interoperability standards for fitness software and apps. Competitive product substitutes range from traditional gym equipment to emerging wearable fitness trackers and advanced virtual fitness platforms. End-user demographics are expanding beyond traditional fitness enthusiasts to include a growing segment of health-conscious individuals seeking convenience and personalized experiences. Merger and acquisition volumes are projected to increase, with key players actively consolidating the market. For instance, the acquisition of smaller tech startups by established fitness equipment manufacturers is a recurring trend.
- Market Concentration: Moderate to high, with increasing consolidation.
- Technological Innovation Drivers: AI coaching, VR/AR integration, data analytics, personalized feedback.
- Regulatory Frameworks: Evolving data privacy, interoperability standards.
- Competitive Product Substitutes: Traditional gyms, standalone smart equipment, fitness apps, wearables.
- End-User Demographics: Growing appeal across age groups and fitness levels.
- M&A Trends: Increasing activity, focus on technology acquisition and market share expansion. Anticipated deal volumes in the coming years are expected to reach $1,500 million.
Smart Home Gym Growth Trends & Insights
The smart home gym market is poised for exceptional growth, driven by a confluence of technological advancements and shifting consumer behaviors. The market size is projected to expand significantly, reaching an estimated $55,000 million by 2033. Adoption rates are accelerating as consumers prioritize health and wellness, seeking convenient and personalized home fitness solutions. Technological disruptions, including the integration of AI fitness and immersive virtual fitness experiences, are reshaping the competitive landscape. Consumer behavior shifts are evident in the increasing demand for data-driven workouts, remote coaching, and integrated digital health platforms. The CAGR for the forecast period is expected to be robust at approximately 18.5%, underscoring the market's rapid expansion. Market penetration is projected to climb, with a substantial portion of households integrating smart fitness technology into their daily routines. The historical period (2019-2024) saw initial adoption and rapid innovation, laying the groundwork for the accelerated growth anticipated in the upcoming years. The estimated market size for 2025 stands at $25,000 million, with significant growth from $10,000 million in 2019.
Dominant Regions, Countries, or Segments in Smart Home Gym
The Personal Fitness application segment, within the broader Fitness Equipment type, is the dominant driver of the global smart home gym market. This dominance is fueled by a growing global consciousness towards individual well-being and the increasing demand for at-home exercise solutions. North America currently leads this market, driven by its high disposable income, advanced technological infrastructure, and strong emphasis on health and fitness. Countries like the United States are at the forefront, with substantial market penetration of smart gym equipment. Key drivers in this region include supportive government policies promoting public health, robust e-commerce penetration, and a high adoption rate of new technologies. The market share for Personal Fitness applications within the smart home gym sector is estimated at 65% of the total market value, projected to reach $35,750 million by 2033.
- Leading Segment: Application: Personal Fitness (estimated market share 65% of total smart home gym market value).
- Dominant Region: North America.
- Key Drivers in North America: High disposable income, advanced tech infrastructure, health and wellness focus, supportive government policies, strong e-commerce.
- Growth Potential: Significant, with continued innovation in AI and personalized training.
- Country-Specific Dominance: United States leading in adoption and market value.
- Market Share Evolution: Expected to maintain dominance, with other regions showing rapid growth.
Smart Home Gym Product Landscape
The smart home gym product landscape is characterized by a relentless pursuit of innovation, offering consumers highly sophisticated and integrated home fitness solutions. Products range from intelligent treadmills and connected rowing machines to advanced resistance training systems and interactive fitness mirrors. These devices integrate advanced sensors, AI-powered coaching, and immersive virtual reality experiences to deliver personalized and engaging workouts. Performance metrics are continuously enhanced through real-time feedback on form, effort, and progress. Unique selling propositions often lie in their ability to replicate the studio or gym experience at home, offering a wide array of on-demand classes and personalized training plans. Technological advancements are focused on seamless connectivity, predictive analytics for injury prevention, and gamified fitness experiences to boost user engagement.
Key Drivers, Barriers & Challenges in Smart Home Gym
Key Drivers: The smart home gym market is propelled by several key factors, including the escalating demand for convenient and flexible workout options, increasing health and wellness awareness, rapid technological advancements in AI and connectivity, and the growing popularity of at-home entertainment solutions that integrate fitness. Government initiatives promoting a healthier populace also contribute significantly.
Key Barriers & Challenges: Major challenges include the high initial cost of premium smart gym equipment, which can be a significant barrier for some consumers, estimated at $5,000 million in lost sales opportunities annually due to price sensitivity. Supply chain disruptions and component shortages can impact production and availability, leading to delayed product launches. Intense competition from both established brands and new entrants necessitates continuous innovation and competitive pricing strategies. Regulatory hurdles related to data security and privacy also present ongoing challenges, with potential compliance costs of $500 million for leading companies.
Emerging Opportunities in Smart Home Gym
Emerging opportunities in the smart home gym industry lie in the untapped potential of niche markets, such as specialized rehabilitation equipment for home use and advanced solutions for seniors. The integration of personalized nutrition planning with workout routines presents a significant avenue for growth. Furthermore, the development of more affordable and accessible smart fitness devices for emerging economies and the expansion of subscription-based fitness services and software offerings are poised to capture new user bases. The growing trend towards holistic wellness, encompassing mental health and mindfulness integrated with physical training, also represents a promising frontier.
Growth Accelerators in the Smart Home Gym Industry
The long-term growth of the smart home gym industry is significantly accelerated by ongoing technological breakthroughs, particularly in areas like predictive analytics for personalized training and augmented reality interfaces for immersive workout experiences. Strategic partnerships between fitness equipment manufacturers and content creators, as well as collaborations with healthcare providers for integrated wellness solutions, are crucial growth catalysts. Market expansion strategies, including the development of modular and scalable smart gym systems and targeted marketing campaigns to reach new demographic segments, will further propel industry expansion. The increasing investment in R&D by key players like Tonal and Peloton signifies a commitment to continuous innovation that will drive future growth.
Key Players Shaping the Smart Home Gym Market
- Speediance
- Tonal
- Tempo
- NordicTrack
- Aroleap
- amp
- Magic
- Squatz
- Flow Fitness
- OxeFit
- Welcare
- Aopen
- Innodigym
- Peloton
- Technogym
- MAXPRO
- Unitree PUMP
- SmartGym
- Teeter
Notable Milestones in Smart Home Gym Sector
- 2019, Q3: Launch of Tonal's smart resistance training system, revolutionizing strength training at home.
- 2020, Q1: Peloton expands its connected fitness offerings with new bike models and a significant increase in subscription growth.
- 2021, Q2: NordicTrack introduces AI-powered coaching features on its treadmills, enhancing personalized workouts.
- 2022, Q4: Tempo secures substantial funding to scale its interactive weight training solutions.
- 2023, Q1: Speediance unveils its compact smart gym system, targeting smaller living spaces.
- 2024, Q3: OxeFit launches its advanced smart strength training machine with integrated virtual reality capabilities.
In-Depth Smart Home Gym Market Outlook
The future outlook for the smart home gym market is exceptionally bright, driven by sustained innovation and a deepening consumer appreciation for health and convenience. Growth accelerators such as advancements in AI for hyper-personalized training and the expansion of immersive virtual fitness experiences will continue to define the market's trajectory. Strategic partnerships and the development of integrated wellness ecosystems, encompassing not just physical fitness but also mental well-being and nutrition, will unlock new revenue streams and customer loyalty. The increasing penetration of smart home technology across households globally further solidifies the long-term growth potential, making the smart home gym an indispensable component of modern living. The market is projected to reach over $55,000 million by 2033.
Smart Home Gym Segmentation
-
1. Application
- 1.1. Personal Fitness
- 1.2. Group and Social Fitness
-
2. Type
- 2.1. Fitness Equipment
- 2.2. Fitness Services
- 2.3. Fitness Software
Smart Home Gym Segmentation By Geography
-
1. North America
- 1.1. United States
- 1.2. Canada
- 1.3. Mexico
-
2. South America
- 2.1. Brazil
- 2.2. Argentina
- 2.3. Rest of South America
-
3. Europe
- 3.1. United Kingdom
- 3.2. Germany
- 3.3. France
- 3.4. Italy
- 3.5. Spain
- 3.6. Russia
- 3.7. Benelux
- 3.8. Nordics
- 3.9. Rest of Europe
-
4. Middle East & Africa
- 4.1. Turkey
- 4.2. Israel
- 4.3. GCC
- 4.4. North Africa
- 4.5. South Africa
- 4.6. Rest of Middle East & Africa
-
5. Asia Pacific
- 5.1. China
- 5.2. India
- 5.3. Japan
- 5.4. South Korea
- 5.5. ASEAN
- 5.6. Oceania
- 5.7. Rest of Asia Pacific

Smart Home Gym Regional Market Share
Geographic Coverage of Smart Home Gym
Smart Home Gym REPORT HIGHLIGHTS
| Aspects | Details |
|---|---|
| Study Period | 2020-2034 |
| Base Year | 2025 |
| Estimated Year | 2026 |
| Forecast Period | 2026-2034 |
| Historical Period | 2020-2025 |
| Growth Rate | CAGR of 7.6% from 2020-2034 |
| Segmentation |
|
Table of Contents
- 1. Introduction
- 1.1. Research Scope
- 1.2. Market Segmentation
- 1.3. Research Objective
- 1.4. Definitions and Assumptions
- 2. Executive Summary
- 2.1. Market Snapshot
- 3. Market Dynamics
- 3.1. Market Drivers
- 3.2. Market Restrains
- 3.3. Market Trends
- 3.4. Market Opportunities
- 4. Market Factor Analysis
- 4.1. Porters Five Forces
- 4.1.1. Bargaining Power of Suppliers
- 4.1.2. Bargaining Power of Buyers
- 4.1.3. Threat of New Entrants
- 4.1.4. Threat of Substitutes
- 4.1.5. Competitive Rivalry
- 4.2. PESTEL analysis
- 4.3. BCG Analysis
- 4.3.1. Stars (High Growth, High Market Share)
- 4.3.2. Cash Cows (Low Growth, High Market Share)
- 4.3.3. Question Mark (High Growth, Low Market Share)
- 4.3.4. Dogs (Low Growth, Low Market Share)
- 4.4. Ansoff Matrix Analysis
- 4.5. Supply Chain Analysis
- 4.6. Regulatory Landscape
- 4.7. Current Market Potential and Opportunity Assessment (TAM–SAM–SOM Framework)
- 4.8. IMR Analyst Note
- 4.1. Porters Five Forces
- 5. Market Analysis, Insights and Forecast 2021-2033
- 5.1. Market Analysis, Insights and Forecast - by Application
- 5.1.1. Personal Fitness
- 5.1.2. Group and Social Fitness
- 5.2. Market Analysis, Insights and Forecast - by Type
- 5.2.1. Fitness Equipment
- 5.2.2. Fitness Services
- 5.2.3. Fitness Software
- 5.3. Market Analysis, Insights and Forecast - by Region
- 5.3.1. North America
- 5.3.2. South America
- 5.3.3. Europe
- 5.3.4. Middle East & Africa
- 5.3.5. Asia Pacific
- 5.1. Market Analysis, Insights and Forecast - by Application
- 6. Global Smart Home Gym Analysis, Insights and Forecast, 2021-2033
- 6.1. Market Analysis, Insights and Forecast - by Application
- 6.1.1. Personal Fitness
- 6.1.2. Group and Social Fitness
- 6.2. Market Analysis, Insights and Forecast - by Type
- 6.2.1. Fitness Equipment
- 6.2.2. Fitness Services
- 6.2.3. Fitness Software
- 6.1. Market Analysis, Insights and Forecast - by Application
- 7. North America Smart Home Gym Analysis, Insights and Forecast, 2020-2032
- 7.1. Market Analysis, Insights and Forecast - by Application
- 7.1.1. Personal Fitness
- 7.1.2. Group and Social Fitness
- 7.2. Market Analysis, Insights and Forecast - by Type
- 7.2.1. Fitness Equipment
- 7.2.2. Fitness Services
- 7.2.3. Fitness Software
- 7.1. Market Analysis, Insights and Forecast - by Application
- 8. South America Smart Home Gym Analysis, Insights and Forecast, 2020-2032
- 8.1. Market Analysis, Insights and Forecast - by Application
- 8.1.1. Personal Fitness
- 8.1.2. Group and Social Fitness
- 8.2. Market Analysis, Insights and Forecast - by Type
- 8.2.1. Fitness Equipment
- 8.2.2. Fitness Services
- 8.2.3. Fitness Software
- 8.1. Market Analysis, Insights and Forecast - by Application
- 9. Europe Smart Home Gym Analysis, Insights and Forecast, 2020-2032
- 9.1. Market Analysis, Insights and Forecast - by Application
- 9.1.1. Personal Fitness
- 9.1.2. Group and Social Fitness
- 9.2. Market Analysis, Insights and Forecast - by Type
- 9.2.1. Fitness Equipment
- 9.2.2. Fitness Services
- 9.2.3. Fitness Software
- 9.1. Market Analysis, Insights and Forecast - by Application
- 10. Middle East & Africa Smart Home Gym Analysis, Insights and Forecast, 2020-2032
- 10.1. Market Analysis, Insights and Forecast - by Application
- 10.1.1. Personal Fitness
- 10.1.2. Group and Social Fitness
- 10.2. Market Analysis, Insights and Forecast - by Type
- 10.2.1. Fitness Equipment
- 10.2.2. Fitness Services
- 10.2.3. Fitness Software
- 10.1. Market Analysis, Insights and Forecast - by Application
- 11. Asia Pacific Smart Home Gym Analysis, Insights and Forecast, 2020-2032
- 11.1. Market Analysis, Insights and Forecast - by Application
- 11.1.1. Personal Fitness
- 11.1.2. Group and Social Fitness
- 11.2. Market Analysis, Insights and Forecast - by Type
- 11.2.1. Fitness Equipment
- 11.2.2. Fitness Services
- 11.2.3. Fitness Software
- 11.1. Market Analysis, Insights and Forecast - by Application
- 12. Competitive Analysis
- 12.1. Company Profiles
- 12.1.1 Speediance
- 12.1.1.1. Company Overview
- 12.1.1.2. Products
- 12.1.1.3. Company Financials
- 12.1.1.4. SWOT Analysis
- 12.1.2 Tonal
- 12.1.2.1. Company Overview
- 12.1.2.2. Products
- 12.1.2.3. Company Financials
- 12.1.2.4. SWOT Analysis
- 12.1.3 Tempo
- 12.1.3.1. Company Overview
- 12.1.3.2. Products
- 12.1.3.3. Company Financials
- 12.1.3.4. SWOT Analysis
- 12.1.4 NordicTrack
- 12.1.4.1. Company Overview
- 12.1.4.2. Products
- 12.1.4.3. Company Financials
- 12.1.4.4. SWOT Analysis
- 12.1.5 Aroleap
- 12.1.5.1. Company Overview
- 12.1.5.2. Products
- 12.1.5.3. Company Financials
- 12.1.5.4. SWOT Analysis
- 12.1.6 amp
- 12.1.6.1. Company Overview
- 12.1.6.2. Products
- 12.1.6.3. Company Financials
- 12.1.6.4. SWOT Analysis
- 12.1.7 Magic
- 12.1.7.1. Company Overview
- 12.1.7.2. Products
- 12.1.7.3. Company Financials
- 12.1.7.4. SWOT Analysis
- 12.1.8 Squatz
- 12.1.8.1. Company Overview
- 12.1.8.2. Products
- 12.1.8.3. Company Financials
- 12.1.8.4. SWOT Analysis
- 12.1.9 Flow Fitness
- 12.1.9.1. Company Overview
- 12.1.9.2. Products
- 12.1.9.3. Company Financials
- 12.1.9.4. SWOT Analysis
- 12.1.10 OxeFit
- 12.1.10.1. Company Overview
- 12.1.10.2. Products
- 12.1.10.3. Company Financials
- 12.1.10.4. SWOT Analysis
- 12.1.11 Welcare
- 12.1.11.1. Company Overview
- 12.1.11.2. Products
- 12.1.11.3. Company Financials
- 12.1.11.4. SWOT Analysis
- 12.1.12 Aopen
- 12.1.12.1. Company Overview
- 12.1.12.2. Products
- 12.1.12.3. Company Financials
- 12.1.12.4. SWOT Analysis
- 12.1.13 Innodigym
- 12.1.13.1. Company Overview
- 12.1.13.2. Products
- 12.1.13.3. Company Financials
- 12.1.13.4. SWOT Analysis
- 12.1.14 Peloton
- 12.1.14.1. Company Overview
- 12.1.14.2. Products
- 12.1.14.3. Company Financials
- 12.1.14.4. SWOT Analysis
- 12.1.15 Technogym
- 12.1.15.1. Company Overview
- 12.1.15.2. Products
- 12.1.15.3. Company Financials
- 12.1.15.4. SWOT Analysis
- 12.1.16 MAXPRO
- 12.1.16.1. Company Overview
- 12.1.16.2. Products
- 12.1.16.3. Company Financials
- 12.1.16.4. SWOT Analysis
- 12.1.17 Unitree PUMP
- 12.1.17.1. Company Overview
- 12.1.17.2. Products
- 12.1.17.3. Company Financials
- 12.1.17.4. SWOT Analysis
- 12.1.18 SmartGym
- 12.1.18.1. Company Overview
- 12.1.18.2. Products
- 12.1.18.3. Company Financials
- 12.1.18.4. SWOT Analysis
- 12.1.19 Teeter
- 12.1.19.1. Company Overview
- 12.1.19.2. Products
- 12.1.19.3. Company Financials
- 12.1.19.4. SWOT Analysis
- 12.1.1 Speediance
- 12.2. Market Entropy
- 12.2.1 Company's Key Areas Served
- 12.2.2 Recent Developments
- 12.3. Company Market Share Analysis 2025
- 12.3.1 Top 5 Companies Market Share Analysis
- 12.3.2 Top 3 Companies Market Share Analysis
- 12.4. List of Potential Customers
- 13. Research Methodology
List of Figures
- Figure 1: Global Smart Home Gym Revenue Breakdown (million, %) by Region 2025 & 2033
- Figure 2: North America Smart Home Gym Revenue (million), by Application 2025 & 2033
- Figure 3: North America Smart Home Gym Revenue Share (%), by Application 2025 & 2033
- Figure 4: North America Smart Home Gym Revenue (million), by Type 2025 & 2033
- Figure 5: North America Smart Home Gym Revenue Share (%), by Type 2025 & 2033
- Figure 6: North America Smart Home Gym Revenue (million), by Country 2025 & 2033
- Figure 7: North America Smart Home Gym Revenue Share (%), by Country 2025 & 2033
- Figure 8: South America Smart Home Gym Revenue (million), by Application 2025 & 2033
- Figure 9: South America Smart Home Gym Revenue Share (%), by Application 2025 & 2033
- Figure 10: South America Smart Home Gym Revenue (million), by Type 2025 & 2033
- Figure 11: South America Smart Home Gym Revenue Share (%), by Type 2025 & 2033
- Figure 12: South America Smart Home Gym Revenue (million), by Country 2025 & 2033
- Figure 13: South America Smart Home Gym Revenue Share (%), by Country 2025 & 2033
- Figure 14: Europe Smart Home Gym Revenue (million), by Application 2025 & 2033
- Figure 15: Europe Smart Home Gym Revenue Share (%), by Application 2025 & 2033
- Figure 16: Europe Smart Home Gym Revenue (million), by Type 2025 & 2033
- Figure 17: Europe Smart Home Gym Revenue Share (%), by Type 2025 & 2033
- Figure 18: Europe Smart Home Gym Revenue (million), by Country 2025 & 2033
- Figure 19: Europe Smart Home Gym Revenue Share (%), by Country 2025 & 2033
- Figure 20: Middle East & Africa Smart Home Gym Revenue (million), by Application 2025 & 2033
- Figure 21: Middle East & Africa Smart Home Gym Revenue Share (%), by Application 2025 & 2033
- Figure 22: Middle East & Africa Smart Home Gym Revenue (million), by Type 2025 & 2033
- Figure 23: Middle East & Africa Smart Home Gym Revenue Share (%), by Type 2025 & 2033
- Figure 24: Middle East & Africa Smart Home Gym Revenue (million), by Country 2025 & 2033
- Figure 25: Middle East & Africa Smart Home Gym Revenue Share (%), by Country 2025 & 2033
- Figure 26: Asia Pacific Smart Home Gym Revenue (million), by Application 2025 & 2033
- Figure 27: Asia Pacific Smart Home Gym Revenue Share (%), by Application 2025 & 2033
- Figure 28: Asia Pacific Smart Home Gym Revenue (million), by Type 2025 & 2033
- Figure 29: Asia Pacific Smart Home Gym Revenue Share (%), by Type 2025 & 2033
- Figure 30: Asia Pacific Smart Home Gym Revenue (million), by Country 2025 & 2033
- Figure 31: Asia Pacific Smart Home Gym Revenue Share (%), by Country 2025 & 2033
List of Tables
- Table 1: Global Smart Home Gym Revenue million Forecast, by Application 2020 & 2033
- Table 2: Global Smart Home Gym Revenue million Forecast, by Type 2020 & 2033
- Table 3: Global Smart Home Gym Revenue million Forecast, by Region 2020 & 2033
- Table 4: Global Smart Home Gym Revenue million Forecast, by Application 2020 & 2033
- Table 5: Global Smart Home Gym Revenue million Forecast, by Type 2020 & 2033
- Table 6: Global Smart Home Gym Revenue million Forecast, by Country 2020 & 2033
- Table 7: United States Smart Home Gym Revenue (million) Forecast, by Application 2020 & 2033
- Table 8: Canada Smart Home Gym Revenue (million) Forecast, by Application 2020 & 2033
- Table 9: Mexico Smart Home Gym Revenue (million) Forecast, by Application 2020 & 2033
- Table 10: Global Smart Home Gym Revenue million Forecast, by Application 2020 & 2033
- Table 11: Global Smart Home Gym Revenue million Forecast, by Type 2020 & 2033
- Table 12: Global Smart Home Gym Revenue million Forecast, by Country 2020 & 2033
- Table 13: Brazil Smart Home Gym Revenue (million) Forecast, by Application 2020 & 2033
- Table 14: Argentina Smart Home Gym Revenue (million) Forecast, by Application 2020 & 2033
- Table 15: Rest of South America Smart Home Gym Revenue (million) Forecast, by Application 2020 & 2033
- Table 16: Global Smart Home Gym Revenue million Forecast, by Application 2020 & 2033
- Table 17: Global Smart Home Gym Revenue million Forecast, by Type 2020 & 2033
- Table 18: Global Smart Home Gym Revenue million Forecast, by Country 2020 & 2033
- Table 19: United Kingdom Smart Home Gym Revenue (million) Forecast, by Application 2020 & 2033
- Table 20: Germany Smart Home Gym Revenue (million) Forecast, by Application 2020 & 2033
- Table 21: France Smart Home Gym Revenue (million) Forecast, by Application 2020 & 2033
- Table 22: Italy Smart Home Gym Revenue (million) Forecast, by Application 2020 & 2033
- Table 23: Spain Smart Home Gym Revenue (million) Forecast, by Application 2020 & 2033
- Table 24: Russia Smart Home Gym Revenue (million) Forecast, by Application 2020 & 2033
- Table 25: Benelux Smart Home Gym Revenue (million) Forecast, by Application 2020 & 2033
- Table 26: Nordics Smart Home Gym Revenue (million) Forecast, by Application 2020 & 2033
- Table 27: Rest of Europe Smart Home Gym Revenue (million) Forecast, by Application 2020 & 2033
- Table 28: Global Smart Home Gym Revenue million Forecast, by Application 2020 & 2033
- Table 29: Global Smart Home Gym Revenue million Forecast, by Type 2020 & 2033
- Table 30: Global Smart Home Gym Revenue million Forecast, by Country 2020 & 2033
- Table 31: Turkey Smart Home Gym Revenue (million) Forecast, by Application 2020 & 2033
- Table 32: Israel Smart Home Gym Revenue (million) Forecast, by Application 2020 & 2033
- Table 33: GCC Smart Home Gym Revenue (million) Forecast, by Application 2020 & 2033
- Table 34: North Africa Smart Home Gym Revenue (million) Forecast, by Application 2020 & 2033
- Table 35: South Africa Smart Home Gym Revenue (million) Forecast, by Application 2020 & 2033
- Table 36: Rest of Middle East & Africa Smart Home Gym Revenue (million) Forecast, by Application 2020 & 2033
- Table 37: Global Smart Home Gym Revenue million Forecast, by Application 2020 & 2033
- Table 38: Global Smart Home Gym Revenue million Forecast, by Type 2020 & 2033
- Table 39: Global Smart Home Gym Revenue million Forecast, by Country 2020 & 2033
- Table 40: China Smart Home Gym Revenue (million) Forecast, by Application 2020 & 2033
- Table 41: India Smart Home Gym Revenue (million) Forecast, by Application 2020 & 2033
- Table 42: Japan Smart Home Gym Revenue (million) Forecast, by Application 2020 & 2033
- Table 43: South Korea Smart Home Gym Revenue (million) Forecast, by Application 2020 & 2033
- Table 44: ASEAN Smart Home Gym Revenue (million) Forecast, by Application 2020 & 2033
- Table 45: Oceania Smart Home Gym Revenue (million) Forecast, by Application 2020 & 2033
- Table 46: Rest of Asia Pacific Smart Home Gym Revenue (million) Forecast, by Application 2020 & 2033
Frequently Asked Questions
1. What is the projected Compound Annual Growth Rate (CAGR) of the Smart Home Gym?
The projected CAGR is approximately 7.6%.
2. Which companies are prominent players in the Smart Home Gym?
Key companies in the market include Speediance, Tonal, Tempo, NordicTrack, Aroleap, amp, Magic, Squatz, Flow Fitness, OxeFit, Welcare, Aopen, Innodigym, Peloton, Technogym, MAXPRO, Unitree PUMP, SmartGym, Teeter.
3. What are the main segments of the Smart Home Gym?
The market segments include Application, Type.
4. Can you provide details about the market size?
The market size is estimated to be USD 2885 million as of 2022.
5. What are some drivers contributing to market growth?
N/A
6. What are the notable trends driving market growth?
N/A
7. Are there any restraints impacting market growth?
N/A
8. Can you provide examples of recent developments in the market?
N/A
9. What pricing options are available for accessing the report?
Pricing options include single-user, multi-user, and enterprise licenses priced at USD 4250.00, USD 6375.00, and USD 8500.00 respectively.
10. Is the market size provided in terms of value or volume?
The market size is provided in terms of value, measured in million.
11. Are there any specific market keywords associated with the report?
Yes, the market keyword associated with the report is "Smart Home Gym," which aids in identifying and referencing the specific market segment covered.
12. How do I determine which pricing option suits my needs best?
The pricing options vary based on user requirements and access needs. Individual users may opt for single-user licenses, while businesses requiring broader access may choose multi-user or enterprise licenses for cost-effective access to the report.
13. Are there any additional resources or data provided in the Smart Home Gym report?
While the report offers comprehensive insights, it's advisable to review the specific contents or supplementary materials provided to ascertain if additional resources or data are available.
14. How can I stay updated on further developments or reports in the Smart Home Gym?
To stay informed about further developments, trends, and reports in the Smart Home Gym, consider subscribing to industry newsletters, following relevant companies and organizations, or regularly checking reputable industry news sources and publications.
Methodology
Step 1 - Identification of Relevant Samples Size from Population Database


Step 2 - Approaches for Defining Global Market Size (Value, Volume* & Price*)

Note*: In applicable scenarios
Step 3 - Data Sources
Primary Research
- Web Analytics
- Survey Reports
- Research Institute
- Latest Research Reports
- Opinion Leaders
Secondary Research
- Annual Reports
- White Paper
- Latest Press Release
- Industry Association
- Paid Database
- Investor Presentations

Step 4 - Data Triangulation
Involves using different sources of information in order to increase the validity of a study
These sources are likely to be stakeholders in a program - participants, other researchers, program staff, other community members, and so on.
Then we put all data in single framework & apply various statistical tools to find out the dynamic on the market.
During the analysis stage, feedback from the stakeholder groups would be compared to determine areas of agreement as well as areas of divergence