

Key Insights
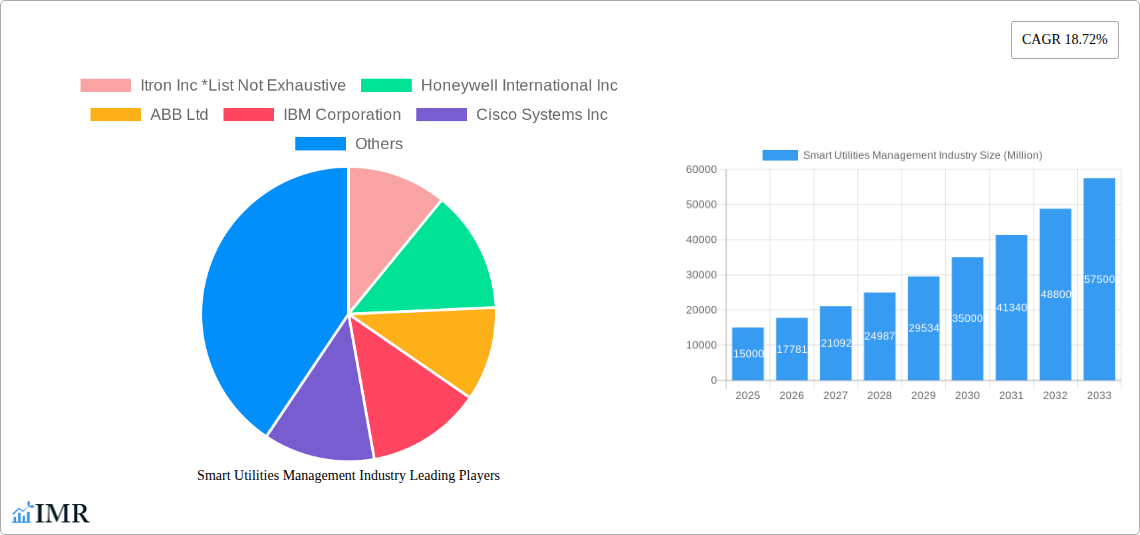
The smart utilities management market is poised for substantial growth, propelled by global urbanization trends, the imperative for enhanced grid efficiency, and the escalating integration of renewable energy sources. With a projected compound annual growth rate (CAGR) of 12.9%, the market is estimated at $56.48 billion in the base year of 2024. Key growth drivers include the widespread deployment of Advanced Metering Infrastructure (AMI) for real-time data analytics, the integration of smart sensors for predictive maintenance, and the development of advanced energy management systems aimed at optimizing resource allocation and minimizing energy losses. The market is segmented into Meter Data Management Systems (MDMS), Energy Monitoring/Management Systems, and Smart Distribution Management Systems, each contributing to market expansion through technological innovation and evolving consumer needs. Leading industry players such as Itron, Honeywell, ABB, IBM, Cisco, Siemens, Atos, and Tendrill are actively influencing market dynamics through strategic partnerships and ongoing innovation. Geographic expansion, particularly in developing regions with rapidly advancing infrastructure like the Asia-Pacific and South America, further fuels the market's growth trajectory.
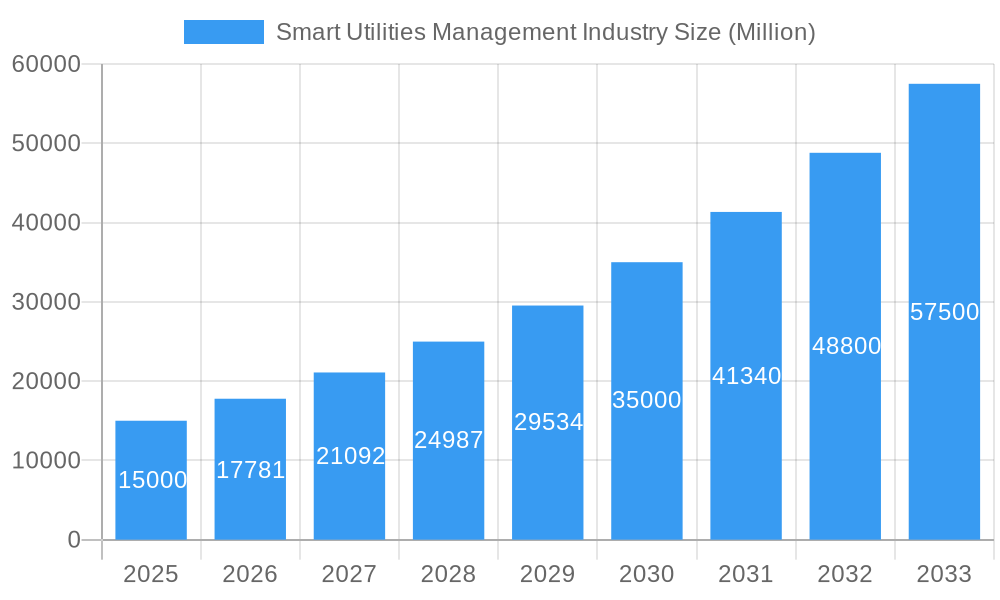
Smart Utilities Management Industry Market Size (In Billion)
The forecast period (2025-2033) anticipates sustained market expansion, with opportunities arising from AI-driven grid optimization, robust cybersecurity enhancements, and the integration of blockchain for improved transparency and efficiency. Continued investment in smart grid infrastructure by governments and utility providers, coupled with a growing awareness of the environmental and economic advantages of intelligent energy management, will underpin market growth. Increased competition among established and emerging technology providers is expected to foster innovation and potentially influence pricing strategies. Nevertheless, challenges persist, including the significant initial investment required for smart grid infrastructure deployment and the critical need for stringent cybersecurity protocols to safeguard data integrity and ensure grid stability.
Smart Utilities Management Industry Company Market Share
Smart Utilities Management Industry Market Report: 2019-2033
This comprehensive report provides an in-depth analysis of the Smart Utilities Management industry, encompassing market dynamics, growth trends, regional analysis, product landscape, key players, and future outlook. The study period covers 2019-2033, with a base year of 2025 and a forecast period of 2025-2033. The report utilizes data from the historical period of 2019-2024 and incorporates expert analysis and predictive modeling for accurate market insights. The total market size in 2025 is estimated at $XX Billion.
Smart Utilities Management Industry Market Dynamics & Structure
The Smart Utilities Management market, a crucial segment within the broader Smart Grid market, is characterized by moderate concentration, with several key players holding significant market share. The market is experiencing rapid technological innovation, driven by advancements in IoT, AI, and big data analytics. Stringent regulatory frameworks, aimed at improving energy efficiency and grid reliability, are shaping market dynamics. Existing legacy infrastructure presents a significant challenge to adoption. The competitive landscape includes various established players and emerging technology providers. Mergers and acquisitions (M&A) activity is moderately high, with larger companies consolidating their positions and smaller companies seeking strategic partnerships.
- Market Concentration: Moderately concentrated, with the top 5 players holding approximately 40% market share in 2025.
- Technological Innovation Drivers: IoT, AI, Big Data Analytics, Advanced Metering Infrastructure (AMI).
- Regulatory Frameworks: Government incentives, energy efficiency mandates, and grid modernization initiatives.
- Competitive Product Substitutes: Traditional grid management systems, limited alternatives due to high initial investment costs.
- End-User Demographics: Primarily utility companies (electric, gas, water), and increasingly municipalities and industrial consumers.
- M&A Trends: Approximately 20-25 significant M&A deals annually (2019-2024), driven by strategic expansion and technological acquisition.
Smart Utilities Management Industry Growth Trends & Insights
The Smart Utilities Management market is experiencing substantial growth, fueled by the increasing need for improved grid efficiency, reduced energy losses, and enhanced customer service. Adoption rates are rising steadily, driven by government policies, technological advancements, and rising energy prices. The market is witnessing significant disruption from new entrants offering innovative solutions and business models. Consumer behavior is shifting toward a preference for smart, personalized energy management tools.
- Market Size Evolution: Market size is projected to grow at a CAGR of xx% from 2025 to 2033, reaching $xx Billion by 2033.
- Adoption Rates: Increasing at a CAGR of xx% driven by government incentives and technological advancements.
- Technological Disruptions: The emergence of edge computing, blockchain technology, and AI-driven predictive maintenance is transforming the landscape.
- Consumer Behavior Shifts: Increasing demand for real-time energy monitoring, personalized energy management, and improved customer service.
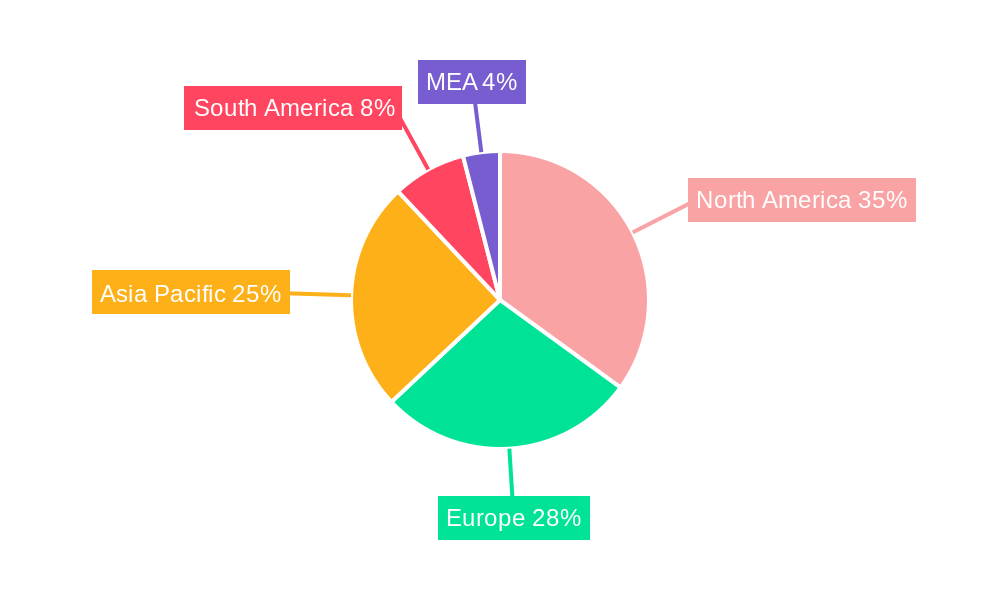
Dominant Regions, Countries, or Segments in Smart Utilities Management Industry
North America and Europe currently hold the largest market shares in the Smart Utilities Management industry, driven by early adoption of smart grid technologies and robust regulatory support. Within the segments, Meter Data Management Systems (MDMS) dominates due to its essential role in smart grid infrastructure. However, Energy Monitoring/Management is expected to witness faster growth due to the increasing focus on energy efficiency and renewable energy integration.
- Leading Region: North America (holds approximately 35% market share in 2025).
- Key Drivers in North America: Strong regulatory support, high investment in grid modernization, and early adoption of smart technologies.
- Leading Segment: Meter Data Management Systems (MDMS) (holds approximately 40% segment share in 2025).
- Growth Potential: High in Asia Pacific and Latin America driven by increasing urbanization and government initiatives.
Smart Utilities Management Industry Product Landscape
The product landscape is dynamic, with continuous innovations in software and hardware components. Products are increasingly integrated and offer advanced analytics, predictive capabilities, and improved user interfaces. Key features include real-time monitoring, data visualization, predictive maintenance, and automated fault detection. Competition is fierce, with companies focusing on delivering cost-effective, scalable, and user-friendly solutions.
Key Drivers, Barriers & Challenges in Smart Utilities Management Industry
Key Drivers:
- Increasing demand for improved grid reliability and efficiency.
- Government incentives and regulations promoting smart grid adoption.
- Technological advancements enabling sophisticated data analytics and automation.
Challenges & Restraints:
- High initial investment costs can hinder adoption, especially in developing countries.
- Cybersecurity concerns related to data breaches and grid vulnerabilities.
- Integration challenges with existing legacy infrastructure.
- Supply chain disruptions leading to delays in project implementations (approximately 10% of projects delayed in 2024 due to supply chain issues).
Emerging Opportunities in Smart Utilities Management Industry
- Expanding into untapped markets in developing countries.
- Development of AI-powered solutions for predictive maintenance and anomaly detection.
- Integration of renewable energy sources into smart grid management systems.
- Development of user-friendly mobile applications for enhanced customer engagement.
Growth Accelerators in the Smart Utilities Management Industry
Technological breakthroughs in AI, IoT, and big data analytics, strategic partnerships between technology providers and utility companies, and focused expansion into emerging markets are key growth catalysts for the Smart Utilities Management industry. These initiatives are poised to unlock significant market potential and drive long-term growth.
Key Players Shaping the Smart Utilities Management Industry Market
- Itron Inc
- Honeywell International Inc
- ABB Ltd
- IBM Corporation
- Cisco Systems Inc
- Siemens AG
- Atos SE
- Tendrill Inc
Notable Milestones in Smart Utilities Management Industry Sector
- 2020: Significant increase in government funding for smart grid initiatives in several countries.
- 2021: Launch of several AI-powered grid management platforms by major technology companies.
- 2022: Several large-scale smart grid deployments completed in North America and Europe.
- 2023: Increased focus on cybersecurity solutions for smart grid infrastructure.
In-Depth Smart Utilities Management Industry Market Outlook
The Smart Utilities Management market is poised for sustained growth driven by ongoing technological advancements, increasing adoption rates, and supportive government policies. Opportunities exist for companies to capitalize on this growth by focusing on innovation, strategic partnerships, and expansion into emerging markets. The future outlook is highly positive, with substantial potential for market expansion and innovation.
Smart Utilities Management Industry Segmentation
-
1. Type
- 1.1. Meter Data Management System
- 1.2. Energy Monitoring/Management
- 1.3. Smart Distribution Management
Smart Utilities Management Industry Segmentation By Geography
- 1. North America
- 2. Europe
- 3. Asia Pacific
- 4. Latin America
- 5. Middle East
Smart Utilities Management Industry Regional Market Share
Geographic Coverage of Smart Utilities Management Industry
Smart Utilities Management Industry REPORT HIGHLIGHTS
| Aspects | Details |
|---|---|
| Study Period | 2020-2034 |
| Base Year | 2025 |
| Estimated Year | 2026 |
| Forecast Period | 2026-2034 |
| Historical Period | 2020-2025 |
| Growth Rate | CAGR of 12.9% from 2020-2034 |
| Segmentation |
|
Table of Contents
- 1. Introduction
- 1.1. Research Scope
- 1.2. Market Segmentation
- 1.3. Research Objective
- 1.4. Definitions and Assumptions
- 2. Executive Summary
- 2.1. Market Snapshot
- 3. Market Dynamics
- 3.1. Market Drivers
- 3.2. Market Restrains
- 3.3. Market Trends
- 3.4. Market Opportunities
- 4. Market Factor Analysis
- 4.1. Porters Five Forces
- 4.1.1. Bargaining Power of Suppliers
- 4.1.2. Bargaining Power of Buyers
- 4.1.3. Threat of New Entrants
- 4.1.4. Threat of Substitutes
- 4.1.5. Competitive Rivalry
- 4.2. PESTEL analysis
- 4.3. BCG Analysis
- 4.3.1. Stars (High Growth, High Market Share)
- 4.3.2. Cash Cows (Low Growth, High Market Share)
- 4.3.3. Question Mark (High Growth, Low Market Share)
- 4.3.4. Dogs (Low Growth, Low Market Share)
- 4.4. Ansoff Matrix Analysis
- 4.5. Supply Chain Analysis
- 4.6. Regulatory Landscape
- 4.7. Current Market Potential and Opportunity Assessment (TAM–SAM–SOM Framework)
- 4.8. IMR Analyst Note
- 4.1. Porters Five Forces
- 5. Market Analysis, Insights and Forecast 2021-2033
- 5.1. Market Analysis, Insights and Forecast - by Type
- 5.1.1. Meter Data Management System
- 5.1.2. Energy Monitoring/Management
- 5.1.3. Smart Distribution Management
- 5.2. Market Analysis, Insights and Forecast - by Region
- 5.2.1. North America
- 5.2.2. Europe
- 5.2.3. Asia Pacific
- 5.2.4. Latin America
- 5.2.5. Middle East
- 5.1. Market Analysis, Insights and Forecast - by Type
- 6. Global Smart Utilities Management Industry Analysis, Insights and Forecast, 2021-2033
- 6.1. Market Analysis, Insights and Forecast - by Type
- 6.1.1. Meter Data Management System
- 6.1.2. Energy Monitoring/Management
- 6.1.3. Smart Distribution Management
- 6.1. Market Analysis, Insights and Forecast - by Type
- 7. North America Smart Utilities Management Industry Analysis, Insights and Forecast, 2020-2032
- 7.1. Market Analysis, Insights and Forecast - by Type
- 7.1.1. Meter Data Management System
- 7.1.2. Energy Monitoring/Management
- 7.1.3. Smart Distribution Management
- 7.1. Market Analysis, Insights and Forecast - by Type
- 8. Europe Smart Utilities Management Industry Analysis, Insights and Forecast, 2020-2032
- 8.1. Market Analysis, Insights and Forecast - by Type
- 8.1.1. Meter Data Management System
- 8.1.2. Energy Monitoring/Management
- 8.1.3. Smart Distribution Management
- 8.1. Market Analysis, Insights and Forecast - by Type
- 9. Asia Pacific Smart Utilities Management Industry Analysis, Insights and Forecast, 2020-2032
- 9.1. Market Analysis, Insights and Forecast - by Type
- 9.1.1. Meter Data Management System
- 9.1.2. Energy Monitoring/Management
- 9.1.3. Smart Distribution Management
- 9.1. Market Analysis, Insights and Forecast - by Type
- 10. Latin America Smart Utilities Management Industry Analysis, Insights and Forecast, 2020-2032
- 10.1. Market Analysis, Insights and Forecast - by Type
- 10.1.1. Meter Data Management System
- 10.1.2. Energy Monitoring/Management
- 10.1.3. Smart Distribution Management
- 10.1. Market Analysis, Insights and Forecast - by Type
- 11. Middle East Smart Utilities Management Industry Analysis, Insights and Forecast, 2020-2032
- 11.1. Market Analysis, Insights and Forecast - by Type
- 11.1.1. Meter Data Management System
- 11.1.2. Energy Monitoring/Management
- 11.1.3. Smart Distribution Management
- 11.1. Market Analysis, Insights and Forecast - by Type
- 12. Competitive Analysis
- 12.1. Company Profiles
- 12.1.1 Itron Inc *List Not Exhaustive
- 12.1.1.1. Company Overview
- 12.1.1.2. Products
- 12.1.1.3. Company Financials
- 12.1.1.4. SWOT Analysis
- 12.1.2 Honeywell International Inc
- 12.1.2.1. Company Overview
- 12.1.2.2. Products
- 12.1.2.3. Company Financials
- 12.1.2.4. SWOT Analysis
- 12.1.3 ABB Ltd
- 12.1.3.1. Company Overview
- 12.1.3.2. Products
- 12.1.3.3. Company Financials
- 12.1.3.4. SWOT Analysis
- 12.1.4 IBM Corporation
- 12.1.4.1. Company Overview
- 12.1.4.2. Products
- 12.1.4.3. Company Financials
- 12.1.4.4. SWOT Analysis
- 12.1.5 Cisco Systems Inc
- 12.1.5.1. Company Overview
- 12.1.5.2. Products
- 12.1.5.3. Company Financials
- 12.1.5.4. SWOT Analysis
- 12.1.6 Siemens AG
- 12.1.6.1. Company Overview
- 12.1.6.2. Products
- 12.1.6.3. Company Financials
- 12.1.6.4. SWOT Analysis
- 12.1.7 Atos SE
- 12.1.7.1. Company Overview
- 12.1.7.2. Products
- 12.1.7.3. Company Financials
- 12.1.7.4. SWOT Analysis
- 12.1.8 Tendrill Inc
- 12.1.8.1. Company Overview
- 12.1.8.2. Products
- 12.1.8.3. Company Financials
- 12.1.8.4. SWOT Analysis
- 12.1.1 Itron Inc *List Not Exhaustive
- 12.2. Market Entropy
- 12.2.1 Company's Key Areas Served
- 12.2.2 Recent Developments
- 12.3. Company Market Share Analysis 2025
- 12.3.1 Top 5 Companies Market Share Analysis
- 12.3.2 Top 3 Companies Market Share Analysis
- 12.4. List of Potential Customers
- 13. Research Methodology
List of Figures
- Figure 1: Global Smart Utilities Management Industry Revenue Breakdown (billion, %) by Region 2025 & 2033
- Figure 2: North America Smart Utilities Management Industry Revenue (billion), by Type 2025 & 2033
- Figure 3: North America Smart Utilities Management Industry Revenue Share (%), by Type 2025 & 2033
- Figure 4: North America Smart Utilities Management Industry Revenue (billion), by Country 2025 & 2033
- Figure 5: North America Smart Utilities Management Industry Revenue Share (%), by Country 2025 & 2033
- Figure 6: Europe Smart Utilities Management Industry Revenue (billion), by Type 2025 & 2033
- Figure 7: Europe Smart Utilities Management Industry Revenue Share (%), by Type 2025 & 2033
- Figure 8: Europe Smart Utilities Management Industry Revenue (billion), by Country 2025 & 2033
- Figure 9: Europe Smart Utilities Management Industry Revenue Share (%), by Country 2025 & 2033
- Figure 10: Asia Pacific Smart Utilities Management Industry Revenue (billion), by Type 2025 & 2033
- Figure 11: Asia Pacific Smart Utilities Management Industry Revenue Share (%), by Type 2025 & 2033
- Figure 12: Asia Pacific Smart Utilities Management Industry Revenue (billion), by Country 2025 & 2033
- Figure 13: Asia Pacific Smart Utilities Management Industry Revenue Share (%), by Country 2025 & 2033
- Figure 14: Latin America Smart Utilities Management Industry Revenue (billion), by Type 2025 & 2033
- Figure 15: Latin America Smart Utilities Management Industry Revenue Share (%), by Type 2025 & 2033
- Figure 16: Latin America Smart Utilities Management Industry Revenue (billion), by Country 2025 & 2033
- Figure 17: Latin America Smart Utilities Management Industry Revenue Share (%), by Country 2025 & 2033
- Figure 18: Middle East Smart Utilities Management Industry Revenue (billion), by Type 2025 & 2033
- Figure 19: Middle East Smart Utilities Management Industry Revenue Share (%), by Type 2025 & 2033
- Figure 20: Middle East Smart Utilities Management Industry Revenue (billion), by Country 2025 & 2033
- Figure 21: Middle East Smart Utilities Management Industry Revenue Share (%), by Country 2025 & 2033
List of Tables
- Table 1: Global Smart Utilities Management Industry Revenue billion Forecast, by Type 2020 & 2033
- Table 2: Global Smart Utilities Management Industry Revenue billion Forecast, by Region 2020 & 2033
- Table 3: Global Smart Utilities Management Industry Revenue billion Forecast, by Type 2020 & 2033
- Table 4: Global Smart Utilities Management Industry Revenue billion Forecast, by Country 2020 & 2033
- Table 5: Global Smart Utilities Management Industry Revenue billion Forecast, by Type 2020 & 2033
- Table 6: Global Smart Utilities Management Industry Revenue billion Forecast, by Country 2020 & 2033
- Table 7: Global Smart Utilities Management Industry Revenue billion Forecast, by Type 2020 & 2033
- Table 8: Global Smart Utilities Management Industry Revenue billion Forecast, by Country 2020 & 2033
- Table 9: Global Smart Utilities Management Industry Revenue billion Forecast, by Type 2020 & 2033
- Table 10: Global Smart Utilities Management Industry Revenue billion Forecast, by Country 2020 & 2033
- Table 11: Global Smart Utilities Management Industry Revenue billion Forecast, by Type 2020 & 2033
- Table 12: Global Smart Utilities Management Industry Revenue billion Forecast, by Country 2020 & 2033
Frequently Asked Questions
1. What is the projected Compound Annual Growth Rate (CAGR) of the Smart Utilities Management Industry?
The projected CAGR is approximately 12.9%.
2. Which companies are prominent players in the Smart Utilities Management Industry?
Key companies in the market include Itron Inc *List Not Exhaustive, Honeywell International Inc, ABB Ltd, IBM Corporation, Cisco Systems Inc, Siemens AG, Atos SE, Tendrill Inc.
3. What are the main segments of the Smart Utilities Management Industry?
The market segments include Type.
4. Can you provide details about the market size?
The market size is estimated to be USD 56.48 billion as of 2022.
5. What are some drivers contributing to market growth?
; Rise in Smart City Deployment; Improvements in Energy Efficiency.
6. What are the notable trends driving market growth?
Power Sector Hits Growth with Meter Data Management System.
7. Are there any restraints impacting market growth?
; High Cost and Security Concerns and Integration Challenges Associated with Smart Meters.
8. Can you provide examples of recent developments in the market?
N/A
9. What pricing options are available for accessing the report?
Pricing options include single-user, multi-user, and enterprise licenses priced at USD 4750, USD 5250, and USD 8750 respectively.
10. Is the market size provided in terms of value or volume?
The market size is provided in terms of value, measured in billion.
11. Are there any specific market keywords associated with the report?
Yes, the market keyword associated with the report is "Smart Utilities Management Industry," which aids in identifying and referencing the specific market segment covered.
12. How do I determine which pricing option suits my needs best?
The pricing options vary based on user requirements and access needs. Individual users may opt for single-user licenses, while businesses requiring broader access may choose multi-user or enterprise licenses for cost-effective access to the report.
13. Are there any additional resources or data provided in the Smart Utilities Management Industry report?
While the report offers comprehensive insights, it's advisable to review the specific contents or supplementary materials provided to ascertain if additional resources or data are available.
14. How can I stay updated on further developments or reports in the Smart Utilities Management Industry?
To stay informed about further developments, trends, and reports in the Smart Utilities Management Industry, consider subscribing to industry newsletters, following relevant companies and organizations, or regularly checking reputable industry news sources and publications.
Methodology
Step 1 - Identification of Relevant Samples Size from Population Database


Step 2 - Approaches for Defining Global Market Size (Value, Volume* & Price*)

Note*: In applicable scenarios
Step 3 - Data Sources
Primary Research
- Web Analytics
- Survey Reports
- Research Institute
- Latest Research Reports
- Opinion Leaders
Secondary Research
- Annual Reports
- White Paper
- Latest Press Release
- Industry Association
- Paid Database
- Investor Presentations

Step 4 - Data Triangulation
Involves using different sources of information in order to increase the validity of a study
These sources are likely to be stakeholders in a program - participants, other researchers, program staff, other community members, and so on.
Then we put all data in single framework & apply various statistical tools to find out the dynamic on the market.
During the analysis stage, feedback from the stakeholder groups would be compared to determine areas of agreement as well as areas of divergence