

Key Insights
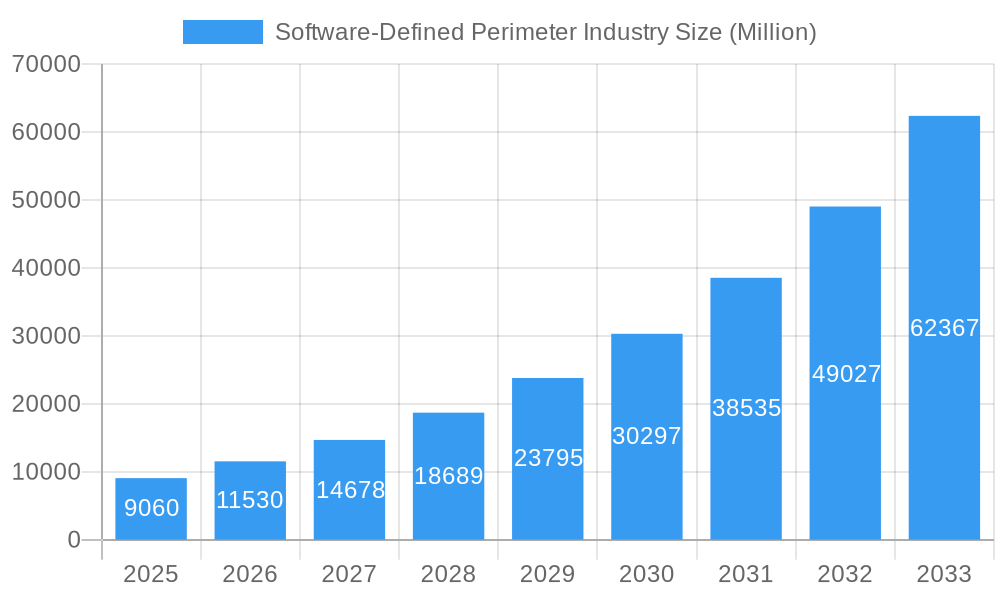
The Software-Defined Perimeter (SDP) market is experiencing explosive growth, projected to reach a significant $9.06 billion by 2025. This surge is fueled by an impressive 27.39% CAGR, indicating a highly dynamic and rapidly expanding sector within cybersecurity. The primary drivers behind this robust expansion are the escalating sophistication of cyber threats, the increasing adoption of cloud computing and remote work models, and the critical need for enhanced network security and granular access control. Organizations are actively seeking solutions that can effectively segment their networks, minimize their attack surface, and provide secure, identity-centric access to resources, moving away from traditional perimeter-based security models. The market is characterized by a strong demand for both advanced solutions and comprehensive services to implement and manage SDP deployments.
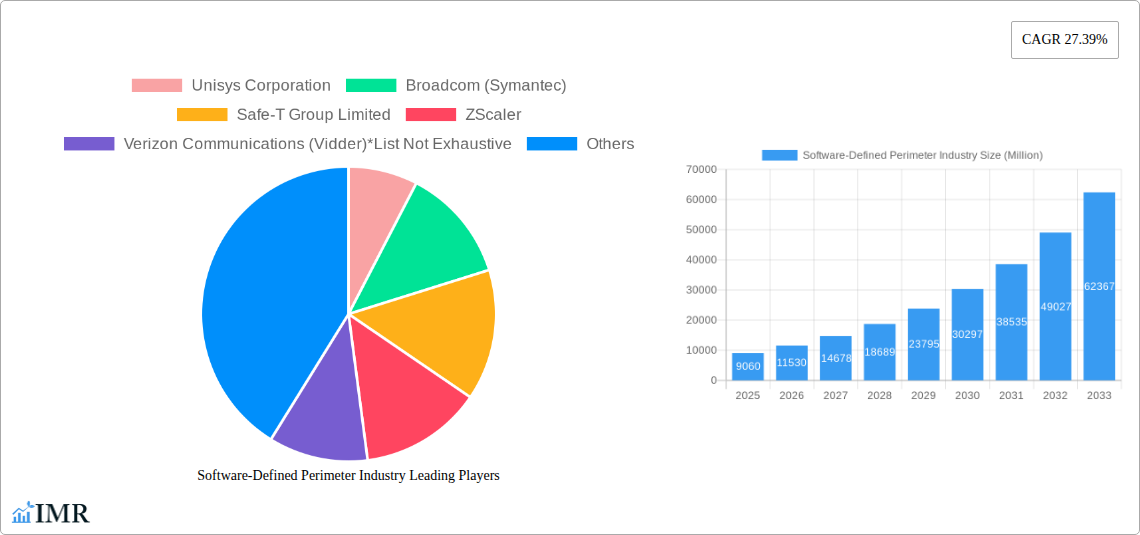
Software-Defined Perimeter Industry Market Size (In Billion)
The SDP market is segmented across various deployment modes, with a significant inclination towards Cloud deployments due to their scalability, flexibility, and cost-effectiveness, though On-Premise solutions remain relevant for specific enterprise needs. Key end-user verticals such as BFSI, Telecom and IT, Healthcare, Retail, and Government are leading the charge in adopting SDP to protect sensitive data and critical infrastructure. While North America currently dominates the market, driven by early adoption and robust IT spending, the Asia Pacific region is anticipated to witness the fastest growth due to increasing digitalization and rising cybersecurity awareness. Emerging trends include the integration of AI and machine learning for threat detection, the development of Zero Trust architecture principles, and the increasing focus on micro-segmentation. However, potential restraints such as the complexity of integration with existing legacy systems and a shortage of skilled cybersecurity professionals could pose challenges to widespread adoption. Leading companies like Unisys Corporation, Broadcom (Symantec), ZScaler, Cisco Systems Inc., and Palo Alto Networks Inc. are at the forefront, innovating and competing to capture market share.
Software-Defined Perimeter Industry Company Market Share
Software-Defined Perimeter Industry Market Outlook & Growth Forecast 2025-2033
This comprehensive report provides an in-depth analysis of the Software-Defined Perimeter (SDP) industry, detailing market dynamics, growth trends, key players, and future opportunities. Covering a study period from 2019 to 2033, with a base and estimated year of 2025, this report offers actionable insights for stakeholders looking to navigate this rapidly evolving cybersecurity landscape. Our analysis encompasses market size evolution, adoption rates, technological disruptions, and shifts in consumer behavior, segmenting the market by type (Solutions, Services), deployment mode (Cloud, On-Premise), and end-user verticals (BFSI, Telecom and IT, Healthcare, Retail, Government, Other).
Software-Defined Perimeter Industry Market Dynamics & Structure
The Software-Defined Perimeter (SDP) industry is characterized by dynamic market concentration, driven by continuous technological innovation in zero-trust security architectures. As regulatory frameworks worldwide increasingly emphasize robust data protection and access control, the demand for SDP solutions is escalating. Competitive product substitutes, while present in traditional network security, are largely being superseded by the granular, identity-centric approach of SDP. End-user demographics are broadening beyond large enterprises to include mid-sized businesses seeking advanced cloud security and remote access management. Mergers and acquisitions (M&A) trends are actively shaping the competitive landscape, with larger cybersecurity firms acquiring innovative SDP startups to enhance their portfolios.
- Market Concentration: Moderately consolidated with a few dominant players and a growing number of niche providers.
- Technological Innovation Drivers: Rise of remote work, increasing sophistication of cyber threats, adoption of cloud computing, and the imperative for zero-trust security models.
- Regulatory Frameworks: GDPR, CCPA, and industry-specific compliance mandates are compelling organizations to adopt advanced security solutions like SDP.
- Competitive Product Substitutes: Traditional VPNs and firewalls are facing challenges from the dynamic and context-aware security offered by SDP.
- End-User Demographics: Expansion from large enterprises to SMBs, driven by affordability and ease of deployment of cloud-based SDP.
- M&A Trends: Strategic acquisitions aimed at integrating SDP capabilities into broader security platforms.
Software-Defined Perimeter Industry Growth Trends & Insights
The Software-Defined Perimeter (SDP) industry is poised for significant expansion, driven by a fundamental shift in security paradigms towards zero-trust principles. As organizations grapple with increasingly complex and distributed IT environments, the need for a more granular and identity-centric approach to network access control has become paramount. This report leverages extensive market research to deliver a detailed analysis of the market size evolution, projectively estimating it to reach substantial figures in the coming years. Adoption rates are accelerating across all end-user verticals, fueled by the growing awareness of advanced persistent threats (APTs) and the vulnerabilities inherent in traditional perimeter-based security models. Technological disruptions, such as the integration of AI and machine learning into SDP platforms for enhanced threat detection and policy enforcement, are further propelling the market forward. Consumer behavior is also shifting, with IT decision-makers prioritizing agility, scalability, and proactive security measures over reactive defenses.
- Market Size Evolution: The global SDP market is projected to grow from an estimated $xx million in 2025 to $xx million by 2033, exhibiting a compound annual growth rate (CAGR) of xx%.
- Adoption Rates: Expected to witness a significant surge, with an estimated xx% of organizations adopting SDP solutions by 2030.
- Technological Disruptions: The integration of AI/ML for anomaly detection, behavioral analytics, and automated policy adjustments is a key innovation.
- Consumer Behavior Shifts: Increased demand for cloud-native SDP solutions, seamless integration with existing security stacks, and enhanced remote workforce security.
- Market Penetration: Projected to increase from xx% in 2025 to xx% by 2033, indicating widespread adoption.
- Key Growth Drivers: The expanding attack surface due to hybrid and multi-cloud environments, the escalating volume and sophistication of cyberattacks, and the growing need for secure remote access.
Dominant Regions, Countries, or Segments in Software-Defined Perimeter Industry
North America currently dominates the Software-Defined Perimeter (SDP) industry, driven by its robust technological infrastructure, high adoption of cloud computing, and stringent regulatory compliance mandates, particularly within the BFSI and Telecom and IT sectors. The United States, in particular, accounts for a substantial market share due to the presence of leading technology companies and a strong emphasis on cybersecurity innovation. Government initiatives aimed at securing critical infrastructure and sensitive data further bolster demand.
Among the segments, Solutions represent the largest market share, encompassing advanced SDP platforms offering features like micro-segmentation, identity and access management (IAM), and dynamic policy enforcement. The Cloud deployment mode is witnessing the fastest growth, aligning with the broader digital transformation trends and the agility it offers to businesses. In terms of end-user verticals, BFSI and Telecom and IT are the leading segments. The BFSI sector's need for highly secure transaction processing and data protection, coupled with the telecom industry's vast network infrastructure and the increasing prevalence of remote workforces, makes them prime adopters of SDP.
- Dominant Region: North America
- Key Countries: United States, Canada
- Dominance Factors: Advanced technological adoption, strong regulatory environment, presence of major SDP vendors, high cybersecurity spending.
- Market Share (North America): Estimated xx% of the global SDP market in 2025.
- Leading Segment (Type): Solutions
- Key Offerings: Zero Trust Network Access (ZTNA), Micro-segmentation, Identity-Aware Proxies, Secure Access Service Edge (SASE) components.
- Growth Potential: Continued innovation in feature sets and integration capabilities.
- Leading Segment (Deployment Mode): Cloud
- Drivers: Scalability, flexibility, cost-effectiveness, faster deployment.
- Market Share (Cloud): Projected to grow at a CAGR of xx% during the forecast period.
- Leading End-User Verticals: BFSI, Telecom and IT
- Drivers (BFSI): Regulatory compliance, data security, fraud prevention, secure remote banking.
- Drivers (Telecom and IT): Network security, protection of sensitive customer data, secure remote access for employees and contractors.
- Growth Potential: Significant investment in cybersecurity to meet evolving threat landscapes.
Software-Defined Perimeter Industry Product Landscape
The Software-Defined Perimeter (SDP) product landscape is marked by continuous innovation, focusing on delivering granular, identity-centric, and context-aware access control. Key product types include Zero Trust Network Access (ZTNA) solutions, which create secure, individualized connections between users and applications, and micro-segmentation platforms that isolate workloads and prevent lateral movement of threats. Performance metrics are increasingly measured by connection latency, policy enforcement speed, and the ability to integrate seamlessly with existing security ecosystems. Unique selling propositions often revolve around ease of deployment, comprehensive visibility, and advanced threat intelligence capabilities. Technological advancements are integrating AI and machine learning for proactive threat detection and automated response, enhancing the overall security posture of organizations adopting these solutions.
Key Drivers, Barriers & Challenges in Software-Defined Perimeter Industry
The Software-Defined Perimeter (SDP) industry is propelled by several key drivers, primarily the escalating sophistication of cyber threats and the widespread adoption of cloud computing and remote work. The inherent limitations of traditional network security models, which rely on static perimeters, are pushing organizations towards more dynamic and identity-centric approaches. Regulatory mandates for data privacy and security are also significant accelerators.
- Key Drivers:
- Growing cybersecurity threats and the need for zero-trust architectures.
- Increased adoption of cloud, hybrid, and multi-cloud environments.
- The proliferation of remote and hybrid workforces.
- Stricter data privacy and security regulations.
- Desire for granular access control and reduced attack surface.
However, the market faces certain barriers and challenges. The complexity of integrating new SDP solutions with legacy IT infrastructure can be a significant hurdle. A shortage of skilled cybersecurity professionals capable of managing and implementing these advanced systems also poses a constraint. Furthermore, the initial cost of implementation and ongoing subscription fees can be a concern for smaller organizations.
- Barriers & Challenges:
- Integration complexities with legacy systems.
- Shortage of skilled cybersecurity talent.
- Initial implementation costs and ongoing subscription fees.
- Organizational inertia and resistance to change.
- Perceived complexity of Zero Trust implementation.
Emerging Opportunities in Software-Defined Perimeter Industry
Emerging opportunities in the Software-Defined Perimeter (SDP) industry lie in the expanding adoption by small and medium-sized businesses (SMBs) that are increasingly targeted by cybercriminals. The convergence of SDP with Security Service Edge (SSE) and Secure Access Service Edge (SASE) frameworks presents a significant growth avenue, offering a unified security and networking solution. Furthermore, the integration of advanced AI and machine learning capabilities for predictive threat analysis and automated incident response is creating new product differentiation. Untapped markets in developing regions, coupled with evolving consumer preferences for more user-friendly and mobile-first security solutions, represent considerable potential for market expansion.
Growth Accelerators in the Software-Defined Perimeter Industry Industry
The Software-Defined Perimeter (SDP) industry is experiencing significant growth acceleration fueled by continuous technological breakthroughs and strategic market expansion initiatives. The increasing demand for secure remote access solutions, amplified by the sustained shift towards hybrid work models, is a primary catalyst. Strategic partnerships between SDP providers and cloud service providers are further enhancing deployment flexibility and accessibility. Moreover, the growing realization among enterprises of the critical need to move beyond traditional security perimeters to a zero-trust model is driving substantial investment and adoption.
Key Players Shaping the Software-Defined Perimeter Industry Market
- Unisys Corporation
- Broadcom (Symantec)
- Safe-T Group Limited
- ZScaler
- Verizon Communications (Vidder)
- Cato Networks Limited
- Cisco Systems Inc
- Fortinet Corporation
- APPGate
- Perimeter
- Okta Inc
- Akamai Technologies Inc (Soha Systems)
- Palo Alto Networks Inc
- Check Point
Notable Milestones in Software-Defined Perimeter Industry Sector
- January 2023: InstaSafe, a Bangalore-based security service provider, announced the expansion of its product base across India and SAARC by partnering with iValue InfoSolutions, a technology services and solutions aggregator across India and South-East Asia. Both organizations are working towards promoting software-defined perimeter (SDP) based zero trust security solutions to address cloud security, identity management, and remote access across the Indian subcontinent.
- February 2022: Appgate, a software-defined perimeter (SDP) provider that controls access to IT platforms, announced that it had extended its SDP solution support for Kubernetes clusters for creating a zero-trust IT environment. The aim is to enable an IT team to employ a single framework to enforce a standard set of security policies across both legacy monolithic environments and the cloud-native applications that are now being deployed at a faster rate in production environments.
In-Depth Software-Defined Perimeter Industry Market Outlook
The Software-Defined Perimeter (SDP) industry is on a robust growth trajectory, driven by the indispensable need for secure and agile access control in today's distributed digital landscape. The forecast period is expected to witness sustained acceleration as organizations increasingly embrace zero-trust security models and the benefits of cloud-native solutions. Strategic opportunities abound in catering to the burgeoning SMB market, integrating SDP with emerging SASE and SSE frameworks, and embedding advanced AI for predictive security. The continued evolution of remote work policies and the ever-present threat of sophisticated cyberattacks will ensure SDP's prominence as a critical component of modern enterprise security strategies, offering substantial market potential for innovative players.
Software-Defined Perimeter Industry Segmentation
-
1. Type
- 1.1. Solutions
- 1.2. Services
-
2. Deployment Mode
- 2.1. Cloud
- 2.2. On-Premise
-
3. End-User Verticals
- 3.1. BFSI
- 3.2. Telecom and IT
- 3.3. Healthcare
- 3.4. Retail
- 3.5. Government
- 3.6. Other End-user Verticals
Software-Defined Perimeter Industry Segmentation By Geography
- 1. North America
- 2. Europe
- 3. Asia Pacific
- 4. Rest of the World
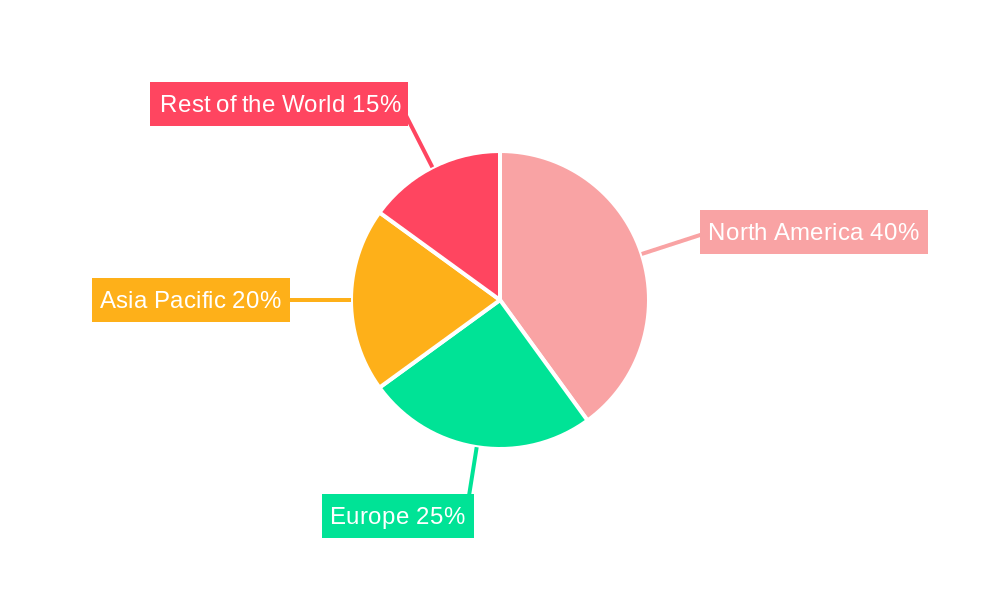
Software-Defined Perimeter Industry Regional Market Share
Geographic Coverage of Software-Defined Perimeter Industry
Software-Defined Perimeter Industry REPORT HIGHLIGHTS
| Aspects | Details |
|---|---|
| Study Period | 2020-2034 |
| Base Year | 2025 |
| Estimated Year | 2026 |
| Forecast Period | 2026-2034 |
| Historical Period | 2020-2025 |
| Growth Rate | CAGR of 27.39% from 2020-2034 |
| Segmentation |
|
Table of Contents
- 1. Introduction
- 1.1. Research Scope
- 1.2. Market Segmentation
- 1.3. Research Objective
- 1.4. Definitions and Assumptions
- 2. Executive Summary
- 2.1. Market Snapshot
- 3. Market Dynamics
- 3.1. Market Drivers
- 3.2. Market Restrains
- 3.3. Market Trends
- 3.4. Market Opportunities
- 4. Market Factor Analysis
- 4.1. Porters Five Forces
- 4.1.1. Bargaining Power of Suppliers
- 4.1.2. Bargaining Power of Buyers
- 4.1.3. Threat of New Entrants
- 4.1.4. Threat of Substitutes
- 4.1.5. Competitive Rivalry
- 4.2. PESTEL analysis
- 4.3. BCG Analysis
- 4.3.1. Stars (High Growth, High Market Share)
- 4.3.2. Cash Cows (Low Growth, High Market Share)
- 4.3.3. Question Mark (High Growth, Low Market Share)
- 4.3.4. Dogs (Low Growth, Low Market Share)
- 4.4. Ansoff Matrix Analysis
- 4.5. Supply Chain Analysis
- 4.6. Regulatory Landscape
- 4.7. Current Market Potential and Opportunity Assessment (TAM–SAM–SOM Framework)
- 4.8. IMR Analyst Note
- 4.1. Porters Five Forces
- 5. Market Analysis, Insights and Forecast 2021-2033
- 5.1. Market Analysis, Insights and Forecast - by Type
- 5.1.1. Solutions
- 5.1.2. Services
- 5.2. Market Analysis, Insights and Forecast - by Deployment Mode
- 5.2.1. Cloud
- 5.2.2. On-Premise
- 5.3. Market Analysis, Insights and Forecast - by End-User Verticals
- 5.3.1. BFSI
- 5.3.2. Telecom and IT
- 5.3.3. Healthcare
- 5.3.4. Retail
- 5.3.5. Government
- 5.3.6. Other End-user Verticals
- 5.4. Market Analysis, Insights and Forecast - by Region
- 5.4.1. North America
- 5.4.2. Europe
- 5.4.3. Asia Pacific
- 5.4.4. Rest of the World
- 5.1. Market Analysis, Insights and Forecast - by Type
- 6. Global Software-Defined Perimeter Industry Analysis, Insights and Forecast, 2021-2033
- 6.1. Market Analysis, Insights and Forecast - by Type
- 6.1.1. Solutions
- 6.1.2. Services
- 6.2. Market Analysis, Insights and Forecast - by Deployment Mode
- 6.2.1. Cloud
- 6.2.2. On-Premise
- 6.3. Market Analysis, Insights and Forecast - by End-User Verticals
- 6.3.1. BFSI
- 6.3.2. Telecom and IT
- 6.3.3. Healthcare
- 6.3.4. Retail
- 6.3.5. Government
- 6.3.6. Other End-user Verticals
- 6.1. Market Analysis, Insights and Forecast - by Type
- 7. North America Software-Defined Perimeter Industry Analysis, Insights and Forecast, 2020-2032
- 7.1. Market Analysis, Insights and Forecast - by Type
- 7.1.1. Solutions
- 7.1.2. Services
- 7.2. Market Analysis, Insights and Forecast - by Deployment Mode
- 7.2.1. Cloud
- 7.2.2. On-Premise
- 7.3. Market Analysis, Insights and Forecast - by End-User Verticals
- 7.3.1. BFSI
- 7.3.2. Telecom and IT
- 7.3.3. Healthcare
- 7.3.4. Retail
- 7.3.5. Government
- 7.3.6. Other End-user Verticals
- 7.1. Market Analysis, Insights and Forecast - by Type
- 8. Europe Software-Defined Perimeter Industry Analysis, Insights and Forecast, 2020-2032
- 8.1. Market Analysis, Insights and Forecast - by Type
- 8.1.1. Solutions
- 8.1.2. Services
- 8.2. Market Analysis, Insights and Forecast - by Deployment Mode
- 8.2.1. Cloud
- 8.2.2. On-Premise
- 8.3. Market Analysis, Insights and Forecast - by End-User Verticals
- 8.3.1. BFSI
- 8.3.2. Telecom and IT
- 8.3.3. Healthcare
- 8.3.4. Retail
- 8.3.5. Government
- 8.3.6. Other End-user Verticals
- 8.1. Market Analysis, Insights and Forecast - by Type
- 9. Asia Pacific Software-Defined Perimeter Industry Analysis, Insights and Forecast, 2020-2032
- 9.1. Market Analysis, Insights and Forecast - by Type
- 9.1.1. Solutions
- 9.1.2. Services
- 9.2. Market Analysis, Insights and Forecast - by Deployment Mode
- 9.2.1. Cloud
- 9.2.2. On-Premise
- 9.3. Market Analysis, Insights and Forecast - by End-User Verticals
- 9.3.1. BFSI
- 9.3.2. Telecom and IT
- 9.3.3. Healthcare
- 9.3.4. Retail
- 9.3.5. Government
- 9.3.6. Other End-user Verticals
- 9.1. Market Analysis, Insights and Forecast - by Type
- 10. Rest of the World Software-Defined Perimeter Industry Analysis, Insights and Forecast, 2020-2032
- 10.1. Market Analysis, Insights and Forecast - by Type
- 10.1.1. Solutions
- 10.1.2. Services
- 10.2. Market Analysis, Insights and Forecast - by Deployment Mode
- 10.2.1. Cloud
- 10.2.2. On-Premise
- 10.3. Market Analysis, Insights and Forecast - by End-User Verticals
- 10.3.1. BFSI
- 10.3.2. Telecom and IT
- 10.3.3. Healthcare
- 10.3.4. Retail
- 10.3.5. Government
- 10.3.6. Other End-user Verticals
- 10.1. Market Analysis, Insights and Forecast - by Type
- 11. Competitive Analysis
- 11.1. Company Profiles
- 11.1.1 Unisys Corporation
- 11.1.1.1. Company Overview
- 11.1.1.2. Products
- 11.1.1.3. Company Financials
- 11.1.1.4. SWOT Analysis
- 11.1.2 Broadcom (Symantec)
- 11.1.2.1. Company Overview
- 11.1.2.2. Products
- 11.1.2.3. Company Financials
- 11.1.2.4. SWOT Analysis
- 11.1.3 Safe-T Group Limited
- 11.1.3.1. Company Overview
- 11.1.3.2. Products
- 11.1.3.3. Company Financials
- 11.1.3.4. SWOT Analysis
- 11.1.4 ZScaler
- 11.1.4.1. Company Overview
- 11.1.4.2. Products
- 11.1.4.3. Company Financials
- 11.1.4.4. SWOT Analysis
- 11.1.5 Verizon Communications (Vidder)*List Not Exhaustive
- 11.1.5.1. Company Overview
- 11.1.5.2. Products
- 11.1.5.3. Company Financials
- 11.1.5.4. SWOT Analysis
- 11.1.6 Cato Networks Limited
- 11.1.6.1. Company Overview
- 11.1.6.2. Products
- 11.1.6.3. Company Financials
- 11.1.6.4. SWOT Analysis
- 11.1.7 Cisco Systems Inc
- 11.1.7.1. Company Overview
- 11.1.7.2. Products
- 11.1.7.3. Company Financials
- 11.1.7.4. SWOT Analysis
- 11.1.8 Fortinent Corporation
- 11.1.8.1. Company Overview
- 11.1.8.2. Products
- 11.1.8.3. Company Financials
- 11.1.8.4. SWOT Analysis
- 11.1.9 APPGate
- 11.1.9.1. Company Overview
- 11.1.9.2. Products
- 11.1.9.3. Company Financials
- 11.1.9.4. SWOT Analysis
- 11.1.10 Perimeter
- 11.1.10.1. Company Overview
- 11.1.10.2. Products
- 11.1.10.3. Company Financials
- 11.1.10.4. SWOT Analysis
- 11.1.11 Okta Inc
- 11.1.11.1. Company Overview
- 11.1.11.2. Products
- 11.1.11.3. Company Financials
- 11.1.11.4. SWOT Analysis
- 11.1.12 Akamai Technologies Inc (Soha Systems)
- 11.1.12.1. Company Overview
- 11.1.12.2. Products
- 11.1.12.3. Company Financials
- 11.1.12.4. SWOT Analysis
- 11.1.13 Palo Alto Networks Inc
- 11.1.13.1. Company Overview
- 11.1.13.2. Products
- 11.1.13.3. Company Financials
- 11.1.13.4. SWOT Analysis
- 11.1.14 Check Point
- 11.1.14.1. Company Overview
- 11.1.14.2. Products
- 11.1.14.3. Company Financials
- 11.1.14.4. SWOT Analysis
- 11.1.1 Unisys Corporation
- 11.2. Market Entropy
- 11.2.1 Company's Key Areas Served
- 11.2.2 Recent Developments
- 11.3. Company Market Share Analysis 2025
- 11.3.1 Top 5 Companies Market Share Analysis
- 11.3.2 Top 3 Companies Market Share Analysis
- 11.4. List of Potential Customers
- 12. Research Methodology
List of Figures
- Figure 1: Global Software-Defined Perimeter Industry Revenue Breakdown (Million, %) by Region 2025 & 2033
- Figure 2: North America Software-Defined Perimeter Industry Revenue (Million), by Type 2025 & 2033
- Figure 3: North America Software-Defined Perimeter Industry Revenue Share (%), by Type 2025 & 2033
- Figure 4: North America Software-Defined Perimeter Industry Revenue (Million), by Deployment Mode 2025 & 2033
- Figure 5: North America Software-Defined Perimeter Industry Revenue Share (%), by Deployment Mode 2025 & 2033
- Figure 6: North America Software-Defined Perimeter Industry Revenue (Million), by End-User Verticals 2025 & 2033
- Figure 7: North America Software-Defined Perimeter Industry Revenue Share (%), by End-User Verticals 2025 & 2033
- Figure 8: North America Software-Defined Perimeter Industry Revenue (Million), by Country 2025 & 2033
- Figure 9: North America Software-Defined Perimeter Industry Revenue Share (%), by Country 2025 & 2033
- Figure 10: Europe Software-Defined Perimeter Industry Revenue (Million), by Type 2025 & 2033
- Figure 11: Europe Software-Defined Perimeter Industry Revenue Share (%), by Type 2025 & 2033
- Figure 12: Europe Software-Defined Perimeter Industry Revenue (Million), by Deployment Mode 2025 & 2033
- Figure 13: Europe Software-Defined Perimeter Industry Revenue Share (%), by Deployment Mode 2025 & 2033
- Figure 14: Europe Software-Defined Perimeter Industry Revenue (Million), by End-User Verticals 2025 & 2033
- Figure 15: Europe Software-Defined Perimeter Industry Revenue Share (%), by End-User Verticals 2025 & 2033
- Figure 16: Europe Software-Defined Perimeter Industry Revenue (Million), by Country 2025 & 2033
- Figure 17: Europe Software-Defined Perimeter Industry Revenue Share (%), by Country 2025 & 2033
- Figure 18: Asia Pacific Software-Defined Perimeter Industry Revenue (Million), by Type 2025 & 2033
- Figure 19: Asia Pacific Software-Defined Perimeter Industry Revenue Share (%), by Type 2025 & 2033
- Figure 20: Asia Pacific Software-Defined Perimeter Industry Revenue (Million), by Deployment Mode 2025 & 2033
- Figure 21: Asia Pacific Software-Defined Perimeter Industry Revenue Share (%), by Deployment Mode 2025 & 2033
- Figure 22: Asia Pacific Software-Defined Perimeter Industry Revenue (Million), by End-User Verticals 2025 & 2033
- Figure 23: Asia Pacific Software-Defined Perimeter Industry Revenue Share (%), by End-User Verticals 2025 & 2033
- Figure 24: Asia Pacific Software-Defined Perimeter Industry Revenue (Million), by Country 2025 & 2033
- Figure 25: Asia Pacific Software-Defined Perimeter Industry Revenue Share (%), by Country 2025 & 2033
- Figure 26: Rest of the World Software-Defined Perimeter Industry Revenue (Million), by Type 2025 & 2033
- Figure 27: Rest of the World Software-Defined Perimeter Industry Revenue Share (%), by Type 2025 & 2033
- Figure 28: Rest of the World Software-Defined Perimeter Industry Revenue (Million), by Deployment Mode 2025 & 2033
- Figure 29: Rest of the World Software-Defined Perimeter Industry Revenue Share (%), by Deployment Mode 2025 & 2033
- Figure 30: Rest of the World Software-Defined Perimeter Industry Revenue (Million), by End-User Verticals 2025 & 2033
- Figure 31: Rest of the World Software-Defined Perimeter Industry Revenue Share (%), by End-User Verticals 2025 & 2033
- Figure 32: Rest of the World Software-Defined Perimeter Industry Revenue (Million), by Country 2025 & 2033
- Figure 33: Rest of the World Software-Defined Perimeter Industry Revenue Share (%), by Country 2025 & 2033
List of Tables
- Table 1: Global Software-Defined Perimeter Industry Revenue Million Forecast, by Type 2020 & 2033
- Table 2: Global Software-Defined Perimeter Industry Revenue Million Forecast, by Deployment Mode 2020 & 2033
- Table 3: Global Software-Defined Perimeter Industry Revenue Million Forecast, by End-User Verticals 2020 & 2033
- Table 4: Global Software-Defined Perimeter Industry Revenue Million Forecast, by Region 2020 & 2033
- Table 5: Global Software-Defined Perimeter Industry Revenue Million Forecast, by Type 2020 & 2033
- Table 6: Global Software-Defined Perimeter Industry Revenue Million Forecast, by Deployment Mode 2020 & 2033
- Table 7: Global Software-Defined Perimeter Industry Revenue Million Forecast, by End-User Verticals 2020 & 2033
- Table 8: Global Software-Defined Perimeter Industry Revenue Million Forecast, by Country 2020 & 2033
- Table 9: Global Software-Defined Perimeter Industry Revenue Million Forecast, by Type 2020 & 2033
- Table 10: Global Software-Defined Perimeter Industry Revenue Million Forecast, by Deployment Mode 2020 & 2033
- Table 11: Global Software-Defined Perimeter Industry Revenue Million Forecast, by End-User Verticals 2020 & 2033
- Table 12: Global Software-Defined Perimeter Industry Revenue Million Forecast, by Country 2020 & 2033
- Table 13: Global Software-Defined Perimeter Industry Revenue Million Forecast, by Type 2020 & 2033
- Table 14: Global Software-Defined Perimeter Industry Revenue Million Forecast, by Deployment Mode 2020 & 2033
- Table 15: Global Software-Defined Perimeter Industry Revenue Million Forecast, by End-User Verticals 2020 & 2033
- Table 16: Global Software-Defined Perimeter Industry Revenue Million Forecast, by Country 2020 & 2033
- Table 17: Global Software-Defined Perimeter Industry Revenue Million Forecast, by Type 2020 & 2033
- Table 18: Global Software-Defined Perimeter Industry Revenue Million Forecast, by Deployment Mode 2020 & 2033
- Table 19: Global Software-Defined Perimeter Industry Revenue Million Forecast, by End-User Verticals 2020 & 2033
- Table 20: Global Software-Defined Perimeter Industry Revenue Million Forecast, by Country 2020 & 2033
Frequently Asked Questions
1. What is the projected Compound Annual Growth Rate (CAGR) of the Software-Defined Perimeter Industry?
The projected CAGR is approximately 27.39%.
2. Which companies are prominent players in the Software-Defined Perimeter Industry?
Key companies in the market include Unisys Corporation, Broadcom (Symantec), Safe-T Group Limited, ZScaler, Verizon Communications (Vidder)*List Not Exhaustive, Cato Networks Limited, Cisco Systems Inc, Fortinent Corporation, APPGate, Perimeter, Okta Inc, Akamai Technologies Inc (Soha Systems), Palo Alto Networks Inc, Check Point.
3. What are the main segments of the Software-Defined Perimeter Industry?
The market segments include Type, Deployment Mode, End-User Verticals.
4. Can you provide details about the market size?
The market size is estimated to be USD 9.06 Million as of 2022.
5. What are some drivers contributing to market growth?
Ongoing Migration to The Cloud. Adoption of IoT & BYOD; Stringent Data Compliance Requirements and Need for Scalable Data Safeguarding Strategies.
6. What are the notable trends driving market growth?
BFSI Sector Will Experience Significant Growth.
7. Are there any restraints impacting market growth?
Growing Demand for Open-Source Security Standards.
8. Can you provide examples of recent developments in the market?
January 2023: InstaSafe, a Bangalore-based security service provider, announced the expansion of its product base across India and SAARC by partnering with iValue InfoSolutions, a technology services and solutions aggregator across India and South-East Asia. Both organizations are working towards promoting software-defined perimeter (SDP) based zero trust security solutions to address cloud security, identity management, and remote access across the Indian subcontinent.
9. What pricing options are available for accessing the report?
Pricing options include single-user, multi-user, and enterprise licenses priced at USD 4750, USD 5250, and USD 8750 respectively.
10. Is the market size provided in terms of value or volume?
The market size is provided in terms of value, measured in Million.
11. Are there any specific market keywords associated with the report?
Yes, the market keyword associated with the report is "Software-Defined Perimeter Industry," which aids in identifying and referencing the specific market segment covered.
12. How do I determine which pricing option suits my needs best?
The pricing options vary based on user requirements and access needs. Individual users may opt for single-user licenses, while businesses requiring broader access may choose multi-user or enterprise licenses for cost-effective access to the report.
13. Are there any additional resources or data provided in the Software-Defined Perimeter Industry report?
While the report offers comprehensive insights, it's advisable to review the specific contents or supplementary materials provided to ascertain if additional resources or data are available.
14. How can I stay updated on further developments or reports in the Software-Defined Perimeter Industry?
To stay informed about further developments, trends, and reports in the Software-Defined Perimeter Industry, consider subscribing to industry newsletters, following relevant companies and organizations, or regularly checking reputable industry news sources and publications.
Methodology
Step 1 - Identification of Relevant Samples Size from Population Database


Step 2 - Approaches for Defining Global Market Size (Value, Volume* & Price*)

Note*: In applicable scenarios
Step 3 - Data Sources
Primary Research
- Web Analytics
- Survey Reports
- Research Institute
- Latest Research Reports
- Opinion Leaders
Secondary Research
- Annual Reports
- White Paper
- Latest Press Release
- Industry Association
- Paid Database
- Investor Presentations

Step 4 - Data Triangulation
Involves using different sources of information in order to increase the validity of a study
These sources are likely to be stakeholders in a program - participants, other researchers, program staff, other community members, and so on.
Then we put all data in single framework & apply various statistical tools to find out the dynamic on the market.
During the analysis stage, feedback from the stakeholder groups would be compared to determine areas of agreement as well as areas of divergence