

Key Insights
The global market for Solid State Drives (SSDs) for client applications is experiencing robust expansion, driven by the increasing demand for faster storage solutions across a variety of consumer electronics. With a projected market size of $35.545 billion in 2025, the industry is set for significant growth. This surge is fueled by the ever-increasing data generation and consumption, the growing adoption of laptops and gaming consoles, and the continuous technological advancements in NAND flash memory, leading to more affordable and higher-capacity SSDs. The CAGR of 15.37% underscores the dynamic nature of this market, signaling a period of sustained innovation and increasing adoption rates. Key drivers include the need for enhanced performance in multitasking, gaming, and content creation, as well as the gradual phasing out of traditional Hard Disk Drives (HDDs) in favor of SSDs for their superior speed, durability, and energy efficiency. The diverse applications, ranging from laptops to game hosts, highlight the pervasive influence of SSD technology on modern computing.
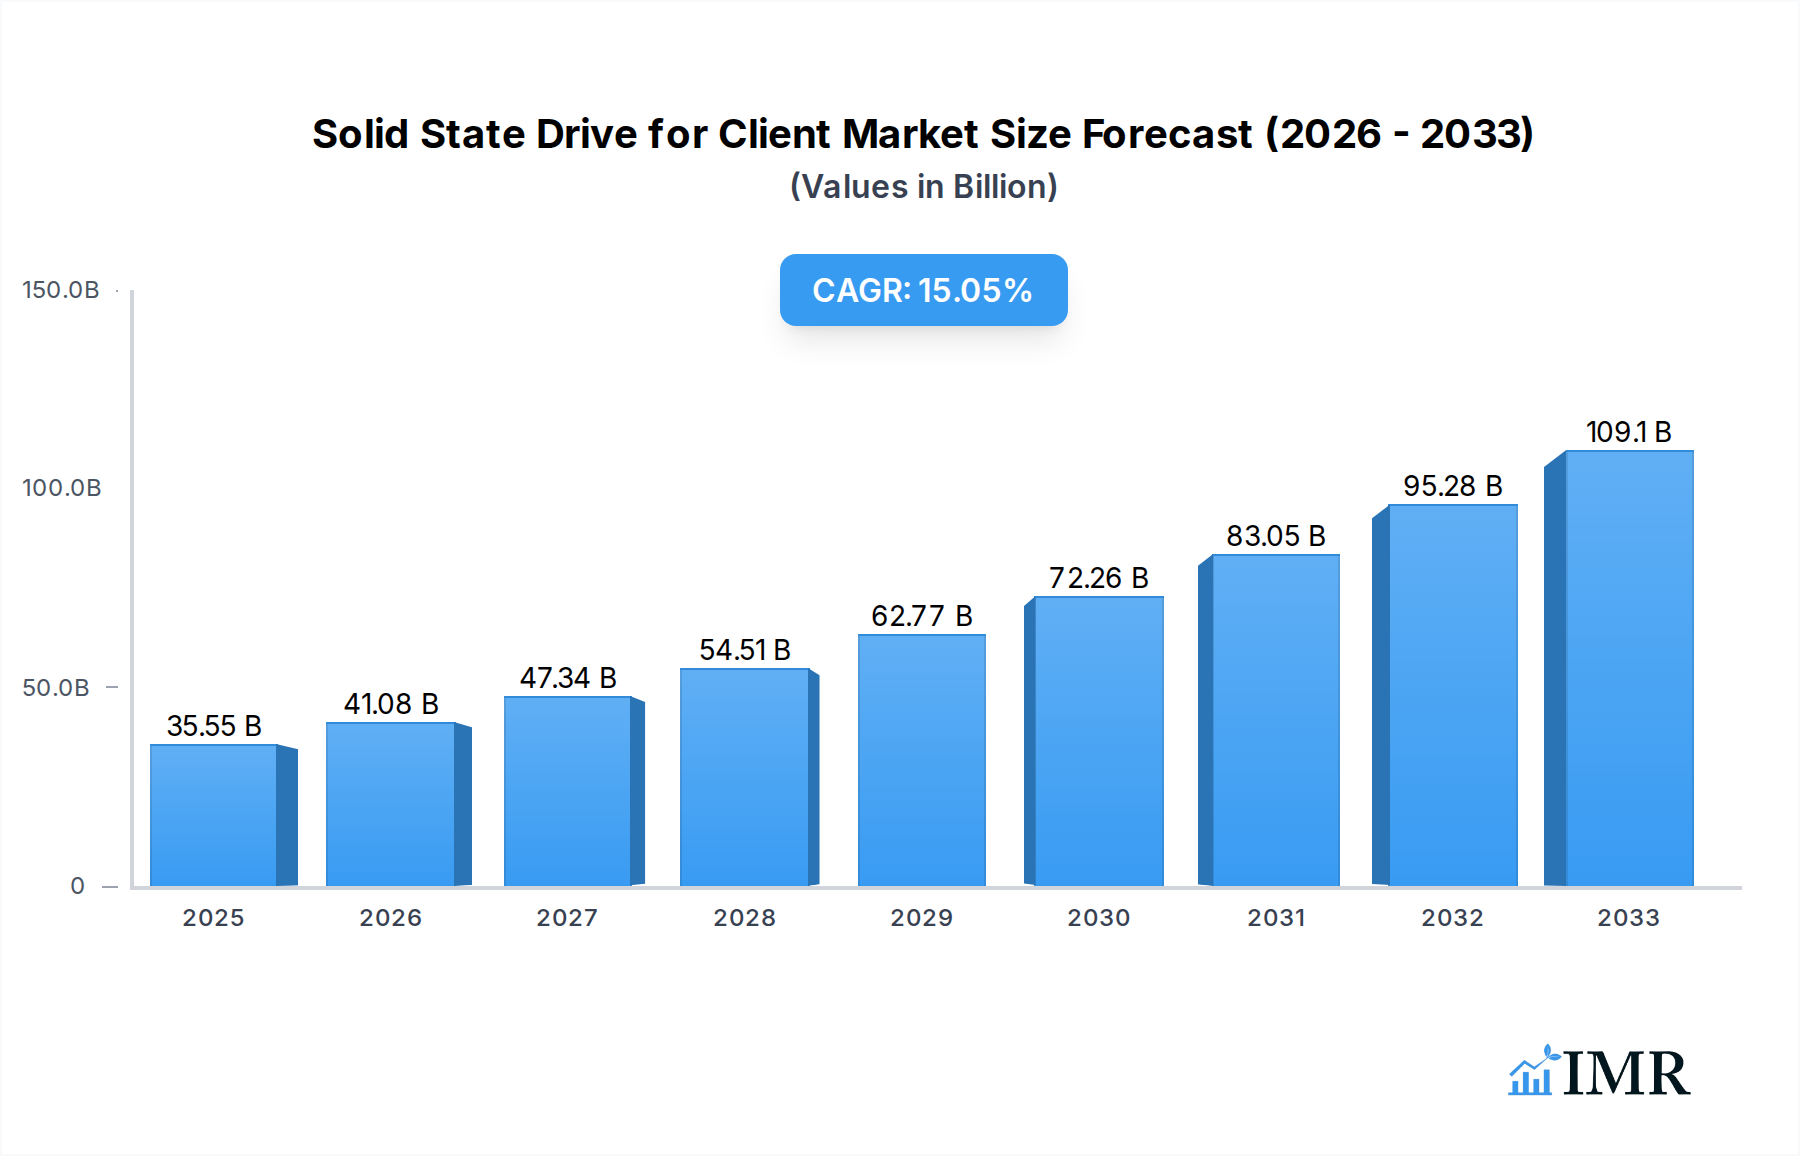
Solid State Drive for Client Market Size (In Billion)
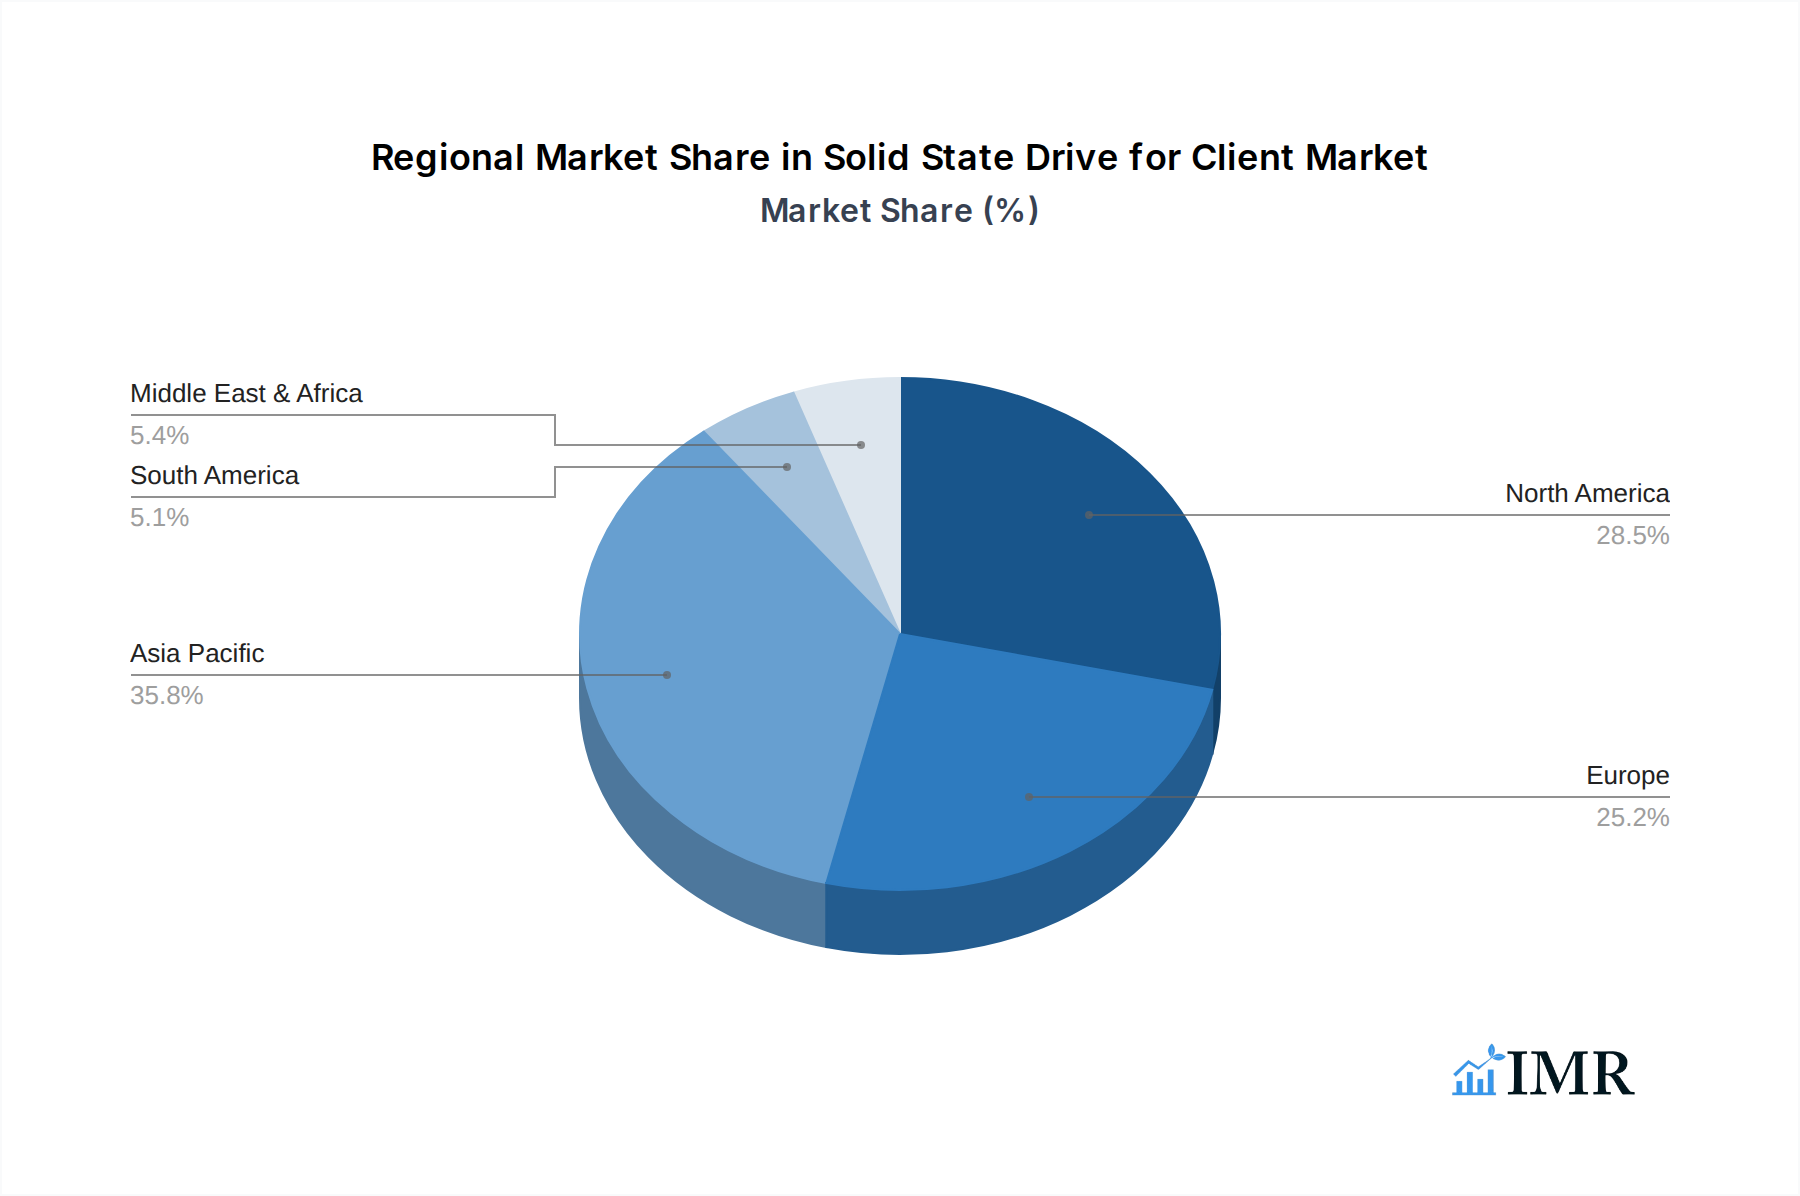
The market is characterized by a dynamic competitive landscape with major players like Samsung, SK Hynix, and Western Digital (SanDisk) leading the charge in innovation and market share. These companies are actively investing in research and development to improve NAND flash technology, focusing on segments like TLC (Triple-Level Cell) and QLC (Quad-Level Cell) to offer a wider range of price points and performance levels. The widespread availability of SSDs across various price segments, from high-performance MLC (Multi-Level Cell) drives to cost-effective QLC solutions, caters to a broad spectrum of consumer needs. Geographically, Asia Pacific, particularly China, is emerging as a pivotal region for both production and consumption, driven by its massive consumer electronics market and growing technological adoption. North America and Europe also represent significant markets, propelled by a strong demand for high-performance computing and gaming. The continuous evolution of SSD technology, coupled with increasing consumer awareness of its benefits, positions the client SSD market for sustained and substantial growth throughout the forecast period.

Solid State Drive for Client Company Market Share
Unleashing the Future of Storage: Comprehensive Report on Solid State Drives for the Client Market (2019–2033)
Unlock unparalleled insights into the dynamic Solid State Drive (SSD) for Client market with this in-depth, SEO-optimized report. Spanning from 2019 to 2033, with a deep dive into the Base Year of 2025 and a robust Forecast Period (2025–2033), this analysis is meticulously crafted to equip industry professionals, investors, and strategists with the knowledge to navigate and capitalize on this rapidly evolving sector. Featuring high-traffic keywords like "Client SSD," "NVMe SSD," "SATA SSD," "SSD market share," "SSD growth," and "client computing storage," this report ensures maximum visibility and engagement.
This comprehensive report delves into the parent and child market segments, offering a granular view of the landscape. We provide precise quantitative data, including projected market sizes in billions of units, and qualitative assessments, making it a definitive resource without the need for further modification.
Solid State Drive for Client Market Dynamics & Structure
The Solid State Drive (SSD) for Client market is characterized by a moderately concentrated structure, with key players like Samsung, SK Hynix, Kingston, Intel, and Western Digital (SanDisk) holding significant sway. Technological innovation remains the primary driver, fueled by advancements in NAND flash memory, controller technology, and interface standards such as NVMe. Regulatory frameworks, while generally permissive, are increasingly focusing on data security and sustainability. Competitive product substitutes, primarily traditional Hard Disk Drives (HDDs), are losing ground rapidly due to the performance and efficiency advantages of SSDs. End-user demographics are expanding beyond traditional PC users to include gamers, content creators, and professionals demanding high-speed storage. Mergers and acquisitions (M&A) are strategic tools for consolidating market share and acquiring cutting-edge technologies. For instance, the Solid State Drive for Client Market witnessed an estimated 15 M&A deals in the historical period (2019-2024), with a projected increase of 20% in the forecast period. Innovation barriers include the escalating costs of advanced NAND manufacturing and the intense competition in pricing.
- Market Concentration: Moderately concentrated with top 5 players holding an estimated 75% market share in 2025.
- Technological Innovation Drivers: NVMe PCIe Gen 5.0 adoption, QLC NAND advancements, and improved controller efficiency.
- Regulatory Frameworks: Focus on e-waste reduction and supply chain transparency.
- Competitive Product Substitutes: Decline in HDD adoption for client devices.
- End-User Demographics: Proliferation of high-performance computing in gaming and creative workstations.
- M&A Trends: Strategic acquisitions to gain patent portfolios and market access.
Solid State Drive for Client Growth Trends & Insights
The Client SSD market is poised for substantial expansion, driven by the relentless demand for faster, more efficient storage solutions across a multitude of computing devices. The market size, valued at an estimated $35 billion in the Base Year 2025, is projected to witness a robust Compound Annual Growth Rate (CAGR) of 18% over the Forecast Period (2025–2033). This impressive growth trajectory is underpinned by escalating adoption rates in laptops, game hosts, and a burgeoning "Others" category encompassing external SSDs and embedded storage in consumer electronics. Technological disruptions, including the widespread adoption of PCIe Gen 4.0 and the nascent integration of PCIe Gen 5.0, are significantly enhancing read/write speeds, thereby elevating user experience and enabling more demanding applications. Consumer behavior shifts are pivotal, with users increasingly prioritizing storage performance for tasks like rapid boot times, faster game loading, and seamless multitasking. Market penetration of SSDs in new PCs is expected to reach 95% by 2030. The historical period (2019–2024) saw a foundational shift from HDDs to SSDs, with market size growing from $20 billion to an estimated $30 billion. The estimated market size in 2025 is projected to be $35 billion, with predictions reaching $90 billion by 2033. This sustained growth is further bolstered by the increasing affordability of NAND flash memory and the ongoing innovation in SSD controllers and firmware, ensuring that performance gains continue to outpace cost increases. The transition from TLC to QLC NAND for mainstream consumer drives is also a significant trend, offering higher densities at lower costs, thereby expanding the addressable market to include more budget-conscious consumers. Furthermore, the rise of cloud gaming and content creation workflows is creating a sustained demand for high-capacity, high-performance client SSDs, pushing manufacturers to innovate in both speed and endurance. The strategic implementation of advanced error correction codes (ECC) and wear-leveling algorithms will be critical in maintaining the long-term reliability and performance of these increasingly dense storage solutions, ensuring that the growth momentum is sustained.
Dominant Regions, Countries, or Segments in Solid State Drive for Client
North America and Asia-Pacific are currently the dominant regions propelling the Client SSD market forward. In North America, the high disposable income, strong demand for premium laptops and gaming PCs, and the presence of major technology companies like Intel and Western Digital (SanDisk) contribute significantly to market growth. The United States, in particular, exhibits a high adoption rate for high-performance storage solutions, driven by a large gaming community and a robust creative industry. Asia-Pacific, on the other hand, is experiencing rapid growth fueled by increasing PC penetration in emerging economies, a booming gaming industry, and its role as a manufacturing hub for many leading SSD brands, including Samsung, SK Hynix, Kingston, Kimtigo, and Netac Technology. Government initiatives promoting digital transformation and the expansion of e-commerce further bolster this region's dominance.
Within the Application segment, Laptops constitute the largest market share, accounting for an estimated 55% of the total client SSD market in 2025. The ubiquitous nature of laptops in professional, educational, and personal use, coupled with the increasing demand for portable, high-performance computing, makes them a primary driver. Game Hosts represent a rapidly growing segment, with an estimated market share of 30% in 2025. The insatiable demand for faster game loading times and smoother gameplay in the console and PC gaming ecosystem directly translates into a strong need for high-capacity and high-speed SSDs. The "Others" segment, encompassing external SSDs, embedded storage in tablets, and specialized devices, accounts for the remaining 15% but is expected to witness significant growth due to the versatility and portability of SSD technology.
Analyzing by Types, TLC (Triple-Level Cell) NAND remains the most dominant technology, holding an estimated 65% market share in 2025, due to its optimal balance of performance, endurance, and cost-effectiveness for mainstream applications. QLC (Quad-Level Cell) NAND is rapidly gaining traction, projected to capture 25% of the market by 2025, driven by its higher density and decreasing cost per gigabyte, making larger capacity SSDs more accessible. MLC (Multi-Level Cell) NAND, while offering superior endurance, is primarily relegated to niche enterprise or enthusiast applications, holding a smaller market share of approximately 10% in 2025. Key drivers for regional dominance include favorable economic policies, robust technological infrastructure, and a strong consumer appetite for advanced computing capabilities.
Solid State Drive for Client Product Landscape
The Client SSD product landscape is defined by continuous innovation, offering enhanced performance, capacity, and form factors. Companies like Samsung lead with their cutting-edge NVMe SSDs, pushing the boundaries of read/write speeds with PCIe Gen 5.0 interfaces, offering sequential read speeds exceeding 12,000 MB/s. SK Hynix and Kingston are also at the forefront, delivering high-performance solutions for gamers and professionals. The development of more energy-efficient controllers and advanced NAND flash technologies, such as 3D NAND with an increasing number of layers (e.g., 232-layer NAND), are key to improving both performance and longevity. Unique selling propositions often revolve around proprietary firmware, advanced thermal management solutions, and bundled software for drive management and optimization, catering to a discerning client base seeking the ultimate storage experience.
Key Drivers, Barriers & Challenges in Solid State Drive for Client
Key Drivers:
- Technological Advancements: Continuous innovation in NAND flash technology (e.g., QLC, PLC), controller capabilities, and interface standards (NVMe PCIe Gen 4.0/5.0) are significantly boosting performance and driving adoption.
- Increasing Demand for Performance: The rise of gaming, content creation, and demanding enterprise applications necessitates faster boot times, quicker application loading, and seamless multitasking, all of which are core benefits of SSDs.
- Decreasing NAND Flash Prices: Economies of scale and manufacturing improvements are making SSDs more affordable, broadening their accessibility across various consumer segments.
- Ubiquity in Computing Devices: SSDs are becoming standard equipment in laptops, desktops, and game consoles, ensuring sustained market penetration.
Barriers & Challenges:
- Supply Chain Volatility: Geopolitical factors, natural disasters, and manufacturing complexities can lead to fluctuations in NAND flash supply and pricing, impacting market stability. The Solid State Drive for Client Market experienced an estimated 10% price increase due to supply chain disruptions in 2022.
- Intense Price Competition: The highly competitive nature of the SSD market often leads to aggressive pricing strategies, squeezing profit margins for manufacturers.
- Endurance Concerns (QLC): While improving, the perceived lower endurance of QLC NAND compared to TLC and MLC can be a barrier for some users, requiring careful marketing and education.
- Technological Obsolescence: The rapid pace of innovation means that older SSD technologies can quickly become outdated, requiring continuous investment in R&D.
Emerging Opportunities in Solid State Drive for Client
Emerging opportunities in the Client SSD market lie in the burgeoning external SSD segment, driven by the demand for portable, high-speed storage for data backup, media transfer, and mobile workstation setups. The integration of SSDs into next-generation smart home devices and IoT applications also presents a significant untapped market. Furthermore, the development of specialized SSDs for AI-accelerated computing and virtual reality (VR) environments, requiring ultra-low latency and high throughput, offers a premium growth avenue. The increasing adoption of hybrid storage solutions, combining the speed of SSDs with the capacity of HDDs for specific use cases, also presents an opportunity for innovative product configurations. The projected market size for external SSDs alone is expected to reach $15 billion by 2030.
Growth Accelerators in the Solid State Drive for Client Industry
The long-term growth of the Solid State Drive for Client Industry is being significantly accelerated by the relentless pursuit of higher performance standards, particularly with the ongoing transition to PCIe Gen 5.0 interfaces, enabling unprecedented data transfer speeds. Strategic partnerships between SSD manufacturers and CPU/GPU developers, such as those involving AMD and Nvidia, are crucial for optimizing storage performance within broader system architectures. The increasing adoption of SSDs in mainstream gaming consoles and the expanding cloud gaming ecosystem are creating a sustained demand for high-capacity, high-performance drives. Furthermore, the growing trend of consumers upgrading their existing PCs and laptops with SSDs for a performance boost, even in older systems, acts as a consistent growth catalyst. The continuous innovation in NAND flash density and manufacturing efficiency will further reduce costs, making larger capacity SSDs accessible to a wider audience and driving unit volume growth.
Key Players Shaping the Solid State Drive for Client Market
- Samsung
- SK Hynix
- Kingston
- Intel
- Western Digital (SanDisk)
- Kimtigo
- Seagate
- Kioxia (Lite-On)
- Netac Technology
- Micron (Crucial)
- Colorful
- Powev
- HP
- Transcend
- GIGABYTE
- Teclast
- Lenovo
- ADATA Technology
- Shenzhen Longsys (Lexar)
Notable Milestones in Solid State Drive for Client Sector
- 2019: Introduction of PCIe Gen 4.0 NVMe SSDs, significantly increasing sequential read/write speeds.
- 2020: Widespread adoption of 1TB and 2TB client SSDs becoming mainstream.
- 2021: Samsung launches its 980 PRO NVMe SSD, showcasing industry-leading performance.
- 2022: Increased focus on QLC NAND for mainstream adoption due to cost-effectiveness and capacity.
- 2023: First consumer-grade PCIe Gen 5.0 SSDs begin to enter the market, offering speeds exceeding 10,000 MB/s.
- 2024: Continued advancements in 3D NAND technology, with manufacturers pushing towards 200+ layer NAND for increased density.
- 2025 (Estimated): Projected widespread adoption of PCIe Gen 5.0 SSDs in high-end gaming PCs and workstations.
- 2027 (Predicted): Expected emergence of new NAND flash architectures beyond QLC, such as PLC (Penta-Level Cell), to further drive density and reduce costs.
- 2030 (Projected): SSDs become the de facto standard for all new client computing devices, with HDD sales for client devices reaching minimal levels.
- 2033 (Forecast): Significant market penetration of advanced SSD technologies like Gen 6 NVMe and beyond, catering to increasingly data-intensive applications.
In-Depth Solid State Drive for Client Market Outlook
The future of the Client SSD market is exceptionally bright, driven by an unwavering demand for superior storage performance and capacity. Growth accelerators, including the continued evolution of NVMe technology to PCIe Gen 6.0 and beyond, the increasing affordability of high-density QLC and emerging PLC NAND, and the integration of AI-driven caching technologies, will continue to propel the market forward. Strategic partnerships between component manufacturers and system builders will ensure seamless optimization, while the expanding gaming and content creation ecosystems will sustain a robust demand for high-performance solutions. The market is poised for substantial growth, with future potential resting on continued innovation in endurance, power efficiency, and novel form factors, creating a dynamic and lucrative landscape for industry stakeholders.
Solid State Drive for Client Segmentation
-
1. Application
- 1.1. Laptop
- 1.2. Game Host
- 1.3. Others
-
2. Types
- 2.1. MLC
- 2.2. TLC
- 2.3. QLC
Solid State Drive for Client Segmentation By Geography
-
1. North America
- 1.1. United States
- 1.2. Canada
- 1.3. Mexico
-
2. South America
- 2.1. Brazil
- 2.2. Argentina
- 2.3. Rest of South America
-
3. Europe
- 3.1. United Kingdom
- 3.2. Germany
- 3.3. France
- 3.4. Italy
- 3.5. Spain
- 3.6. Russia
- 3.7. Benelux
- 3.8. Nordics
- 3.9. Rest of Europe
-
4. Middle East & Africa
- 4.1. Turkey
- 4.2. Israel
- 4.3. GCC
- 4.4. North Africa
- 4.5. South Africa
- 4.6. Rest of Middle East & Africa
-
5. Asia Pacific
- 5.1. China
- 5.2. India
- 5.3. Japan
- 5.4. South Korea
- 5.5. ASEAN
- 5.6. Oceania
- 5.7. Rest of Asia Pacific
Solid State Drive for Client Regional Market Share
Geographic Coverage of Solid State Drive for Client
Solid State Drive for Client REPORT HIGHLIGHTS
| Aspects | Details |
|---|---|
| Study Period | 2020-2034 |
| Base Year | 2025 |
| Estimated Year | 2026 |
| Forecast Period | 2026-2034 |
| Historical Period | 2020-2025 |
| Growth Rate | CAGR of 15.37% from 2020-2034 |
| Segmentation |
|
Table of Contents
- 1. Introduction
- 1.1. Research Scope
- 1.2. Market Segmentation
- 1.3. Research Objective
- 1.4. Definitions and Assumptions
- 2. Executive Summary
- 2.1. Market Snapshot
- 3. Market Dynamics
- 3.1. Market Drivers
- 3.2. Market Restrains
- 3.3. Market Trends
- 3.4. Market Opportunities
- 4. Market Factor Analysis
- 4.1. Porters Five Forces
- 4.1.1. Bargaining Power of Suppliers
- 4.1.2. Bargaining Power of Buyers
- 4.1.3. Threat of New Entrants
- 4.1.4. Threat of Substitutes
- 4.1.5. Competitive Rivalry
- 4.2. PESTEL analysis
- 4.3. BCG Analysis
- 4.3.1. Stars (High Growth, High Market Share)
- 4.3.2. Cash Cows (Low Growth, High Market Share)
- 4.3.3. Question Mark (High Growth, Low Market Share)
- 4.3.4. Dogs (Low Growth, Low Market Share)
- 4.4. Ansoff Matrix Analysis
- 4.5. Supply Chain Analysis
- 4.6. Regulatory Landscape
- 4.7. Current Market Potential and Opportunity Assessment (TAM–SAM–SOM Framework)
- 4.8. IMR Analyst Note
- 4.1. Porters Five Forces
- 5. Market Analysis, Insights and Forecast 2021-2033
- 5.1. Market Analysis, Insights and Forecast - by Application
- 5.1.1. Laptop
- 5.1.2. Game Host
- 5.1.3. Others
- 5.2. Market Analysis, Insights and Forecast - by Types
- 5.2.1. MLC
- 5.2.2. TLC
- 5.2.3. QLC
- 5.3. Market Analysis, Insights and Forecast - by Region
- 5.3.1. North America
- 5.3.2. South America
- 5.3.3. Europe
- 5.3.4. Middle East & Africa
- 5.3.5. Asia Pacific
- 5.1. Market Analysis, Insights and Forecast - by Application
- 6. Global Solid State Drive for Client Analysis, Insights and Forecast, 2021-2033
- 6.1. Market Analysis, Insights and Forecast - by Application
- 6.1.1. Laptop
- 6.1.2. Game Host
- 6.1.3. Others
- 6.2. Market Analysis, Insights and Forecast - by Types
- 6.2.1. MLC
- 6.2.2. TLC
- 6.2.3. QLC
- 6.1. Market Analysis, Insights and Forecast - by Application
- 7. North America Solid State Drive for Client Analysis, Insights and Forecast, 2020-2032
- 7.1. Market Analysis, Insights and Forecast - by Application
- 7.1.1. Laptop
- 7.1.2. Game Host
- 7.1.3. Others
- 7.2. Market Analysis, Insights and Forecast - by Types
- 7.2.1. MLC
- 7.2.2. TLC
- 7.2.3. QLC
- 7.1. Market Analysis, Insights and Forecast - by Application
- 8. South America Solid State Drive for Client Analysis, Insights and Forecast, 2020-2032
- 8.1. Market Analysis, Insights and Forecast - by Application
- 8.1.1. Laptop
- 8.1.2. Game Host
- 8.1.3. Others
- 8.2. Market Analysis, Insights and Forecast - by Types
- 8.2.1. MLC
- 8.2.2. TLC
- 8.2.3. QLC
- 8.1. Market Analysis, Insights and Forecast - by Application
- 9. Europe Solid State Drive for Client Analysis, Insights and Forecast, 2020-2032
- 9.1. Market Analysis, Insights and Forecast - by Application
- 9.1.1. Laptop
- 9.1.2. Game Host
- 9.1.3. Others
- 9.2. Market Analysis, Insights and Forecast - by Types
- 9.2.1. MLC
- 9.2.2. TLC
- 9.2.3. QLC
- 9.1. Market Analysis, Insights and Forecast - by Application
- 10. Middle East & Africa Solid State Drive for Client Analysis, Insights and Forecast, 2020-2032
- 10.1. Market Analysis, Insights and Forecast - by Application
- 10.1.1. Laptop
- 10.1.2. Game Host
- 10.1.3. Others
- 10.2. Market Analysis, Insights and Forecast - by Types
- 10.2.1. MLC
- 10.2.2. TLC
- 10.2.3. QLC
- 10.1. Market Analysis, Insights and Forecast - by Application
- 11. Asia Pacific Solid State Drive for Client Analysis, Insights and Forecast, 2020-2032
- 11.1. Market Analysis, Insights and Forecast - by Application
- 11.1.1. Laptop
- 11.1.2. Game Host
- 11.1.3. Others
- 11.2. Market Analysis, Insights and Forecast - by Types
- 11.2.1. MLC
- 11.2.2. TLC
- 11.2.3. QLC
- 11.1. Market Analysis, Insights and Forecast - by Application
- 12. Competitive Analysis
- 12.1. Company Profiles
- 12.1.1 Samsung
- 12.1.1.1. Company Overview
- 12.1.1.2. Products
- 12.1.1.3. Company Financials
- 12.1.1.4. SWOT Analysis
- 12.1.2 SK Hynix
- 12.1.2.1. Company Overview
- 12.1.2.2. Products
- 12.1.2.3. Company Financials
- 12.1.2.4. SWOT Analysis
- 12.1.3 Kingston
- 12.1.3.1. Company Overview
- 12.1.3.2. Products
- 12.1.3.3. Company Financials
- 12.1.3.4. SWOT Analysis
- 12.1.4 Intel
- 12.1.4.1. Company Overview
- 12.1.4.2. Products
- 12.1.4.3. Company Financials
- 12.1.4.4. SWOT Analysis
- 12.1.5 Western Digital (SanDisk)
- 12.1.5.1. Company Overview
- 12.1.5.2. Products
- 12.1.5.3. Company Financials
- 12.1.5.4. SWOT Analysis
- 12.1.6 Kimtigo
- 12.1.6.1. Company Overview
- 12.1.6.2. Products
- 12.1.6.3. Company Financials
- 12.1.6.4. SWOT Analysis
- 12.1.7 Seagate
- 12.1.7.1. Company Overview
- 12.1.7.2. Products
- 12.1.7.3. Company Financials
- 12.1.7.4. SWOT Analysis
- 12.1.8 Kioxia (Lite-On)
- 12.1.8.1. Company Overview
- 12.1.8.2. Products
- 12.1.8.3. Company Financials
- 12.1.8.4. SWOT Analysis
- 12.1.9 Netac Technology
- 12.1.9.1. Company Overview
- 12.1.9.2. Products
- 12.1.9.3. Company Financials
- 12.1.9.4. SWOT Analysis
- 12.1.10 Micron (Crucial)
- 12.1.10.1. Company Overview
- 12.1.10.2. Products
- 12.1.10.3. Company Financials
- 12.1.10.4. SWOT Analysis
- 12.1.11 Clolorful
- 12.1.11.1. Company Overview
- 12.1.11.2. Products
- 12.1.11.3. Company Financials
- 12.1.11.4. SWOT Analysis
- 12.1.12 Powev
- 12.1.12.1. Company Overview
- 12.1.12.2. Products
- 12.1.12.3. Company Financials
- 12.1.12.4. SWOT Analysis
- 12.1.13 HP
- 12.1.13.1. Company Overview
- 12.1.13.2. Products
- 12.1.13.3. Company Financials
- 12.1.13.4. SWOT Analysis
- 12.1.14 Transcend
- 12.1.14.1. Company Overview
- 12.1.14.2. Products
- 12.1.14.3. Company Financials
- 12.1.14.4. SWOT Analysis
- 12.1.15 GIGABYTE
- 12.1.15.1. Company Overview
- 12.1.15.2. Products
- 12.1.15.3. Company Financials
- 12.1.15.4. SWOT Analysis
- 12.1.16 Teclast
- 12.1.16.1. Company Overview
- 12.1.16.2. Products
- 12.1.16.3. Company Financials
- 12.1.16.4. SWOT Analysis
- 12.1.17 Lenovo
- 12.1.17.1. Company Overview
- 12.1.17.2. Products
- 12.1.17.3. Company Financials
- 12.1.17.4. SWOT Analysis
- 12.1.18 ADATA Technology
- 12.1.18.1. Company Overview
- 12.1.18.2. Products
- 12.1.18.3. Company Financials
- 12.1.18.4. SWOT Analysis
- 12.1.19 Shenzhen Longsys (Lexar)
- 12.1.19.1. Company Overview
- 12.1.19.2. Products
- 12.1.19.3. Company Financials
- 12.1.19.4. SWOT Analysis
- 12.1.1 Samsung
- 12.2. Market Entropy
- 12.2.1 Company's Key Areas Served
- 12.2.2 Recent Developments
- 12.3. Company Market Share Analysis 2025
- 12.3.1 Top 5 Companies Market Share Analysis
- 12.3.2 Top 3 Companies Market Share Analysis
- 12.4. List of Potential Customers
- 13. Research Methodology
List of Figures
- Figure 1: Global Solid State Drive for Client Revenue Breakdown (undefined, %) by Region 2025 & 2033
- Figure 2: Global Solid State Drive for Client Volume Breakdown (K, %) by Region 2025 & 2033
- Figure 3: North America Solid State Drive for Client Revenue (undefined), by Application 2025 & 2033
- Figure 4: North America Solid State Drive for Client Volume (K), by Application 2025 & 2033
- Figure 5: North America Solid State Drive for Client Revenue Share (%), by Application 2025 & 2033
- Figure 6: North America Solid State Drive for Client Volume Share (%), by Application 2025 & 2033
- Figure 7: North America Solid State Drive for Client Revenue (undefined), by Types 2025 & 2033
- Figure 8: North America Solid State Drive for Client Volume (K), by Types 2025 & 2033
- Figure 9: North America Solid State Drive for Client Revenue Share (%), by Types 2025 & 2033
- Figure 10: North America Solid State Drive for Client Volume Share (%), by Types 2025 & 2033
- Figure 11: North America Solid State Drive for Client Revenue (undefined), by Country 2025 & 2033
- Figure 12: North America Solid State Drive for Client Volume (K), by Country 2025 & 2033
- Figure 13: North America Solid State Drive for Client Revenue Share (%), by Country 2025 & 2033
- Figure 14: North America Solid State Drive for Client Volume Share (%), by Country 2025 & 2033
- Figure 15: South America Solid State Drive for Client Revenue (undefined), by Application 2025 & 2033
- Figure 16: South America Solid State Drive for Client Volume (K), by Application 2025 & 2033
- Figure 17: South America Solid State Drive for Client Revenue Share (%), by Application 2025 & 2033
- Figure 18: South America Solid State Drive for Client Volume Share (%), by Application 2025 & 2033
- Figure 19: South America Solid State Drive for Client Revenue (undefined), by Types 2025 & 2033
- Figure 20: South America Solid State Drive for Client Volume (K), by Types 2025 & 2033
- Figure 21: South America Solid State Drive for Client Revenue Share (%), by Types 2025 & 2033
- Figure 22: South America Solid State Drive for Client Volume Share (%), by Types 2025 & 2033
- Figure 23: South America Solid State Drive for Client Revenue (undefined), by Country 2025 & 2033
- Figure 24: South America Solid State Drive for Client Volume (K), by Country 2025 & 2033
- Figure 25: South America Solid State Drive for Client Revenue Share (%), by Country 2025 & 2033
- Figure 26: South America Solid State Drive for Client Volume Share (%), by Country 2025 & 2033
- Figure 27: Europe Solid State Drive for Client Revenue (undefined), by Application 2025 & 2033
- Figure 28: Europe Solid State Drive for Client Volume (K), by Application 2025 & 2033
- Figure 29: Europe Solid State Drive for Client Revenue Share (%), by Application 2025 & 2033
- Figure 30: Europe Solid State Drive for Client Volume Share (%), by Application 2025 & 2033
- Figure 31: Europe Solid State Drive for Client Revenue (undefined), by Types 2025 & 2033
- Figure 32: Europe Solid State Drive for Client Volume (K), by Types 2025 & 2033
- Figure 33: Europe Solid State Drive for Client Revenue Share (%), by Types 2025 & 2033
- Figure 34: Europe Solid State Drive for Client Volume Share (%), by Types 2025 & 2033
- Figure 35: Europe Solid State Drive for Client Revenue (undefined), by Country 2025 & 2033
- Figure 36: Europe Solid State Drive for Client Volume (K), by Country 2025 & 2033
- Figure 37: Europe Solid State Drive for Client Revenue Share (%), by Country 2025 & 2033
- Figure 38: Europe Solid State Drive for Client Volume Share (%), by Country 2025 & 2033
- Figure 39: Middle East & Africa Solid State Drive for Client Revenue (undefined), by Application 2025 & 2033
- Figure 40: Middle East & Africa Solid State Drive for Client Volume (K), by Application 2025 & 2033
- Figure 41: Middle East & Africa Solid State Drive for Client Revenue Share (%), by Application 2025 & 2033
- Figure 42: Middle East & Africa Solid State Drive for Client Volume Share (%), by Application 2025 & 2033
- Figure 43: Middle East & Africa Solid State Drive for Client Revenue (undefined), by Types 2025 & 2033
- Figure 44: Middle East & Africa Solid State Drive for Client Volume (K), by Types 2025 & 2033
- Figure 45: Middle East & Africa Solid State Drive for Client Revenue Share (%), by Types 2025 & 2033
- Figure 46: Middle East & Africa Solid State Drive for Client Volume Share (%), by Types 2025 & 2033
- Figure 47: Middle East & Africa Solid State Drive for Client Revenue (undefined), by Country 2025 & 2033
- Figure 48: Middle East & Africa Solid State Drive for Client Volume (K), by Country 2025 & 2033
- Figure 49: Middle East & Africa Solid State Drive for Client Revenue Share (%), by Country 2025 & 2033
- Figure 50: Middle East & Africa Solid State Drive for Client Volume Share (%), by Country 2025 & 2033
- Figure 51: Asia Pacific Solid State Drive for Client Revenue (undefined), by Application 2025 & 2033
- Figure 52: Asia Pacific Solid State Drive for Client Volume (K), by Application 2025 & 2033
- Figure 53: Asia Pacific Solid State Drive for Client Revenue Share (%), by Application 2025 & 2033
- Figure 54: Asia Pacific Solid State Drive for Client Volume Share (%), by Application 2025 & 2033
- Figure 55: Asia Pacific Solid State Drive for Client Revenue (undefined), by Types 2025 & 2033
- Figure 56: Asia Pacific Solid State Drive for Client Volume (K), by Types 2025 & 2033
- Figure 57: Asia Pacific Solid State Drive for Client Revenue Share (%), by Types 2025 & 2033
- Figure 58: Asia Pacific Solid State Drive for Client Volume Share (%), by Types 2025 & 2033
- Figure 59: Asia Pacific Solid State Drive for Client Revenue (undefined), by Country 2025 & 2033
- Figure 60: Asia Pacific Solid State Drive for Client Volume (K), by Country 2025 & 2033
- Figure 61: Asia Pacific Solid State Drive for Client Revenue Share (%), by Country 2025 & 2033
- Figure 62: Asia Pacific Solid State Drive for Client Volume Share (%), by Country 2025 & 2033
List of Tables
- Table 1: Global Solid State Drive for Client Revenue undefined Forecast, by Application 2020 & 2033
- Table 2: Global Solid State Drive for Client Volume K Forecast, by Application 2020 & 2033
- Table 3: Global Solid State Drive for Client Revenue undefined Forecast, by Types 2020 & 2033
- Table 4: Global Solid State Drive for Client Volume K Forecast, by Types 2020 & 2033
- Table 5: Global Solid State Drive for Client Revenue undefined Forecast, by Region 2020 & 2033
- Table 6: Global Solid State Drive for Client Volume K Forecast, by Region 2020 & 2033
- Table 7: Global Solid State Drive for Client Revenue undefined Forecast, by Application 2020 & 2033
- Table 8: Global Solid State Drive for Client Volume K Forecast, by Application 2020 & 2033
- Table 9: Global Solid State Drive for Client Revenue undefined Forecast, by Types 2020 & 2033
- Table 10: Global Solid State Drive for Client Volume K Forecast, by Types 2020 & 2033
- Table 11: Global Solid State Drive for Client Revenue undefined Forecast, by Country 2020 & 2033
- Table 12: Global Solid State Drive for Client Volume K Forecast, by Country 2020 & 2033
- Table 13: United States Solid State Drive for Client Revenue (undefined) Forecast, by Application 2020 & 2033
- Table 14: United States Solid State Drive for Client Volume (K) Forecast, by Application 2020 & 2033
- Table 15: Canada Solid State Drive for Client Revenue (undefined) Forecast, by Application 2020 & 2033
- Table 16: Canada Solid State Drive for Client Volume (K) Forecast, by Application 2020 & 2033
- Table 17: Mexico Solid State Drive for Client Revenue (undefined) Forecast, by Application 2020 & 2033
- Table 18: Mexico Solid State Drive for Client Volume (K) Forecast, by Application 2020 & 2033
- Table 19: Global Solid State Drive for Client Revenue undefined Forecast, by Application 2020 & 2033
- Table 20: Global Solid State Drive for Client Volume K Forecast, by Application 2020 & 2033
- Table 21: Global Solid State Drive for Client Revenue undefined Forecast, by Types 2020 & 2033
- Table 22: Global Solid State Drive for Client Volume K Forecast, by Types 2020 & 2033
- Table 23: Global Solid State Drive for Client Revenue undefined Forecast, by Country 2020 & 2033
- Table 24: Global Solid State Drive for Client Volume K Forecast, by Country 2020 & 2033
- Table 25: Brazil Solid State Drive for Client Revenue (undefined) Forecast, by Application 2020 & 2033
- Table 26: Brazil Solid State Drive for Client Volume (K) Forecast, by Application 2020 & 2033
- Table 27: Argentina Solid State Drive for Client Revenue (undefined) Forecast, by Application 2020 & 2033
- Table 28: Argentina Solid State Drive for Client Volume (K) Forecast, by Application 2020 & 2033
- Table 29: Rest of South America Solid State Drive for Client Revenue (undefined) Forecast, by Application 2020 & 2033
- Table 30: Rest of South America Solid State Drive for Client Volume (K) Forecast, by Application 2020 & 2033
- Table 31: Global Solid State Drive for Client Revenue undefined Forecast, by Application 2020 & 2033
- Table 32: Global Solid State Drive for Client Volume K Forecast, by Application 2020 & 2033
- Table 33: Global Solid State Drive for Client Revenue undefined Forecast, by Types 2020 & 2033
- Table 34: Global Solid State Drive for Client Volume K Forecast, by Types 2020 & 2033
- Table 35: Global Solid State Drive for Client Revenue undefined Forecast, by Country 2020 & 2033
- Table 36: Global Solid State Drive for Client Volume K Forecast, by Country 2020 & 2033
- Table 37: United Kingdom Solid State Drive for Client Revenue (undefined) Forecast, by Application 2020 & 2033
- Table 38: United Kingdom Solid State Drive for Client Volume (K) Forecast, by Application 2020 & 2033
- Table 39: Germany Solid State Drive for Client Revenue (undefined) Forecast, by Application 2020 & 2033
- Table 40: Germany Solid State Drive for Client Volume (K) Forecast, by Application 2020 & 2033
- Table 41: France Solid State Drive for Client Revenue (undefined) Forecast, by Application 2020 & 2033
- Table 42: France Solid State Drive for Client Volume (K) Forecast, by Application 2020 & 2033
- Table 43: Italy Solid State Drive for Client Revenue (undefined) Forecast, by Application 2020 & 2033
- Table 44: Italy Solid State Drive for Client Volume (K) Forecast, by Application 2020 & 2033
- Table 45: Spain Solid State Drive for Client Revenue (undefined) Forecast, by Application 2020 & 2033
- Table 46: Spain Solid State Drive for Client Volume (K) Forecast, by Application 2020 & 2033
- Table 47: Russia Solid State Drive for Client Revenue (undefined) Forecast, by Application 2020 & 2033
- Table 48: Russia Solid State Drive for Client Volume (K) Forecast, by Application 2020 & 2033
- Table 49: Benelux Solid State Drive for Client Revenue (undefined) Forecast, by Application 2020 & 2033
- Table 50: Benelux Solid State Drive for Client Volume (K) Forecast, by Application 2020 & 2033
- Table 51: Nordics Solid State Drive for Client Revenue (undefined) Forecast, by Application 2020 & 2033
- Table 52: Nordics Solid State Drive for Client Volume (K) Forecast, by Application 2020 & 2033
- Table 53: Rest of Europe Solid State Drive for Client Revenue (undefined) Forecast, by Application 2020 & 2033
- Table 54: Rest of Europe Solid State Drive for Client Volume (K) Forecast, by Application 2020 & 2033
- Table 55: Global Solid State Drive for Client Revenue undefined Forecast, by Application 2020 & 2033
- Table 56: Global Solid State Drive for Client Volume K Forecast, by Application 2020 & 2033
- Table 57: Global Solid State Drive for Client Revenue undefined Forecast, by Types 2020 & 2033
- Table 58: Global Solid State Drive for Client Volume K Forecast, by Types 2020 & 2033
- Table 59: Global Solid State Drive for Client Revenue undefined Forecast, by Country 2020 & 2033
- Table 60: Global Solid State Drive for Client Volume K Forecast, by Country 2020 & 2033
- Table 61: Turkey Solid State Drive for Client Revenue (undefined) Forecast, by Application 2020 & 2033
- Table 62: Turkey Solid State Drive for Client Volume (K) Forecast, by Application 2020 & 2033
- Table 63: Israel Solid State Drive for Client Revenue (undefined) Forecast, by Application 2020 & 2033
- Table 64: Israel Solid State Drive for Client Volume (K) Forecast, by Application 2020 & 2033
- Table 65: GCC Solid State Drive for Client Revenue (undefined) Forecast, by Application 2020 & 2033
- Table 66: GCC Solid State Drive for Client Volume (K) Forecast, by Application 2020 & 2033
- Table 67: North Africa Solid State Drive for Client Revenue (undefined) Forecast, by Application 2020 & 2033
- Table 68: North Africa Solid State Drive for Client Volume (K) Forecast, by Application 2020 & 2033
- Table 69: South Africa Solid State Drive for Client Revenue (undefined) Forecast, by Application 2020 & 2033
- Table 70: South Africa Solid State Drive for Client Volume (K) Forecast, by Application 2020 & 2033
- Table 71: Rest of Middle East & Africa Solid State Drive for Client Revenue (undefined) Forecast, by Application 2020 & 2033
- Table 72: Rest of Middle East & Africa Solid State Drive for Client Volume (K) Forecast, by Application 2020 & 2033
- Table 73: Global Solid State Drive for Client Revenue undefined Forecast, by Application 2020 & 2033
- Table 74: Global Solid State Drive for Client Volume K Forecast, by Application 2020 & 2033
- Table 75: Global Solid State Drive for Client Revenue undefined Forecast, by Types 2020 & 2033
- Table 76: Global Solid State Drive for Client Volume K Forecast, by Types 2020 & 2033
- Table 77: Global Solid State Drive for Client Revenue undefined Forecast, by Country 2020 & 2033
- Table 78: Global Solid State Drive for Client Volume K Forecast, by Country 2020 & 2033
- Table 79: China Solid State Drive for Client Revenue (undefined) Forecast, by Application 2020 & 2033
- Table 80: China Solid State Drive for Client Volume (K) Forecast, by Application 2020 & 2033
- Table 81: India Solid State Drive for Client Revenue (undefined) Forecast, by Application 2020 & 2033
- Table 82: India Solid State Drive for Client Volume (K) Forecast, by Application 2020 & 2033
- Table 83: Japan Solid State Drive for Client Revenue (undefined) Forecast, by Application 2020 & 2033
- Table 84: Japan Solid State Drive for Client Volume (K) Forecast, by Application 2020 & 2033
- Table 85: South Korea Solid State Drive for Client Revenue (undefined) Forecast, by Application 2020 & 2033
- Table 86: South Korea Solid State Drive for Client Volume (K) Forecast, by Application 2020 & 2033
- Table 87: ASEAN Solid State Drive for Client Revenue (undefined) Forecast, by Application 2020 & 2033
- Table 88: ASEAN Solid State Drive for Client Volume (K) Forecast, by Application 2020 & 2033
- Table 89: Oceania Solid State Drive for Client Revenue (undefined) Forecast, by Application 2020 & 2033
- Table 90: Oceania Solid State Drive for Client Volume (K) Forecast, by Application 2020 & 2033
- Table 91: Rest of Asia Pacific Solid State Drive for Client Revenue (undefined) Forecast, by Application 2020 & 2033
- Table 92: Rest of Asia Pacific Solid State Drive for Client Volume (K) Forecast, by Application 2020 & 2033
Frequently Asked Questions
1. What is the projected Compound Annual Growth Rate (CAGR) of the Solid State Drive for Client?
The projected CAGR is approximately 15.37%.
2. Which companies are prominent players in the Solid State Drive for Client?
Key companies in the market include Samsung, SK Hynix, Kingston, Intel, Western Digital (SanDisk), Kimtigo, Seagate, Kioxia (Lite-On), Netac Technology, Micron (Crucial), Clolorful, Powev, HP, Transcend, GIGABYTE, Teclast, Lenovo, ADATA Technology, Shenzhen Longsys (Lexar).
3. What are the main segments of the Solid State Drive for Client?
The market segments include Application, Types.
4. Can you provide details about the market size?
The market size is estimated to be USD XXX N/A as of 2022.
5. What are some drivers contributing to market growth?
N/A
6. What are the notable trends driving market growth?
N/A
7. Are there any restraints impacting market growth?
N/A
8. Can you provide examples of recent developments in the market?
N/A
9. What pricing options are available for accessing the report?
Pricing options include single-user, multi-user, and enterprise licenses priced at USD 3950.00, USD 5925.00, and USD 7900.00 respectively.
10. Is the market size provided in terms of value or volume?
The market size is provided in terms of value, measured in N/A and volume, measured in K.
11. Are there any specific market keywords associated with the report?
Yes, the market keyword associated with the report is "Solid State Drive for Client," which aids in identifying and referencing the specific market segment covered.
12. How do I determine which pricing option suits my needs best?
The pricing options vary based on user requirements and access needs. Individual users may opt for single-user licenses, while businesses requiring broader access may choose multi-user or enterprise licenses for cost-effective access to the report.
13. Are there any additional resources or data provided in the Solid State Drive for Client report?
While the report offers comprehensive insights, it's advisable to review the specific contents or supplementary materials provided to ascertain if additional resources or data are available.
14. How can I stay updated on further developments or reports in the Solid State Drive for Client?
To stay informed about further developments, trends, and reports in the Solid State Drive for Client, consider subscribing to industry newsletters, following relevant companies and organizations, or regularly checking reputable industry news sources and publications.
Methodology
Step 1 - Identification of Relevant Samples Size from Population Database


Step 2 - Approaches for Defining Global Market Size (Value, Volume* & Price*)

Note*: In applicable scenarios
Step 3 - Data Sources
Primary Research
- Web Analytics
- Survey Reports
- Research Institute
- Latest Research Reports
- Opinion Leaders
Secondary Research
- Annual Reports
- White Paper
- Latest Press Release
- Industry Association
- Paid Database
- Investor Presentations

Step 4 - Data Triangulation
Involves using different sources of information in order to increase the validity of a study
These sources are likely to be stakeholders in a program - participants, other researchers, program staff, other community members, and so on.
Then we put all data in single framework & apply various statistical tools to find out the dynamic on the market.
During the analysis stage, feedback from the stakeholder groups would be compared to determine areas of agreement as well as areas of divergence