

Key Insights
The global Specialty PACS market, including cardiovascular, orthopedic, and oncology solutions, is poised for substantial expansion. Driven by the escalating adoption of digital imaging, the increasing incidence of chronic diseases demanding advanced image analysis, and the growing need for streamlined image management and interdisciplinary collaboration among healthcare professionals, this sector is experiencing robust growth. The market is projected to expand at a Compound Annual Growth Rate (CAGR) of 8.5%, reaching a market size of 5.31 billion by 2025 (base year: 2025). Key growth drivers include the migration from on-premise to scalable, accessible, and cost-effective web/cloud-based solutions. Hospitals and diagnostic centers represent the primary end-user segments, emphasizing the critical role of PACS in optimizing workflows and enhancing diagnostic precision. While software currently dominates, the services segment is expected to see significant growth, fueled by the demand for specialized training, support, and maintenance. Technological innovations, such as AI-powered image analysis and enhanced interoperability, are further accelerating market development.
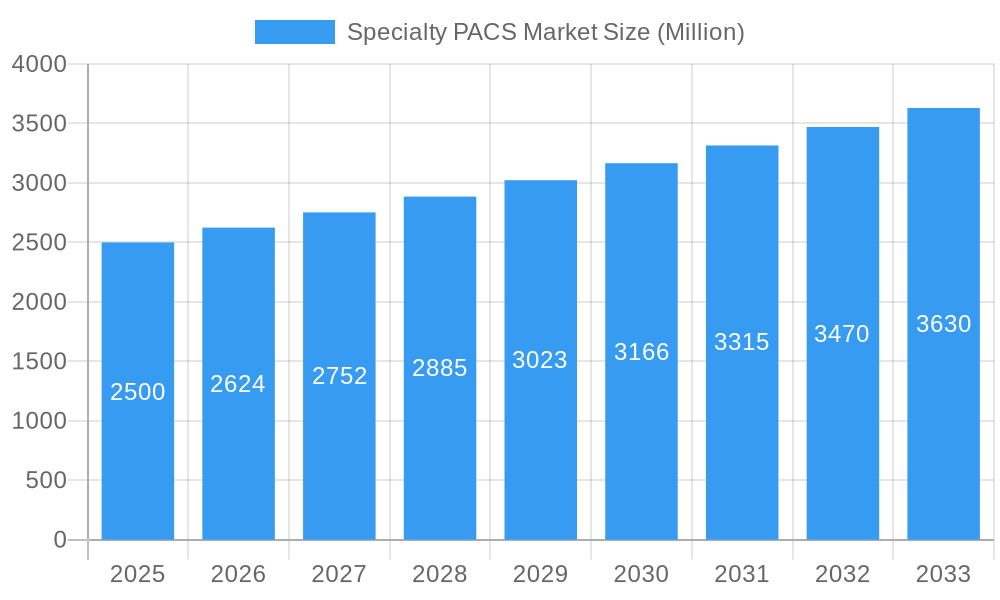
Specialty PACS Market Market Size (In Billion)
Despite the positive outlook, certain challenges persist. The considerable initial investment required for Specialty PACS implementation can be a barrier, particularly for smaller healthcare organizations. Moreover, stringent data security and privacy regulations governing sensitive patient information necessitate robust solutions. The competitive arena features established industry leaders and agile, niche providers, fostering intense competition and a drive for continuous innovation and differentiated service offerings. Emerging economies, especially within the Asia-Pacific region, present significant growth opportunities due to rapid healthcare infrastructure development. Strategic alliances, mergers, and acquisitions are anticipated to significantly influence the market's future trajectory. This comprehensive analysis offers a detailed understanding of the Specialty PACS market's current dynamics and future prospects.
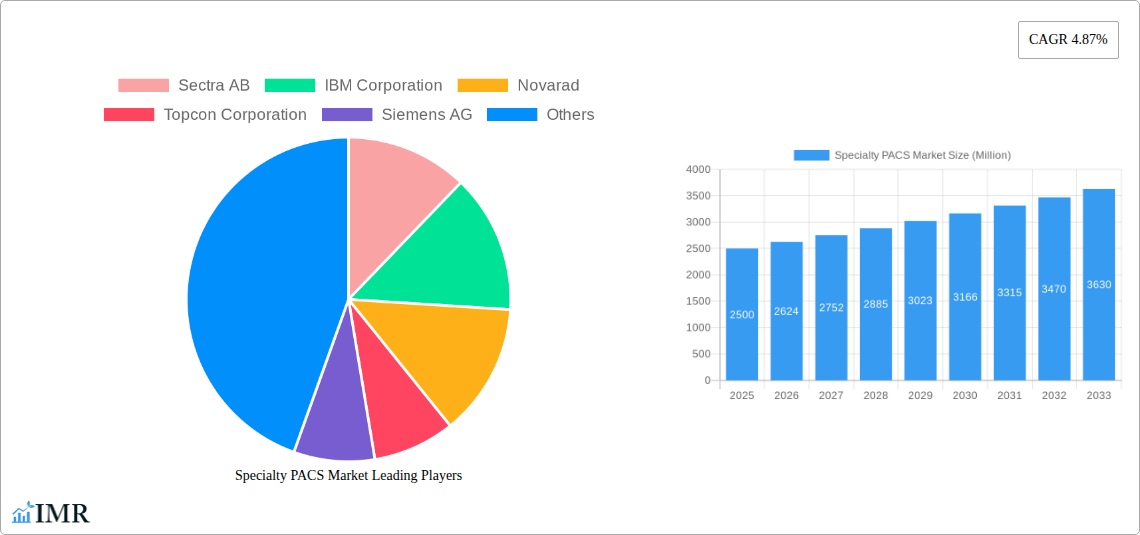
Specialty PACS Market Company Market Share
Specialty PACS Market: A Comprehensive Market Report (2019-2033)
This in-depth report provides a comprehensive analysis of the Specialty PACS market, encompassing market dynamics, growth trends, regional dominance, product landscape, key players, and future outlook. The report covers the period from 2019 to 2033, with a focus on the 2025-2033 forecast period. The parent market is the broader PACS market, while child markets include Cardiovascular, Orthopedic, and Oncology PACS. The total market value in 2025 is estimated at xx Million.
Specialty PACS Market Dynamics & Structure
The Specialty PACS market is characterized by a moderately concentrated landscape, with key players such as Sectra AB, IBM Corporation, Novarad, Topcon Corporation, Siemens AG, Philips Healthcare, Canon USA Inc, Agfa Healthcare, McKesson Corporation, and Fujifilm Holdings Corporation (Fujifilm Medical Systems) holding significant market share. Technological innovation, particularly in cloud-based solutions and AI integration, is a major driver. Stringent regulatory frameworks regarding data privacy and security influence market operations. Competitive substitutes include other medical imaging software and storage solutions. End-user demographics are shifting towards greater adoption in developing economies. M&A activity in the sector has been moderate, with xx deals recorded in the historical period (2019-2024), resulting in a slight increase in market concentration.
- Market Concentration: Moderately concentrated, with top 10 players holding approximately xx% of market share in 2024.
- Technological Innovation: AI-powered image analysis, cloud-based solutions, and improved interoperability are key drivers.
- Regulatory Landscape: HIPAA, GDPR, and other regulations influence vendor strategies and market access.
- Competitive Substitutes: Other medical imaging software and storage platforms pose competitive pressure.
- M&A Activity: xx deals recorded between 2019-2024, contributing to market consolidation.
- Innovation Barriers: High initial investment costs, integration complexities, and regulatory compliance requirements pose challenges to innovation.
Specialty PACS Market Growth Trends & Insights
The Specialty PACS market experienced a CAGR of xx% during the historical period (2019-2024), driven by increasing demand for specialized imaging solutions across various medical specialties. Adoption rates are accelerating due to improved workflow efficiency, enhanced diagnostic accuracy, and the growing preference for web/cloud-based solutions. Technological disruptions, such as the integration of AI and machine learning, are further fueling market expansion. Consumer behavior is shifting towards vendor-neutral platforms and the demand for seamless data integration across the healthcare ecosystem. The market is projected to reach xx Million by 2025 and maintain a CAGR of xx% from 2025 to 2033. Market penetration in key regions like North America and Europe is high, with significant growth opportunities in developing markets.
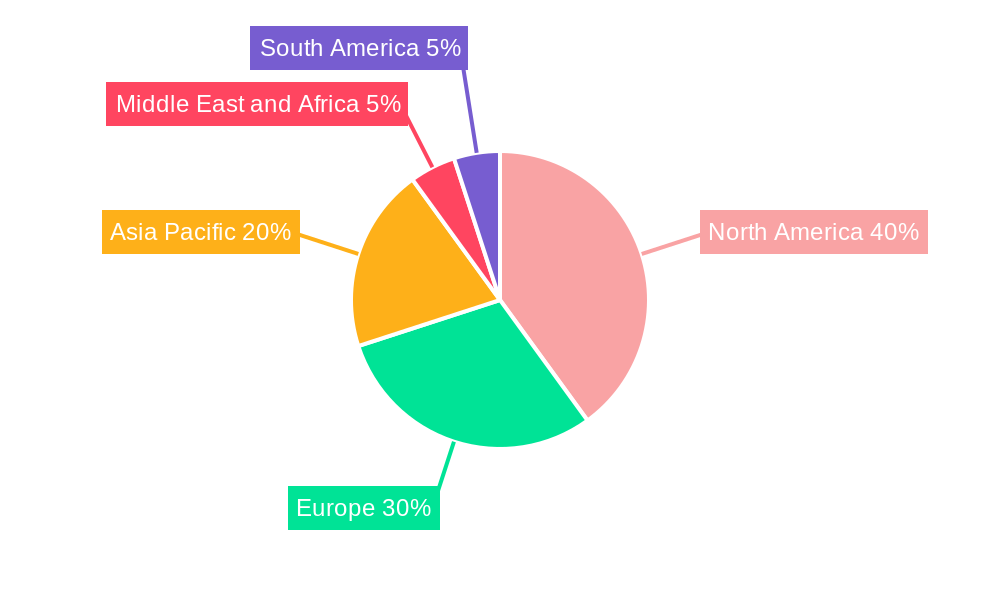
Dominant Regions, Countries, or Segments in Specialty PACS Market
North America currently dominates the Specialty PACS market, accounting for approximately xx% of the global revenue in 2024. This dominance is attributed to high healthcare expenditure, advanced medical infrastructure, and early adoption of advanced technologies. Europe holds the second-largest share, driven by government initiatives promoting digital healthcare. Within the segment breakdown:
Type: Cardiovascular PACS holds the largest market share due to the high volume of cardiac imaging procedures.
Component: Software is the dominant component due to the increasing demand for advanced analytics and workflow optimization features.
Development: Web/Cloud-based Specialty PACS is gaining significant traction due to enhanced scalability, accessibility, and cost-effectiveness.
End-User: Hospitals are the primary end-users, driven by the need for efficient management of large imaging datasets.
Key Drivers in North America: High healthcare spending, advanced medical infrastructure, early adoption of new technologies.
Key Drivers in Europe: Government initiatives promoting digital healthcare, robust healthcare IT infrastructure.
Growth Potential: Emerging markets in Asia-Pacific and Latin America present significant growth opportunities.
Specialty PACS Market Product Landscape
Specialty PACS solutions are constantly evolving to incorporate advanced features such as AI-powered image analysis, improved interoperability with other medical devices, and enhanced security measures. Key innovations include advanced visualization tools, automated reporting capabilities, and integration with electronic health records (EHR) systems. These advancements enhance diagnostic accuracy, streamline workflows, and improve overall patient care. Unique selling propositions include specialized functionalities tailored to specific medical specialties, such as cardiovascular, orthopedic, or oncology imaging, and seamless integration with hospital information systems.
Key Drivers, Barriers & Challenges in Specialty PACS Market
Key Drivers: The rising prevalence of chronic diseases, the growing demand for improved diagnostic accuracy, technological advancements in imaging and data analysis, and government initiatives promoting digital healthcare are key drivers.
Challenges: High initial investment costs, the complexity of integration with existing healthcare IT infrastructure, concerns regarding data security and privacy, and the emergence of competitive substitutes represent significant challenges. These hurdles hinder market penetration, particularly in resource-constrained settings.
Emerging Opportunities in Specialty PACS Market
Emerging opportunities lie in the integration of AI and machine learning for enhanced diagnostic accuracy and workflow automation, the expansion into untapped markets in developing countries, and the development of specialized PACS solutions tailored to niche medical areas. The increasing adoption of cloud-based solutions and the growing emphasis on interoperability offer substantial growth potential.
Growth Accelerators in the Specialty PACS Market Industry
Technological advancements, such as AI-driven image analysis and cloud-based solutions, are key growth accelerators. Strategic partnerships between PACS vendors and healthcare providers are streamlining implementation and fostering wider adoption. Expanding into emerging markets and developing specialized PACS solutions for niche medical areas also contribute to growth.
Key Players Shaping the Specialty PACS Market Market
Notable Milestones in Specialty PACS Market Sector
- April 2022: FUJIFILM Healthcare Americas Corporation installed Fujifilm's Synapse Cardiology PACS version 7 throughout Emory Healthcare facilities, enhancing cardiac imaging capabilities.
- March 2022: Intelerad Medical Systems launched its new Enterprise Imaging and Informatics Suite, promoting data integration across the healthcare ecosystem.
In-Depth Specialty PACS Market Market Outlook
The Specialty PACS market is poised for significant growth driven by technological advancements, expanding applications, and increasing adoption in emerging markets. Strategic partnerships, robust product innovation, and a focus on interoperability will be critical for success. The market's long-term potential is substantial, offering attractive opportunities for both established players and new entrants.
Specialty PACS Market Segmentation
-
1. Type
- 1.1. Cardiovascular PACS
- 1.2. Orthopedic PACS
- 1.3. Oncology PACS
- 1.4. Other Types
-
2. Component
- 2.1. Software
- 2.2. Services
- 2.3. Hardware
-
3. Development
- 3.1. On-premise Specialty PACS
- 3.2. Web/Cloud-based Specialty PACS
-
4. End User
- 4.1. Hospitals
- 4.2. Diagnostic Centers
- 4.3. Other End Users
Specialty PACS Market Segmentation By Geography
-
1. North America
- 1.1. United States
- 1.2. Canada
- 1.3. Mexico
-
2. Europe
- 2.1. Germany
- 2.2. United Kingdom
- 2.3. France
- 2.4. Italy
- 2.5. Spain
- 2.6. Rest of Europe
-
3. Asia Pacific
- 3.1. China
- 3.2. Japan
- 3.3. India
- 3.4. Australia
- 3.5. South Korea
- 3.6. Rest of Asia Pacific
-
4. Middle East and Africa
- 4.1. GCC
- 4.2. South Africa
- 4.3. Rest of Middle East and Africa
-
5. South America
- 5.1. Brazil
- 5.2. Argentina
- 5.3. Rest of South America
Specialty PACS Market Regional Market Share
Geographic Coverage of Specialty PACS Market
Specialty PACS Market REPORT HIGHLIGHTS
| Aspects | Details |
|---|---|
| Study Period | 2020-2034 |
| Base Year | 2025 |
| Estimated Year | 2026 |
| Forecast Period | 2026-2034 |
| Historical Period | 2020-2025 |
| Growth Rate | CAGR of 8.5% from 2020-2034 |
| Segmentation |
|
Table of Contents
- 1. Introduction
- 1.1. Research Scope
- 1.2. Market Segmentation
- 1.3. Research Objective
- 1.4. Definitions and Assumptions
- 2. Executive Summary
- 2.1. Market Snapshot
- 3. Market Dynamics
- 3.1. Market Drivers
- 3.2. Market Restrains
- 3.3. Market Trends
- 3.4. Market Opportunities
- 4. Market Factor Analysis
- 4.1. Porters Five Forces
- 4.1.1. Bargaining Power of Suppliers
- 4.1.2. Bargaining Power of Buyers
- 4.1.3. Threat of New Entrants
- 4.1.4. Threat of Substitutes
- 4.1.5. Competitive Rivalry
- 4.2. PESTEL analysis
- 4.3. BCG Analysis
- 4.3.1. Stars (High Growth, High Market Share)
- 4.3.2. Cash Cows (Low Growth, High Market Share)
- 4.3.3. Question Mark (High Growth, Low Market Share)
- 4.3.4. Dogs (Low Growth, Low Market Share)
- 4.4. Ansoff Matrix Analysis
- 4.5. Supply Chain Analysis
- 4.6. Regulatory Landscape
- 4.7. Current Market Potential and Opportunity Assessment (TAM–SAM–SOM Framework)
- 4.8. IMR Analyst Note
- 4.1. Porters Five Forces
- 5. Market Analysis, Insights and Forecast 2021-2033
- 5.1. Market Analysis, Insights and Forecast - by Type
- 5.1.1. Cardiovascular PACS
- 5.1.2. Orthopedic PACS
- 5.1.3. Oncology PACS
- 5.1.4. Other Types
- 5.2. Market Analysis, Insights and Forecast - by Component
- 5.2.1. Software
- 5.2.2. Services
- 5.2.3. Hardware
- 5.3. Market Analysis, Insights and Forecast - by Development
- 5.3.1. On-premise Specialty PACS
- 5.3.2. Web/Cloud-based Specialty PACS
- 5.4. Market Analysis, Insights and Forecast - by End User
- 5.4.1. Hospitals
- 5.4.2. Diagnostic Centers
- 5.4.3. Other End Users
- 5.5. Market Analysis, Insights and Forecast - by Region
- 5.5.1. North America
- 5.5.2. Europe
- 5.5.3. Asia Pacific
- 5.5.4. Middle East and Africa
- 5.5.5. South America
- 5.1. Market Analysis, Insights and Forecast - by Type
- 6. Global Specialty PACS Market Analysis, Insights and Forecast, 2021-2033
- 6.1. Market Analysis, Insights and Forecast - by Type
- 6.1.1. Cardiovascular PACS
- 6.1.2. Orthopedic PACS
- 6.1.3. Oncology PACS
- 6.1.4. Other Types
- 6.2. Market Analysis, Insights and Forecast - by Component
- 6.2.1. Software
- 6.2.2. Services
- 6.2.3. Hardware
- 6.3. Market Analysis, Insights and Forecast - by Development
- 6.3.1. On-premise Specialty PACS
- 6.3.2. Web/Cloud-based Specialty PACS
- 6.4. Market Analysis, Insights and Forecast - by End User
- 6.4.1. Hospitals
- 6.4.2. Diagnostic Centers
- 6.4.3. Other End Users
- 6.1. Market Analysis, Insights and Forecast - by Type
- 7. North America Specialty PACS Market Analysis, Insights and Forecast, 2020-2032
- 7.1. Market Analysis, Insights and Forecast - by Type
- 7.1.1. Cardiovascular PACS
- 7.1.2. Orthopedic PACS
- 7.1.3. Oncology PACS
- 7.1.4. Other Types
- 7.2. Market Analysis, Insights and Forecast - by Component
- 7.2.1. Software
- 7.2.2. Services
- 7.2.3. Hardware
- 7.3. Market Analysis, Insights and Forecast - by Development
- 7.3.1. On-premise Specialty PACS
- 7.3.2. Web/Cloud-based Specialty PACS
- 7.4. Market Analysis, Insights and Forecast - by End User
- 7.4.1. Hospitals
- 7.4.2. Diagnostic Centers
- 7.4.3. Other End Users
- 7.1. Market Analysis, Insights and Forecast - by Type
- 8. Europe Specialty PACS Market Analysis, Insights and Forecast, 2020-2032
- 8.1. Market Analysis, Insights and Forecast - by Type
- 8.1.1. Cardiovascular PACS
- 8.1.2. Orthopedic PACS
- 8.1.3. Oncology PACS
- 8.1.4. Other Types
- 8.2. Market Analysis, Insights and Forecast - by Component
- 8.2.1. Software
- 8.2.2. Services
- 8.2.3. Hardware
- 8.3. Market Analysis, Insights and Forecast - by Development
- 8.3.1. On-premise Specialty PACS
- 8.3.2. Web/Cloud-based Specialty PACS
- 8.4. Market Analysis, Insights and Forecast - by End User
- 8.4.1. Hospitals
- 8.4.2. Diagnostic Centers
- 8.4.3. Other End Users
- 8.1. Market Analysis, Insights and Forecast - by Type
- 9. Asia Pacific Specialty PACS Market Analysis, Insights and Forecast, 2020-2032
- 9.1. Market Analysis, Insights and Forecast - by Type
- 9.1.1. Cardiovascular PACS
- 9.1.2. Orthopedic PACS
- 9.1.3. Oncology PACS
- 9.1.4. Other Types
- 9.2. Market Analysis, Insights and Forecast - by Component
- 9.2.1. Software
- 9.2.2. Services
- 9.2.3. Hardware
- 9.3. Market Analysis, Insights and Forecast - by Development
- 9.3.1. On-premise Specialty PACS
- 9.3.2. Web/Cloud-based Specialty PACS
- 9.4. Market Analysis, Insights and Forecast - by End User
- 9.4.1. Hospitals
- 9.4.2. Diagnostic Centers
- 9.4.3. Other End Users
- 9.1. Market Analysis, Insights and Forecast - by Type
- 10. Middle East and Africa Specialty PACS Market Analysis, Insights and Forecast, 2020-2032
- 10.1. Market Analysis, Insights and Forecast - by Type
- 10.1.1. Cardiovascular PACS
- 10.1.2. Orthopedic PACS
- 10.1.3. Oncology PACS
- 10.1.4. Other Types
- 10.2. Market Analysis, Insights and Forecast - by Component
- 10.2.1. Software
- 10.2.2. Services
- 10.2.3. Hardware
- 10.3. Market Analysis, Insights and Forecast - by Development
- 10.3.1. On-premise Specialty PACS
- 10.3.2. Web/Cloud-based Specialty PACS
- 10.4. Market Analysis, Insights and Forecast - by End User
- 10.4.1. Hospitals
- 10.4.2. Diagnostic Centers
- 10.4.3. Other End Users
- 10.1. Market Analysis, Insights and Forecast - by Type
- 11. South America Specialty PACS Market Analysis, Insights and Forecast, 2020-2032
- 11.1. Market Analysis, Insights and Forecast - by Type
- 11.1.1. Cardiovascular PACS
- 11.1.2. Orthopedic PACS
- 11.1.3. Oncology PACS
- 11.1.4. Other Types
- 11.2. Market Analysis, Insights and Forecast - by Component
- 11.2.1. Software
- 11.2.2. Services
- 11.2.3. Hardware
- 11.3. Market Analysis, Insights and Forecast - by Development
- 11.3.1. On-premise Specialty PACS
- 11.3.2. Web/Cloud-based Specialty PACS
- 11.4. Market Analysis, Insights and Forecast - by End User
- 11.4.1. Hospitals
- 11.4.2. Diagnostic Centers
- 11.4.3. Other End Users
- 11.1. Market Analysis, Insights and Forecast - by Type
- 12. Competitive Analysis
- 12.1. Company Profiles
- 12.1.1 Sectra AB
- 12.1.1.1. Company Overview
- 12.1.1.2. Products
- 12.1.1.3. Company Financials
- 12.1.1.4. SWOT Analysis
- 12.1.2 IBM Corporation
- 12.1.2.1. Company Overview
- 12.1.2.2. Products
- 12.1.2.3. Company Financials
- 12.1.2.4. SWOT Analysis
- 12.1.3 Novarad
- 12.1.3.1. Company Overview
- 12.1.3.2. Products
- 12.1.3.3. Company Financials
- 12.1.3.4. SWOT Analysis
- 12.1.4 Topcon Corporation
- 12.1.4.1. Company Overview
- 12.1.4.2. Products
- 12.1.4.3. Company Financials
- 12.1.4.4. SWOT Analysis
- 12.1.5 Siemens AG
- 12.1.5.1. Company Overview
- 12.1.5.2. Products
- 12.1.5.3. Company Financials
- 12.1.5.4. SWOT Analysis
- 12.1.6 Philips Healthcare
- 12.1.6.1. Company Overview
- 12.1.6.2. Products
- 12.1.6.3. Company Financials
- 12.1.6.4. SWOT Analysis
- 12.1.7 Canon USA Inc
- 12.1.7.1. Company Overview
- 12.1.7.2. Products
- 12.1.7.3. Company Financials
- 12.1.7.4. SWOT Analysis
- 12.1.8 Agfa Healthcare
- 12.1.8.1. Company Overview
- 12.1.8.2. Products
- 12.1.8.3. Company Financials
- 12.1.8.4. SWOT Analysis
- 12.1.9 McKesson Corporation
- 12.1.9.1. Company Overview
- 12.1.9.2. Products
- 12.1.9.3. Company Financials
- 12.1.9.4. SWOT Analysis
- 12.1.10 Fujifilm Holdings Corporation (Fujifilm Medical Systems)
- 12.1.10.1. Company Overview
- 12.1.10.2. Products
- 12.1.10.3. Company Financials
- 12.1.10.4. SWOT Analysis
- 12.1.1 Sectra AB
- 12.2. Market Entropy
- 12.2.1 Company's Key Areas Served
- 12.2.2 Recent Developments
- 12.3. Company Market Share Analysis 2025
- 12.3.1 Top 5 Companies Market Share Analysis
- 12.3.2 Top 3 Companies Market Share Analysis
- 12.4. List of Potential Customers
- 13. Research Methodology
List of Figures
- Figure 1: Global Specialty PACS Market Revenue Breakdown (billion, %) by Region 2025 & 2033
- Figure 2: Global Specialty PACS Market Volume Breakdown (K Unit, %) by Region 2025 & 2033
- Figure 3: North America Specialty PACS Market Revenue (billion), by Type 2025 & 2033
- Figure 4: North America Specialty PACS Market Volume (K Unit), by Type 2025 & 2033
- Figure 5: North America Specialty PACS Market Revenue Share (%), by Type 2025 & 2033
- Figure 6: North America Specialty PACS Market Volume Share (%), by Type 2025 & 2033
- Figure 7: North America Specialty PACS Market Revenue (billion), by Component 2025 & 2033
- Figure 8: North America Specialty PACS Market Volume (K Unit), by Component 2025 & 2033
- Figure 9: North America Specialty PACS Market Revenue Share (%), by Component 2025 & 2033
- Figure 10: North America Specialty PACS Market Volume Share (%), by Component 2025 & 2033
- Figure 11: North America Specialty PACS Market Revenue (billion), by Development 2025 & 2033
- Figure 12: North America Specialty PACS Market Volume (K Unit), by Development 2025 & 2033
- Figure 13: North America Specialty PACS Market Revenue Share (%), by Development 2025 & 2033
- Figure 14: North America Specialty PACS Market Volume Share (%), by Development 2025 & 2033
- Figure 15: North America Specialty PACS Market Revenue (billion), by End User 2025 & 2033
- Figure 16: North America Specialty PACS Market Volume (K Unit), by End User 2025 & 2033
- Figure 17: North America Specialty PACS Market Revenue Share (%), by End User 2025 & 2033
- Figure 18: North America Specialty PACS Market Volume Share (%), by End User 2025 & 2033
- Figure 19: North America Specialty PACS Market Revenue (billion), by Country 2025 & 2033
- Figure 20: North America Specialty PACS Market Volume (K Unit), by Country 2025 & 2033
- Figure 21: North America Specialty PACS Market Revenue Share (%), by Country 2025 & 2033
- Figure 22: North America Specialty PACS Market Volume Share (%), by Country 2025 & 2033
- Figure 23: Europe Specialty PACS Market Revenue (billion), by Type 2025 & 2033
- Figure 24: Europe Specialty PACS Market Volume (K Unit), by Type 2025 & 2033
- Figure 25: Europe Specialty PACS Market Revenue Share (%), by Type 2025 & 2033
- Figure 26: Europe Specialty PACS Market Volume Share (%), by Type 2025 & 2033
- Figure 27: Europe Specialty PACS Market Revenue (billion), by Component 2025 & 2033
- Figure 28: Europe Specialty PACS Market Volume (K Unit), by Component 2025 & 2033
- Figure 29: Europe Specialty PACS Market Revenue Share (%), by Component 2025 & 2033
- Figure 30: Europe Specialty PACS Market Volume Share (%), by Component 2025 & 2033
- Figure 31: Europe Specialty PACS Market Revenue (billion), by Development 2025 & 2033
- Figure 32: Europe Specialty PACS Market Volume (K Unit), by Development 2025 & 2033
- Figure 33: Europe Specialty PACS Market Revenue Share (%), by Development 2025 & 2033
- Figure 34: Europe Specialty PACS Market Volume Share (%), by Development 2025 & 2033
- Figure 35: Europe Specialty PACS Market Revenue (billion), by End User 2025 & 2033
- Figure 36: Europe Specialty PACS Market Volume (K Unit), by End User 2025 & 2033
- Figure 37: Europe Specialty PACS Market Revenue Share (%), by End User 2025 & 2033
- Figure 38: Europe Specialty PACS Market Volume Share (%), by End User 2025 & 2033
- Figure 39: Europe Specialty PACS Market Revenue (billion), by Country 2025 & 2033
- Figure 40: Europe Specialty PACS Market Volume (K Unit), by Country 2025 & 2033
- Figure 41: Europe Specialty PACS Market Revenue Share (%), by Country 2025 & 2033
- Figure 42: Europe Specialty PACS Market Volume Share (%), by Country 2025 & 2033
- Figure 43: Asia Pacific Specialty PACS Market Revenue (billion), by Type 2025 & 2033
- Figure 44: Asia Pacific Specialty PACS Market Volume (K Unit), by Type 2025 & 2033
- Figure 45: Asia Pacific Specialty PACS Market Revenue Share (%), by Type 2025 & 2033
- Figure 46: Asia Pacific Specialty PACS Market Volume Share (%), by Type 2025 & 2033
- Figure 47: Asia Pacific Specialty PACS Market Revenue (billion), by Component 2025 & 2033
- Figure 48: Asia Pacific Specialty PACS Market Volume (K Unit), by Component 2025 & 2033
- Figure 49: Asia Pacific Specialty PACS Market Revenue Share (%), by Component 2025 & 2033
- Figure 50: Asia Pacific Specialty PACS Market Volume Share (%), by Component 2025 & 2033
- Figure 51: Asia Pacific Specialty PACS Market Revenue (billion), by Development 2025 & 2033
- Figure 52: Asia Pacific Specialty PACS Market Volume (K Unit), by Development 2025 & 2033
- Figure 53: Asia Pacific Specialty PACS Market Revenue Share (%), by Development 2025 & 2033
- Figure 54: Asia Pacific Specialty PACS Market Volume Share (%), by Development 2025 & 2033
- Figure 55: Asia Pacific Specialty PACS Market Revenue (billion), by End User 2025 & 2033
- Figure 56: Asia Pacific Specialty PACS Market Volume (K Unit), by End User 2025 & 2033
- Figure 57: Asia Pacific Specialty PACS Market Revenue Share (%), by End User 2025 & 2033
- Figure 58: Asia Pacific Specialty PACS Market Volume Share (%), by End User 2025 & 2033
- Figure 59: Asia Pacific Specialty PACS Market Revenue (billion), by Country 2025 & 2033
- Figure 60: Asia Pacific Specialty PACS Market Volume (K Unit), by Country 2025 & 2033
- Figure 61: Asia Pacific Specialty PACS Market Revenue Share (%), by Country 2025 & 2033
- Figure 62: Asia Pacific Specialty PACS Market Volume Share (%), by Country 2025 & 2033
- Figure 63: Middle East and Africa Specialty PACS Market Revenue (billion), by Type 2025 & 2033
- Figure 64: Middle East and Africa Specialty PACS Market Volume (K Unit), by Type 2025 & 2033
- Figure 65: Middle East and Africa Specialty PACS Market Revenue Share (%), by Type 2025 & 2033
- Figure 66: Middle East and Africa Specialty PACS Market Volume Share (%), by Type 2025 & 2033
- Figure 67: Middle East and Africa Specialty PACS Market Revenue (billion), by Component 2025 & 2033
- Figure 68: Middle East and Africa Specialty PACS Market Volume (K Unit), by Component 2025 & 2033
- Figure 69: Middle East and Africa Specialty PACS Market Revenue Share (%), by Component 2025 & 2033
- Figure 70: Middle East and Africa Specialty PACS Market Volume Share (%), by Component 2025 & 2033
- Figure 71: Middle East and Africa Specialty PACS Market Revenue (billion), by Development 2025 & 2033
- Figure 72: Middle East and Africa Specialty PACS Market Volume (K Unit), by Development 2025 & 2033
- Figure 73: Middle East and Africa Specialty PACS Market Revenue Share (%), by Development 2025 & 2033
- Figure 74: Middle East and Africa Specialty PACS Market Volume Share (%), by Development 2025 & 2033
- Figure 75: Middle East and Africa Specialty PACS Market Revenue (billion), by End User 2025 & 2033
- Figure 76: Middle East and Africa Specialty PACS Market Volume (K Unit), by End User 2025 & 2033
- Figure 77: Middle East and Africa Specialty PACS Market Revenue Share (%), by End User 2025 & 2033
- Figure 78: Middle East and Africa Specialty PACS Market Volume Share (%), by End User 2025 & 2033
- Figure 79: Middle East and Africa Specialty PACS Market Revenue (billion), by Country 2025 & 2033
- Figure 80: Middle East and Africa Specialty PACS Market Volume (K Unit), by Country 2025 & 2033
- Figure 81: Middle East and Africa Specialty PACS Market Revenue Share (%), by Country 2025 & 2033
- Figure 82: Middle East and Africa Specialty PACS Market Volume Share (%), by Country 2025 & 2033
- Figure 83: South America Specialty PACS Market Revenue (billion), by Type 2025 & 2033
- Figure 84: South America Specialty PACS Market Volume (K Unit), by Type 2025 & 2033
- Figure 85: South America Specialty PACS Market Revenue Share (%), by Type 2025 & 2033
- Figure 86: South America Specialty PACS Market Volume Share (%), by Type 2025 & 2033
- Figure 87: South America Specialty PACS Market Revenue (billion), by Component 2025 & 2033
- Figure 88: South America Specialty PACS Market Volume (K Unit), by Component 2025 & 2033
- Figure 89: South America Specialty PACS Market Revenue Share (%), by Component 2025 & 2033
- Figure 90: South America Specialty PACS Market Volume Share (%), by Component 2025 & 2033
- Figure 91: South America Specialty PACS Market Revenue (billion), by Development 2025 & 2033
- Figure 92: South America Specialty PACS Market Volume (K Unit), by Development 2025 & 2033
- Figure 93: South America Specialty PACS Market Revenue Share (%), by Development 2025 & 2033
- Figure 94: South America Specialty PACS Market Volume Share (%), by Development 2025 & 2033
- Figure 95: South America Specialty PACS Market Revenue (billion), by End User 2025 & 2033
- Figure 96: South America Specialty PACS Market Volume (K Unit), by End User 2025 & 2033
- Figure 97: South America Specialty PACS Market Revenue Share (%), by End User 2025 & 2033
- Figure 98: South America Specialty PACS Market Volume Share (%), by End User 2025 & 2033
- Figure 99: South America Specialty PACS Market Revenue (billion), by Country 2025 & 2033
- Figure 100: South America Specialty PACS Market Volume (K Unit), by Country 2025 & 2033
- Figure 101: South America Specialty PACS Market Revenue Share (%), by Country 2025 & 2033
- Figure 102: South America Specialty PACS Market Volume Share (%), by Country 2025 & 2033
List of Tables
- Table 1: Global Specialty PACS Market Revenue billion Forecast, by Type 2020 & 2033
- Table 2: Global Specialty PACS Market Volume K Unit Forecast, by Type 2020 & 2033
- Table 3: Global Specialty PACS Market Revenue billion Forecast, by Component 2020 & 2033
- Table 4: Global Specialty PACS Market Volume K Unit Forecast, by Component 2020 & 2033
- Table 5: Global Specialty PACS Market Revenue billion Forecast, by Development 2020 & 2033
- Table 6: Global Specialty PACS Market Volume K Unit Forecast, by Development 2020 & 2033
- Table 7: Global Specialty PACS Market Revenue billion Forecast, by End User 2020 & 2033
- Table 8: Global Specialty PACS Market Volume K Unit Forecast, by End User 2020 & 2033
- Table 9: Global Specialty PACS Market Revenue billion Forecast, by Region 2020 & 2033
- Table 10: Global Specialty PACS Market Volume K Unit Forecast, by Region 2020 & 2033
- Table 11: Global Specialty PACS Market Revenue billion Forecast, by Type 2020 & 2033
- Table 12: Global Specialty PACS Market Volume K Unit Forecast, by Type 2020 & 2033
- Table 13: Global Specialty PACS Market Revenue billion Forecast, by Component 2020 & 2033
- Table 14: Global Specialty PACS Market Volume K Unit Forecast, by Component 2020 & 2033
- Table 15: Global Specialty PACS Market Revenue billion Forecast, by Development 2020 & 2033
- Table 16: Global Specialty PACS Market Volume K Unit Forecast, by Development 2020 & 2033
- Table 17: Global Specialty PACS Market Revenue billion Forecast, by End User 2020 & 2033
- Table 18: Global Specialty PACS Market Volume K Unit Forecast, by End User 2020 & 2033
- Table 19: Global Specialty PACS Market Revenue billion Forecast, by Country 2020 & 2033
- Table 20: Global Specialty PACS Market Volume K Unit Forecast, by Country 2020 & 2033
- Table 21: United States Specialty PACS Market Revenue (billion) Forecast, by Application 2020 & 2033
- Table 22: United States Specialty PACS Market Volume (K Unit) Forecast, by Application 2020 & 2033
- Table 23: Canada Specialty PACS Market Revenue (billion) Forecast, by Application 2020 & 2033
- Table 24: Canada Specialty PACS Market Volume (K Unit) Forecast, by Application 2020 & 2033
- Table 25: Mexico Specialty PACS Market Revenue (billion) Forecast, by Application 2020 & 2033
- Table 26: Mexico Specialty PACS Market Volume (K Unit) Forecast, by Application 2020 & 2033
- Table 27: Global Specialty PACS Market Revenue billion Forecast, by Type 2020 & 2033
- Table 28: Global Specialty PACS Market Volume K Unit Forecast, by Type 2020 & 2033
- Table 29: Global Specialty PACS Market Revenue billion Forecast, by Component 2020 & 2033
- Table 30: Global Specialty PACS Market Volume K Unit Forecast, by Component 2020 & 2033
- Table 31: Global Specialty PACS Market Revenue billion Forecast, by Development 2020 & 2033
- Table 32: Global Specialty PACS Market Volume K Unit Forecast, by Development 2020 & 2033
- Table 33: Global Specialty PACS Market Revenue billion Forecast, by End User 2020 & 2033
- Table 34: Global Specialty PACS Market Volume K Unit Forecast, by End User 2020 & 2033
- Table 35: Global Specialty PACS Market Revenue billion Forecast, by Country 2020 & 2033
- Table 36: Global Specialty PACS Market Volume K Unit Forecast, by Country 2020 & 2033
- Table 37: Germany Specialty PACS Market Revenue (billion) Forecast, by Application 2020 & 2033
- Table 38: Germany Specialty PACS Market Volume (K Unit) Forecast, by Application 2020 & 2033
- Table 39: United Kingdom Specialty PACS Market Revenue (billion) Forecast, by Application 2020 & 2033
- Table 40: United Kingdom Specialty PACS Market Volume (K Unit) Forecast, by Application 2020 & 2033
- Table 41: France Specialty PACS Market Revenue (billion) Forecast, by Application 2020 & 2033
- Table 42: France Specialty PACS Market Volume (K Unit) Forecast, by Application 2020 & 2033
- Table 43: Italy Specialty PACS Market Revenue (billion) Forecast, by Application 2020 & 2033
- Table 44: Italy Specialty PACS Market Volume (K Unit) Forecast, by Application 2020 & 2033
- Table 45: Spain Specialty PACS Market Revenue (billion) Forecast, by Application 2020 & 2033
- Table 46: Spain Specialty PACS Market Volume (K Unit) Forecast, by Application 2020 & 2033
- Table 47: Rest of Europe Specialty PACS Market Revenue (billion) Forecast, by Application 2020 & 2033
- Table 48: Rest of Europe Specialty PACS Market Volume (K Unit) Forecast, by Application 2020 & 2033
- Table 49: Global Specialty PACS Market Revenue billion Forecast, by Type 2020 & 2033
- Table 50: Global Specialty PACS Market Volume K Unit Forecast, by Type 2020 & 2033
- Table 51: Global Specialty PACS Market Revenue billion Forecast, by Component 2020 & 2033
- Table 52: Global Specialty PACS Market Volume K Unit Forecast, by Component 2020 & 2033
- Table 53: Global Specialty PACS Market Revenue billion Forecast, by Development 2020 & 2033
- Table 54: Global Specialty PACS Market Volume K Unit Forecast, by Development 2020 & 2033
- Table 55: Global Specialty PACS Market Revenue billion Forecast, by End User 2020 & 2033
- Table 56: Global Specialty PACS Market Volume K Unit Forecast, by End User 2020 & 2033
- Table 57: Global Specialty PACS Market Revenue billion Forecast, by Country 2020 & 2033
- Table 58: Global Specialty PACS Market Volume K Unit Forecast, by Country 2020 & 2033
- Table 59: China Specialty PACS Market Revenue (billion) Forecast, by Application 2020 & 2033
- Table 60: China Specialty PACS Market Volume (K Unit) Forecast, by Application 2020 & 2033
- Table 61: Japan Specialty PACS Market Revenue (billion) Forecast, by Application 2020 & 2033
- Table 62: Japan Specialty PACS Market Volume (K Unit) Forecast, by Application 2020 & 2033
- Table 63: India Specialty PACS Market Revenue (billion) Forecast, by Application 2020 & 2033
- Table 64: India Specialty PACS Market Volume (K Unit) Forecast, by Application 2020 & 2033
- Table 65: Australia Specialty PACS Market Revenue (billion) Forecast, by Application 2020 & 2033
- Table 66: Australia Specialty PACS Market Volume (K Unit) Forecast, by Application 2020 & 2033
- Table 67: South Korea Specialty PACS Market Revenue (billion) Forecast, by Application 2020 & 2033
- Table 68: South Korea Specialty PACS Market Volume (K Unit) Forecast, by Application 2020 & 2033
- Table 69: Rest of Asia Pacific Specialty PACS Market Revenue (billion) Forecast, by Application 2020 & 2033
- Table 70: Rest of Asia Pacific Specialty PACS Market Volume (K Unit) Forecast, by Application 2020 & 2033
- Table 71: Global Specialty PACS Market Revenue billion Forecast, by Type 2020 & 2033
- Table 72: Global Specialty PACS Market Volume K Unit Forecast, by Type 2020 & 2033
- Table 73: Global Specialty PACS Market Revenue billion Forecast, by Component 2020 & 2033
- Table 74: Global Specialty PACS Market Volume K Unit Forecast, by Component 2020 & 2033
- Table 75: Global Specialty PACS Market Revenue billion Forecast, by Development 2020 & 2033
- Table 76: Global Specialty PACS Market Volume K Unit Forecast, by Development 2020 & 2033
- Table 77: Global Specialty PACS Market Revenue billion Forecast, by End User 2020 & 2033
- Table 78: Global Specialty PACS Market Volume K Unit Forecast, by End User 2020 & 2033
- Table 79: Global Specialty PACS Market Revenue billion Forecast, by Country 2020 & 2033
- Table 80: Global Specialty PACS Market Volume K Unit Forecast, by Country 2020 & 2033
- Table 81: GCC Specialty PACS Market Revenue (billion) Forecast, by Application 2020 & 2033
- Table 82: GCC Specialty PACS Market Volume (K Unit) Forecast, by Application 2020 & 2033
- Table 83: South Africa Specialty PACS Market Revenue (billion) Forecast, by Application 2020 & 2033
- Table 84: South Africa Specialty PACS Market Volume (K Unit) Forecast, by Application 2020 & 2033
- Table 85: Rest of Middle East and Africa Specialty PACS Market Revenue (billion) Forecast, by Application 2020 & 2033
- Table 86: Rest of Middle East and Africa Specialty PACS Market Volume (K Unit) Forecast, by Application 2020 & 2033
- Table 87: Global Specialty PACS Market Revenue billion Forecast, by Type 2020 & 2033
- Table 88: Global Specialty PACS Market Volume K Unit Forecast, by Type 2020 & 2033
- Table 89: Global Specialty PACS Market Revenue billion Forecast, by Component 2020 & 2033
- Table 90: Global Specialty PACS Market Volume K Unit Forecast, by Component 2020 & 2033
- Table 91: Global Specialty PACS Market Revenue billion Forecast, by Development 2020 & 2033
- Table 92: Global Specialty PACS Market Volume K Unit Forecast, by Development 2020 & 2033
- Table 93: Global Specialty PACS Market Revenue billion Forecast, by End User 2020 & 2033
- Table 94: Global Specialty PACS Market Volume K Unit Forecast, by End User 2020 & 2033
- Table 95: Global Specialty PACS Market Revenue billion Forecast, by Country 2020 & 2033
- Table 96: Global Specialty PACS Market Volume K Unit Forecast, by Country 2020 & 2033
- Table 97: Brazil Specialty PACS Market Revenue (billion) Forecast, by Application 2020 & 2033
- Table 98: Brazil Specialty PACS Market Volume (K Unit) Forecast, by Application 2020 & 2033
- Table 99: Argentina Specialty PACS Market Revenue (billion) Forecast, by Application 2020 & 2033
- Table 100: Argentina Specialty PACS Market Volume (K Unit) Forecast, by Application 2020 & 2033
- Table 101: Rest of South America Specialty PACS Market Revenue (billion) Forecast, by Application 2020 & 2033
- Table 102: Rest of South America Specialty PACS Market Volume (K Unit) Forecast, by Application 2020 & 2033
Frequently Asked Questions
1. What is the projected Compound Annual Growth Rate (CAGR) of the Specialty PACS Market?
The projected CAGR is approximately 8.5%.
2. Which companies are prominent players in the Specialty PACS Market?
Key companies in the market include Sectra AB, IBM Corporation, Novarad, Topcon Corporation, Siemens AG, Philips Healthcare, Canon USA Inc, Agfa Healthcare, McKesson Corporation, Fujifilm Holdings Corporation (Fujifilm Medical Systems).
3. What are the main segments of the Specialty PACS Market?
The market segments include Type, Component, Development, End User.
4. Can you provide details about the market size?
The market size is estimated to be USD 5.31 billion as of 2022.
5. What are some drivers contributing to market growth?
Growing Use of Imaging Devices; Growing Burden of Chronic Diseases.
6. What are the notable trends driving market growth?
On-premise Specialty PACS are Expected to Hold the Largest Market Share in the Specialty PACS Market.
7. Are there any restraints impacting market growth?
Data Security and Privacy Issues.
8. Can you provide examples of recent developments in the market?
April 2022: FUJIFILM Healthcare Americas Corporation installed Fujifilm's Synapse Cardiology PACS version 7 throughout Emory Healthcare facilities to store, process, and analyze heart and vascular imaging. Emory Healthcare is the most comprehensive academic health system in Georgia.
9. What pricing options are available for accessing the report?
Pricing options include single-user, multi-user, and enterprise licenses priced at USD 4750, USD 5250, and USD 8750 respectively.
10. Is the market size provided in terms of value or volume?
The market size is provided in terms of value, measured in billion and volume, measured in K Unit.
11. Are there any specific market keywords associated with the report?
Yes, the market keyword associated with the report is "Specialty PACS Market," which aids in identifying and referencing the specific market segment covered.
12. How do I determine which pricing option suits my needs best?
The pricing options vary based on user requirements and access needs. Individual users may opt for single-user licenses, while businesses requiring broader access may choose multi-user or enterprise licenses for cost-effective access to the report.
13. Are there any additional resources or data provided in the Specialty PACS Market report?
While the report offers comprehensive insights, it's advisable to review the specific contents or supplementary materials provided to ascertain if additional resources or data are available.
14. How can I stay updated on further developments or reports in the Specialty PACS Market?
To stay informed about further developments, trends, and reports in the Specialty PACS Market, consider subscribing to industry newsletters, following relevant companies and organizations, or regularly checking reputable industry news sources and publications.
Methodology
Step 1 - Identification of Relevant Samples Size from Population Database


Step 2 - Approaches for Defining Global Market Size (Value, Volume* & Price*)

Note*: In applicable scenarios
Step 3 - Data Sources
Primary Research
- Web Analytics
- Survey Reports
- Research Institute
- Latest Research Reports
- Opinion Leaders
Secondary Research
- Annual Reports
- White Paper
- Latest Press Release
- Industry Association
- Paid Database
- Investor Presentations

Step 4 - Data Triangulation
Involves using different sources of information in order to increase the validity of a study
These sources are likely to be stakeholders in a program - participants, other researchers, program staff, other community members, and so on.
Then we put all data in single framework & apply various statistical tools to find out the dynamic on the market.
During the analysis stage, feedback from the stakeholder groups would be compared to determine areas of agreement as well as areas of divergence