

Key Insights
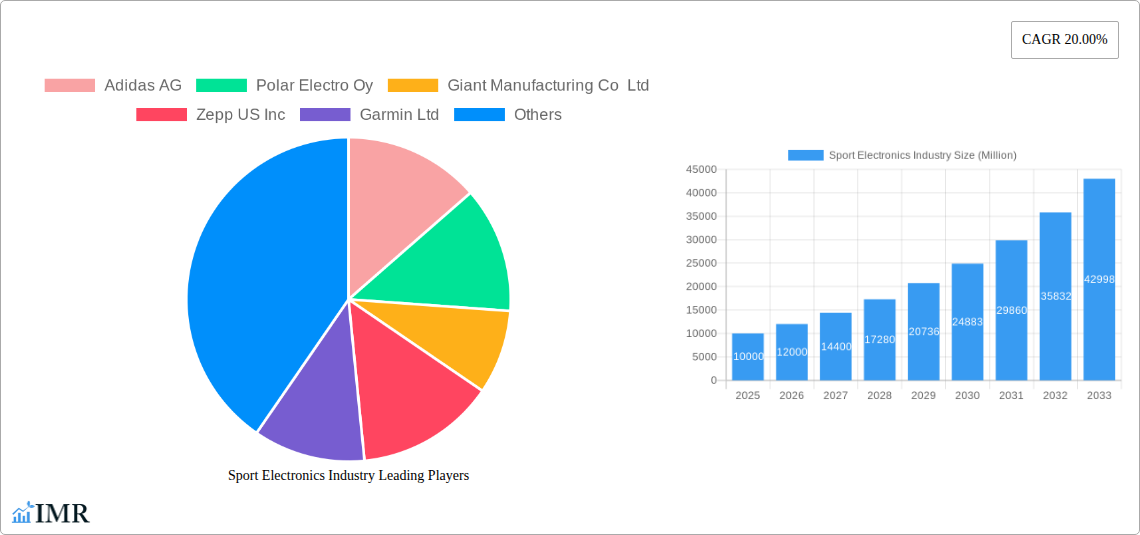
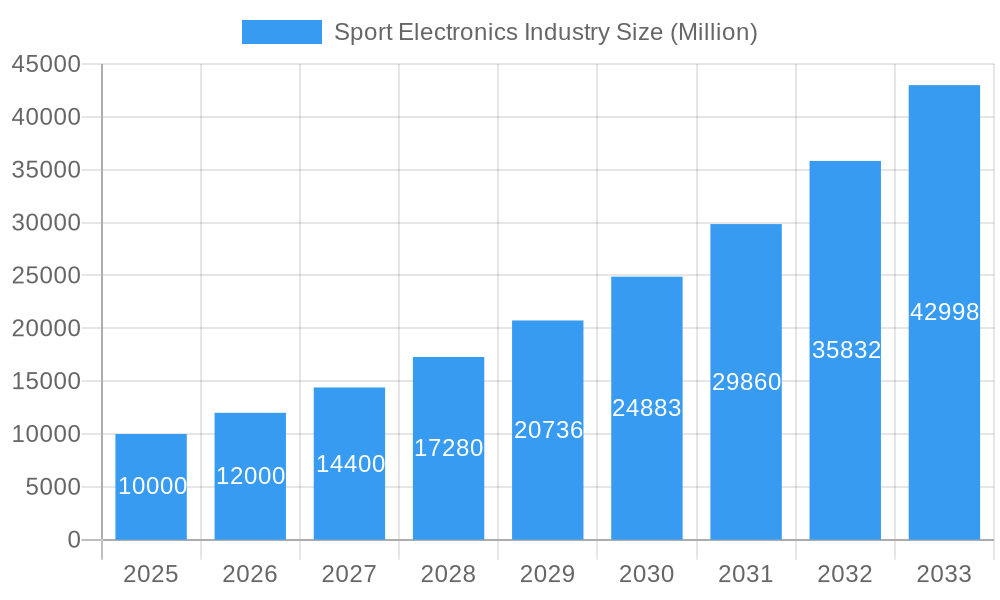
The global sport electronics market is experiencing robust growth, fueled by a confluence of factors. The rising popularity of fitness tracking and athletic performance enhancement, coupled with technological advancements in wearable sensors and data analytics, is driving significant demand. A compound annual growth rate (CAGR) of 20% from 2019-2033 indicates a substantial expansion, transforming the industry from a niche market to a mainstream consumer and professional sports sector. Key segments, like wearable devices (smartwatches, fitness trackers, and heart rate monitors) and standalone devices (GPS trackers, video analysis systems), are experiencing disproportionate growth due to their versatility and increasing affordability. Major players like Apple, Fitbit, Garmin, and Adidas are leveraging their brand recognition and technological expertise to capture market share, fostering innovation and competition. The market's expansion is geographically diverse, with North America and Europe currently leading, although the Asia-Pacific region is projected to experience rapid growth due to increasing disposable incomes and a growing health-conscious population.
Sport Electronics Industry Market Size (In Billion)
The market faces some challenges. Supply chain disruptions and the potential for technological obsolescence present ongoing hurdles. However, the continuous integration of artificial intelligence (AI) and machine learning (ML) into sport electronics is creating new opportunities for personalized training and performance analysis. Further segmentation is likely, catering to specific sports and individual needs, leading to the development of more specialized and feature-rich products. The increasing focus on data privacy and security is also a significant factor shaping the market's development, encouraging companies to prioritize user data protection and transparency. The long-term outlook for the sport electronics market remains positive, driven by a growing health-conscious global population and continuing technological progress. Strategic partnerships between technology companies and sports brands are likely to further accelerate market growth.
Sport Electronics Industry Company Market Share
Sport Electronics Industry Market Report: 2019-2033
This comprehensive report provides an in-depth analysis of the Sport Electronics Industry, encompassing market dynamics, growth trends, regional dominance, product landscapes, key players, and future outlooks. The study period covers 2019-2033, with 2025 serving as the base and estimated year. The report meticulously segments the market by product type: Wearable Devices and Other Wearable Devices (Standalone Devices). This detailed analysis is crucial for businesses and investors seeking to understand and capitalize on the dynamic opportunities within this rapidly evolving sector. The market size is projected to reach xx Million units by 2033.
Sport Electronics Industry Market Dynamics & Structure
The Sport Electronics industry is characterized by moderate market concentration, with key players like Apple Inc., Nike Inc., and Adidas AG holding significant market share. However, the emergence of innovative startups and technological advancements contribute to a dynamic competitive landscape. Technological innovation, driven by advancements in sensor technology, data analytics, and connectivity, is a primary growth driver. Regulatory frameworks concerning data privacy and product safety influence market dynamics. The industry also faces competition from substitute products, such as traditional fitness equipment. End-user demographics, particularly the growing interest in fitness and health monitoring among millennials and Gen Z, significantly influence market demand. M&A activity has been notable, with several large players acquiring smaller companies to expand their product portfolios and technological capabilities. Over the historical period (2019-2024), we estimate approximately xx M&A deals occurred, contributing to industry consolidation.
- Market Concentration: Moderately concentrated, with top 5 players holding approximately xx% market share in 2025.
- Technological Innovation: Key drivers include advancements in sensor technology, AI-powered analytics, and improved connectivity (e.g., Bluetooth, Wi-Fi).
- Regulatory Frameworks: Compliance with data privacy regulations (GDPR, CCPA) and product safety standards is crucial.
- Competitive Substitutes: Traditional fitness equipment and alternative health tracking methods pose a competitive threat.
- End-User Demographics: Growing adoption among millennials and Gen Z drives market expansion.
- M&A Trends: Consolidation through strategic acquisitions is increasing industry concentration.
Sport Electronics Industry Growth Trends & Insights
The Sport Electronics market experienced significant growth during the historical period (2019-2024), driven by increasing health consciousness, technological advancements, and the rising popularity of fitness tracking and wearable technology. The market size, estimated at xx Million units in 2025, is projected to exhibit a Compound Annual Growth Rate (CAGR) of xx% during the forecast period (2025-2033), reaching xx Million units by 2033. This growth is fueled by increased adoption rates of wearable devices, particularly smartwatches and fitness trackers, coupled with technological disruptions that enhance product functionalities and user experience. Consumer behavior shifts toward personalized fitness regimes and data-driven insights further contribute to market expansion. The market penetration rate for wearable devices is anticipated to increase from xx% in 2025 to xx% by 2033. The integration of Artificial Intelligence (AI) and machine learning algorithms is transforming the industry, personalizing fitness plans and providing advanced health metrics.
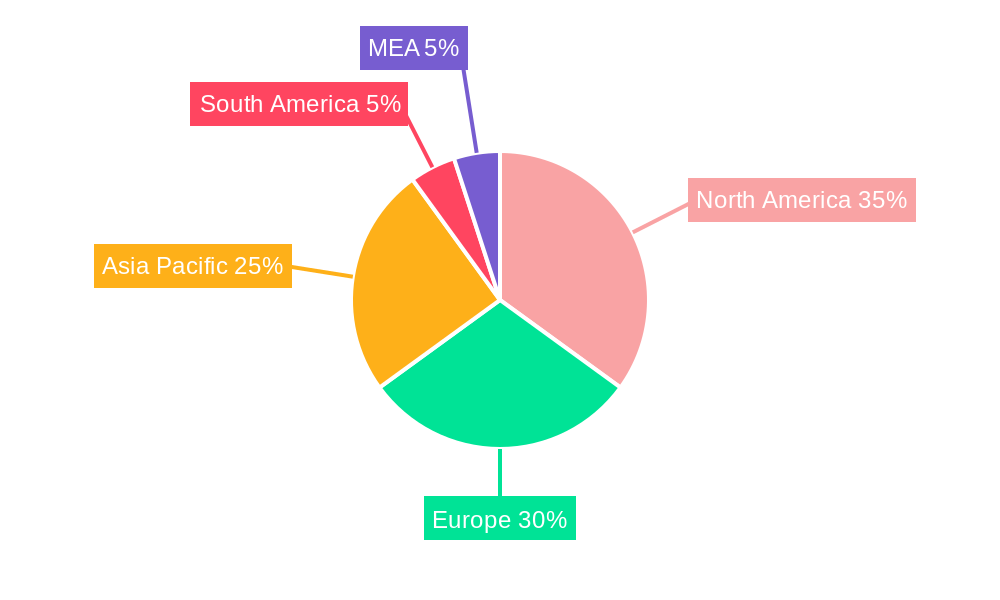
Dominant Regions, Countries, or Segments in Sport Electronics Industry
North America currently dominates the Sport Electronics market, holding the largest market share in 2025, attributed to high disposable incomes, advanced technological infrastructure, and high adoption rates of fitness-related technology. Europe follows as a significant market, driven by increasing health awareness and government initiatives promoting healthy lifestyles. Within product segments, Wearable Devices represent the largest segment, accounting for approximately xx% of the total market in 2025, fueled by the popularity of smartwatches and fitness trackers. Standalone devices like heart rate monitors and GPS trackers also contribute significantly, representing xx% of the market.
- North America: High disposable income, advanced technology infrastructure, and high consumer adoption of wearable tech.
- Europe: Increasing health awareness, government initiatives promoting healthy lifestyles.
- Wearable Devices: High demand for smartwatches and fitness trackers.
- Standalone Devices: Steady demand for specialized fitness equipment.
Sport Electronics Industry Product Landscape
The Sport Electronics industry offers a diverse range of products, including smartwatches, fitness trackers, GPS devices, heart rate monitors, action cameras, and other specialized equipment. These products are characterized by continuous innovation in sensor technology, data analytics, and connectivity features. Unique selling propositions often center around advanced features like personalized workout plans, health metrics tracking, and seamless integration with mobile applications. Technological advancements have led to smaller, lighter, and more durable devices with extended battery life and improved accuracy.
Key Drivers, Barriers & Challenges in Sport Electronics Industry
Key Drivers: Increasing health awareness, technological advancements (miniaturization, improved sensors), rising disposable incomes, and government initiatives promoting fitness and health. The integration of AI and machine learning capabilities further accelerates market expansion.
Challenges: Intense competition, high research and development costs, data security and privacy concerns, and potential supply chain disruptions. These challenges represent a constraint on market growth potential. For example, the reliance on specific components manufactured in certain regions (e.g., Asia) makes the industry vulnerable to global supply chain disruptions, potentially impacting production and ultimately impacting revenues by xx% in a severe disruption scenario.
Emerging Opportunities in Sport Electronics Industry
The integration of virtual reality (VR) and augmented reality (AR) technologies in fitness applications presents exciting opportunities. The expansion into untapped markets in developing countries with rising middle-class populations shows immense potential. Personalized fitness plans driven by AI-powered analytics and sophisticated wearable devices provide a huge opportunity for innovation. New functionalities, such as stress and sleep monitoring, also attract users.
Growth Accelerators in the Sport Electronics Industry
Strategic partnerships between technology companies and fitness brands will drive market expansion. Continuous technological innovation in areas such as battery life and sensor accuracy will fuel adoption. Furthermore, the expansion into new markets and product diversification will contribute to long-term sustainable growth.
Key Players Shaping the Sport Electronics Industry Market
Notable Milestones in Sport Electronics Industry Sector
- 2020: Fitbit acquired by Google.
- 2021: Apple launched the Apple Watch Series 7 with advanced health features.
- 2022: Garmin released new GPS watches with enhanced performance metrics.
- 2023: Several companies announced partnerships for data integration in fitness apps.
In-Depth Sport Electronics Industry Market Outlook
The Sport Electronics industry is poised for continued robust growth, driven by technological innovation, increasing health consciousness, and expanding market penetration. Strategic collaborations, product diversification, and the exploration of emerging markets will shape future market dynamics. The focus on personalized fitness experiences and advanced health analytics will continue to be a significant driver of market expansion, creating significant opportunities for established players and new entrants alike. The market is expected to maintain a steady growth trajectory throughout the forecast period, presenting substantial potential for long-term investment and market expansion.
Sport Electronics Industry Segmentation
-
1. Product Type
-
1.1. Wearable Devices
- 1.1.1. Pedometers
- 1.1.2. Activity Monitors
- 1.1.3. Smart Fabrics
- 1.1.4. Fitness and Heart Rate Monitors
- 1.1.5. Other Wearable Devices
-
1.2. Standalone Devices
- 1.2.1. Electronics Scales
- 1.2.2. Cameras
- 1.2.3. Cycling Computers
- 1.2.4. Other Standalone Devices
-
1.1. Wearable Devices
Sport Electronics Industry Segmentation By Geography
- 1. North America
- 2. Europe
- 3. Asia Pacific
- 4. Latin America
- 5. Middle East
Sport Electronics Industry Regional Market Share
Geographic Coverage of Sport Electronics Industry
Sport Electronics Industry REPORT HIGHLIGHTS
| Aspects | Details |
|---|---|
| Study Period | 2020-2034 |
| Base Year | 2025 |
| Estimated Year | 2026 |
| Forecast Period | 2026-2034 |
| Historical Period | 2020-2025 |
| Growth Rate | CAGR of 14.9% from 2020-2034 |
| Segmentation |
|
Table of Contents
- 1. Introduction
- 1.1. Research Scope
- 1.2. Market Segmentation
- 1.3. Research Objective
- 1.4. Definitions and Assumptions
- 2. Executive Summary
- 2.1. Market Snapshot
- 3. Market Dynamics
- 3.1. Market Drivers
- 3.2. Market Restrains
- 3.3. Market Trends
- 3.4. Market Opportunities
- 4. Market Factor Analysis
- 4.1. Porters Five Forces
- 4.1.1. Bargaining Power of Suppliers
- 4.1.2. Bargaining Power of Buyers
- 4.1.3. Threat of New Entrants
- 4.1.4. Threat of Substitutes
- 4.1.5. Competitive Rivalry
- 4.2. PESTEL analysis
- 4.3. BCG Analysis
- 4.3.1. Stars (High Growth, High Market Share)
- 4.3.2. Cash Cows (Low Growth, High Market Share)
- 4.3.3. Question Mark (High Growth, Low Market Share)
- 4.3.4. Dogs (Low Growth, Low Market Share)
- 4.4. Ansoff Matrix Analysis
- 4.5. Supply Chain Analysis
- 4.6. Regulatory Landscape
- 4.7. Current Market Potential and Opportunity Assessment (TAM–SAM–SOM Framework)
- 4.8. IMR Analyst Note
- 4.1. Porters Five Forces
- 5. Market Analysis, Insights and Forecast 2021-2033
- 5.1. Market Analysis, Insights and Forecast - by Product Type
- 5.1.1. Wearable Devices
- 5.1.1.1. Pedometers
- 5.1.1.2. Activity Monitors
- 5.1.1.3. Smart Fabrics
- 5.1.1.4. Fitness and Heart Rate Monitors
- 5.1.1.5. Other Wearable Devices
- 5.1.2. Standalone Devices
- 5.1.2.1. Electronics Scales
- 5.1.2.2. Cameras
- 5.1.2.3. Cycling Computers
- 5.1.2.4. Other Standalone Devices
- 5.1.1. Wearable Devices
- 5.2. Market Analysis, Insights and Forecast - by Region
- 5.2.1. North America
- 5.2.2. Europe
- 5.2.3. Asia Pacific
- 5.2.4. Latin America
- 5.2.5. Middle East
- 5.1. Market Analysis, Insights and Forecast - by Product Type
- 6. Global Sport Electronics Industry Analysis, Insights and Forecast, 2021-2033
- 6.1. Market Analysis, Insights and Forecast - by Product Type
- 6.1.1. Wearable Devices
- 6.1.1.1. Pedometers
- 6.1.1.2. Activity Monitors
- 6.1.1.3. Smart Fabrics
- 6.1.1.4. Fitness and Heart Rate Monitors
- 6.1.1.5. Other Wearable Devices
- 6.1.2. Standalone Devices
- 6.1.2.1. Electronics Scales
- 6.1.2.2. Cameras
- 6.1.2.3. Cycling Computers
- 6.1.2.4. Other Standalone Devices
- 6.1.1. Wearable Devices
- 6.1. Market Analysis, Insights and Forecast - by Product Type
- 7. North America Sport Electronics Industry Analysis, Insights and Forecast, 2020-2032
- 7.1. Market Analysis, Insights and Forecast - by Product Type
- 7.1.1. Wearable Devices
- 7.1.1.1. Pedometers
- 7.1.1.2. Activity Monitors
- 7.1.1.3. Smart Fabrics
- 7.1.1.4. Fitness and Heart Rate Monitors
- 7.1.1.5. Other Wearable Devices
- 7.1.2. Standalone Devices
- 7.1.2.1. Electronics Scales
- 7.1.2.2. Cameras
- 7.1.2.3. Cycling Computers
- 7.1.2.4. Other Standalone Devices
- 7.1.1. Wearable Devices
- 7.1. Market Analysis, Insights and Forecast - by Product Type
- 8. Europe Sport Electronics Industry Analysis, Insights and Forecast, 2020-2032
- 8.1. Market Analysis, Insights and Forecast - by Product Type
- 8.1.1. Wearable Devices
- 8.1.1.1. Pedometers
- 8.1.1.2. Activity Monitors
- 8.1.1.3. Smart Fabrics
- 8.1.1.4. Fitness and Heart Rate Monitors
- 8.1.1.5. Other Wearable Devices
- 8.1.2. Standalone Devices
- 8.1.2.1. Electronics Scales
- 8.1.2.2. Cameras
- 8.1.2.3. Cycling Computers
- 8.1.2.4. Other Standalone Devices
- 8.1.1. Wearable Devices
- 8.1. Market Analysis, Insights and Forecast - by Product Type
- 9. Asia Pacific Sport Electronics Industry Analysis, Insights and Forecast, 2020-2032
- 9.1. Market Analysis, Insights and Forecast - by Product Type
- 9.1.1. Wearable Devices
- 9.1.1.1. Pedometers
- 9.1.1.2. Activity Monitors
- 9.1.1.3. Smart Fabrics
- 9.1.1.4. Fitness and Heart Rate Monitors
- 9.1.1.5. Other Wearable Devices
- 9.1.2. Standalone Devices
- 9.1.2.1. Electronics Scales
- 9.1.2.2. Cameras
- 9.1.2.3. Cycling Computers
- 9.1.2.4. Other Standalone Devices
- 9.1.1. Wearable Devices
- 9.1. Market Analysis, Insights and Forecast - by Product Type
- 10. Latin America Sport Electronics Industry Analysis, Insights and Forecast, 2020-2032
- 10.1. Market Analysis, Insights and Forecast - by Product Type
- 10.1.1. Wearable Devices
- 10.1.1.1. Pedometers
- 10.1.1.2. Activity Monitors
- 10.1.1.3. Smart Fabrics
- 10.1.1.4. Fitness and Heart Rate Monitors
- 10.1.1.5. Other Wearable Devices
- 10.1.2. Standalone Devices
- 10.1.2.1. Electronics Scales
- 10.1.2.2. Cameras
- 10.1.2.3. Cycling Computers
- 10.1.2.4. Other Standalone Devices
- 10.1.1. Wearable Devices
- 10.1. Market Analysis, Insights and Forecast - by Product Type
- 11. Middle East Sport Electronics Industry Analysis, Insights and Forecast, 2020-2032
- 11.1. Market Analysis, Insights and Forecast - by Product Type
- 11.1.1. Wearable Devices
- 11.1.1.1. Pedometers
- 11.1.1.2. Activity Monitors
- 11.1.1.3. Smart Fabrics
- 11.1.1.4. Fitness and Heart Rate Monitors
- 11.1.1.5. Other Wearable Devices
- 11.1.2. Standalone Devices
- 11.1.2.1. Electronics Scales
- 11.1.2.2. Cameras
- 11.1.2.3. Cycling Computers
- 11.1.2.4. Other Standalone Devices
- 11.1.1. Wearable Devices
- 11.1. Market Analysis, Insights and Forecast - by Product Type
- 12. Competitive Analysis
- 12.1. Company Profiles
- 12.1.1 Adidas AG
- 12.1.1.1. Company Overview
- 12.1.1.2. Products
- 12.1.1.3. Company Financials
- 12.1.1.4. SWOT Analysis
- 12.1.2 Polar Electro Oy
- 12.1.2.1. Company Overview
- 12.1.2.2. Products
- 12.1.2.3. Company Financials
- 12.1.2.4. SWOT Analysis
- 12.1.3 Giant Manufacturing Co Ltd
- 12.1.3.1. Company Overview
- 12.1.3.2. Products
- 12.1.3.3. Company Financials
- 12.1.3.4. SWOT Analysis
- 12.1.4 Zepp US Inc
- 12.1.4.1. Company Overview
- 12.1.4.2. Products
- 12.1.4.3. Company Financials
- 12.1.4.4. SWOT Analysis
- 12.1.5 Garmin Ltd
- 12.1.5.1. Company Overview
- 12.1.5.2. Products
- 12.1.5.3. Company Financials
- 12.1.5.4. SWOT Analysis
- 12.1.6 StretchSense Ltd
- 12.1.6.1. Company Overview
- 12.1.6.2. Products
- 12.1.6.3. Company Financials
- 12.1.6.4. SWOT Analysis
- 12.1.7 SZ DJI Technology Co Ltd
- 12.1.7.1. Company Overview
- 12.1.7.2. Products
- 12.1.7.3. Company Financials
- 12.1.7.4. SWOT Analysis
- 12.1.8 Fitbit Inc
- 12.1.8.1. Company Overview
- 12.1.8.2. Products
- 12.1.8.3. Company Financials
- 12.1.8.4. SWOT Analysis
- 12.1.9 Catapult Sports Pty Ltd
- 12.1.9.1. Company Overview
- 12.1.9.2. Products
- 12.1.9.3. Company Financials
- 12.1.9.4. SWOT Analysis
- 12.1.10 Apple Inc
- 12.1.10.1. Company Overview
- 12.1.10.2. Products
- 12.1.10.3. Company Financials
- 12.1.10.4. SWOT Analysis
- 12.1.11 Nike Inc
- 12.1.11.1. Company Overview
- 12.1.11.2. Products
- 12.1.11.3. Company Financials
- 12.1.11.4. SWOT Analysis
- 12.1.12 Under Armour
- 12.1.12.1. Company Overview
- 12.1.12.2. Products
- 12.1.12.3. Company Financials
- 12.1.12.4. SWOT Analysis
- 12.1.1 Adidas AG
- 12.2. Market Entropy
- 12.2.1 Company's Key Areas Served
- 12.2.2 Recent Developments
- 12.3. Company Market Share Analysis 2025
- 12.3.1 Top 5 Companies Market Share Analysis
- 12.3.2 Top 3 Companies Market Share Analysis
- 12.4. List of Potential Customers
- 13. Research Methodology
List of Figures
- Figure 1: Global Sport Electronics Industry Revenue Breakdown (undefined, %) by Region 2025 & 2033
- Figure 2: North America Sport Electronics Industry Revenue (undefined), by Product Type 2025 & 2033
- Figure 3: North America Sport Electronics Industry Revenue Share (%), by Product Type 2025 & 2033
- Figure 4: North America Sport Electronics Industry Revenue (undefined), by Country 2025 & 2033
- Figure 5: North America Sport Electronics Industry Revenue Share (%), by Country 2025 & 2033
- Figure 6: Europe Sport Electronics Industry Revenue (undefined), by Product Type 2025 & 2033
- Figure 7: Europe Sport Electronics Industry Revenue Share (%), by Product Type 2025 & 2033
- Figure 8: Europe Sport Electronics Industry Revenue (undefined), by Country 2025 & 2033
- Figure 9: Europe Sport Electronics Industry Revenue Share (%), by Country 2025 & 2033
- Figure 10: Asia Pacific Sport Electronics Industry Revenue (undefined), by Product Type 2025 & 2033
- Figure 11: Asia Pacific Sport Electronics Industry Revenue Share (%), by Product Type 2025 & 2033
- Figure 12: Asia Pacific Sport Electronics Industry Revenue (undefined), by Country 2025 & 2033
- Figure 13: Asia Pacific Sport Electronics Industry Revenue Share (%), by Country 2025 & 2033
- Figure 14: Latin America Sport Electronics Industry Revenue (undefined), by Product Type 2025 & 2033
- Figure 15: Latin America Sport Electronics Industry Revenue Share (%), by Product Type 2025 & 2033
- Figure 16: Latin America Sport Electronics Industry Revenue (undefined), by Country 2025 & 2033
- Figure 17: Latin America Sport Electronics Industry Revenue Share (%), by Country 2025 & 2033
- Figure 18: Middle East Sport Electronics Industry Revenue (undefined), by Product Type 2025 & 2033
- Figure 19: Middle East Sport Electronics Industry Revenue Share (%), by Product Type 2025 & 2033
- Figure 20: Middle East Sport Electronics Industry Revenue (undefined), by Country 2025 & 2033
- Figure 21: Middle East Sport Electronics Industry Revenue Share (%), by Country 2025 & 2033
List of Tables
- Table 1: Global Sport Electronics Industry Revenue undefined Forecast, by Product Type 2020 & 2033
- Table 2: Global Sport Electronics Industry Revenue undefined Forecast, by Region 2020 & 2033
- Table 3: Global Sport Electronics Industry Revenue undefined Forecast, by Product Type 2020 & 2033
- Table 4: Global Sport Electronics Industry Revenue undefined Forecast, by Country 2020 & 2033
- Table 5: Global Sport Electronics Industry Revenue undefined Forecast, by Product Type 2020 & 2033
- Table 6: Global Sport Electronics Industry Revenue undefined Forecast, by Country 2020 & 2033
- Table 7: Global Sport Electronics Industry Revenue undefined Forecast, by Product Type 2020 & 2033
- Table 8: Global Sport Electronics Industry Revenue undefined Forecast, by Country 2020 & 2033
- Table 9: Global Sport Electronics Industry Revenue undefined Forecast, by Product Type 2020 & 2033
- Table 10: Global Sport Electronics Industry Revenue undefined Forecast, by Country 2020 & 2033
- Table 11: Global Sport Electronics Industry Revenue undefined Forecast, by Product Type 2020 & 2033
- Table 12: Global Sport Electronics Industry Revenue undefined Forecast, by Country 2020 & 2033
Frequently Asked Questions
1. What is the projected Compound Annual Growth Rate (CAGR) of the Sport Electronics Industry?
The projected CAGR is approximately 14.9%.
2. Which companies are prominent players in the Sport Electronics Industry?
Key companies in the market include Adidas AG, Polar Electro Oy, Giant Manufacturing Co Ltd , Zepp US Inc, Garmin Ltd, StretchSense Ltd, SZ DJI Technology Co Ltd, Fitbit Inc, Catapult Sports Pty Ltd, Apple Inc, Nike Inc, Under Armour.
3. What are the main segments of the Sport Electronics Industry?
The market segments include Product Type.
4. Can you provide details about the market size?
The market size is estimated to be USD XXX N/A as of 2022.
5. What are some drivers contributing to market growth?
; Technological Advancements in Wearable Sports Devices; Rising Demand for Round-The-Clock Monitoring.
6. What are the notable trends driving market growth?
Smartwatch is Expected to Register a Significant Growth.
7. Are there any restraints impacting market growth?
; High Cost of Wearable Devices.
8. Can you provide examples of recent developments in the market?
N/A
9. What pricing options are available for accessing the report?
Pricing options include single-user, multi-user, and enterprise licenses priced at USD 4750, USD 5250, and USD 8750 respectively.
10. Is the market size provided in terms of value or volume?
The market size is provided in terms of value, measured in N/A.
11. Are there any specific market keywords associated with the report?
Yes, the market keyword associated with the report is "Sport Electronics Industry," which aids in identifying and referencing the specific market segment covered.
12. How do I determine which pricing option suits my needs best?
The pricing options vary based on user requirements and access needs. Individual users may opt for single-user licenses, while businesses requiring broader access may choose multi-user or enterprise licenses for cost-effective access to the report.
13. Are there any additional resources or data provided in the Sport Electronics Industry report?
While the report offers comprehensive insights, it's advisable to review the specific contents or supplementary materials provided to ascertain if additional resources or data are available.
14. How can I stay updated on further developments or reports in the Sport Electronics Industry?
To stay informed about further developments, trends, and reports in the Sport Electronics Industry, consider subscribing to industry newsletters, following relevant companies and organizations, or regularly checking reputable industry news sources and publications.
Methodology
Step 1 - Identification of Relevant Samples Size from Population Database


Step 2 - Approaches for Defining Global Market Size (Value, Volume* & Price*)

Note*: In applicable scenarios
Step 3 - Data Sources
Primary Research
- Web Analytics
- Survey Reports
- Research Institute
- Latest Research Reports
- Opinion Leaders
Secondary Research
- Annual Reports
- White Paper
- Latest Press Release
- Industry Association
- Paid Database
- Investor Presentations

Step 4 - Data Triangulation
Involves using different sources of information in order to increase the validity of a study
These sources are likely to be stakeholders in a program - participants, other researchers, program staff, other community members, and so on.
Then we put all data in single framework & apply various statistical tools to find out the dynamic on the market.
During the analysis stage, feedback from the stakeholder groups would be compared to determine areas of agreement as well as areas of divergence