

Key Insights
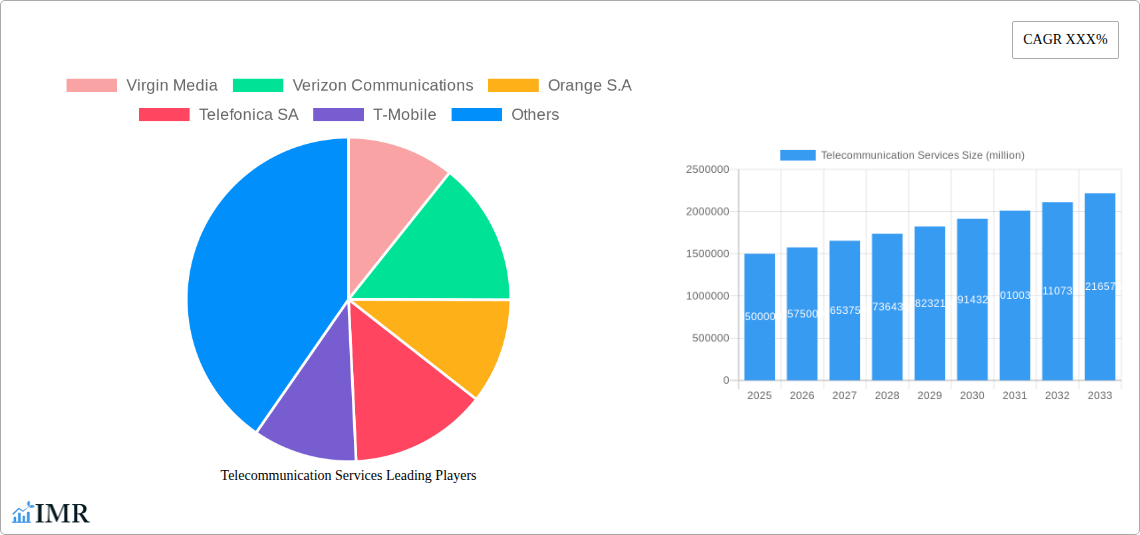
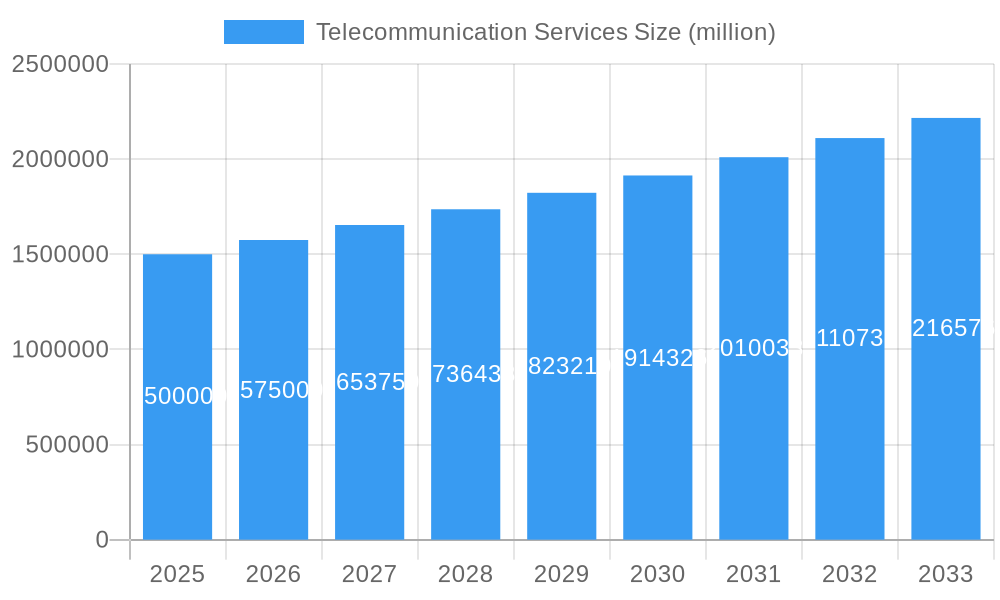
The global telecommunication services market demonstrates strong growth, propelled by escalating smartphone adoption, widespread internet availability, and the surging demand for data-intensive applications such as cloud computing and streaming. The market, valued at 2095716.3 million in the base year 2025, is projected to expand at a Compound Annual Growth Rate (CAGR) of 5.23% from 2025 to 2033. This growth is attributed to key drivers including the widespread deployment of 5G technology, the increasing integration of Internet of Things (IoT) devices, and continuous advancements in network infrastructure. Intense competition among leading providers like Virgin Media, Verizon, Orange, Telefónica, T-Mobile, and Vodafone fuels ongoing innovation and market evolution. Critical challenges include navigating regulatory frameworks, substantial infrastructure investments, and mitigating cybersecurity risks within expanding digital ecosystems.
Telecommunication Services Market Size (In Million)
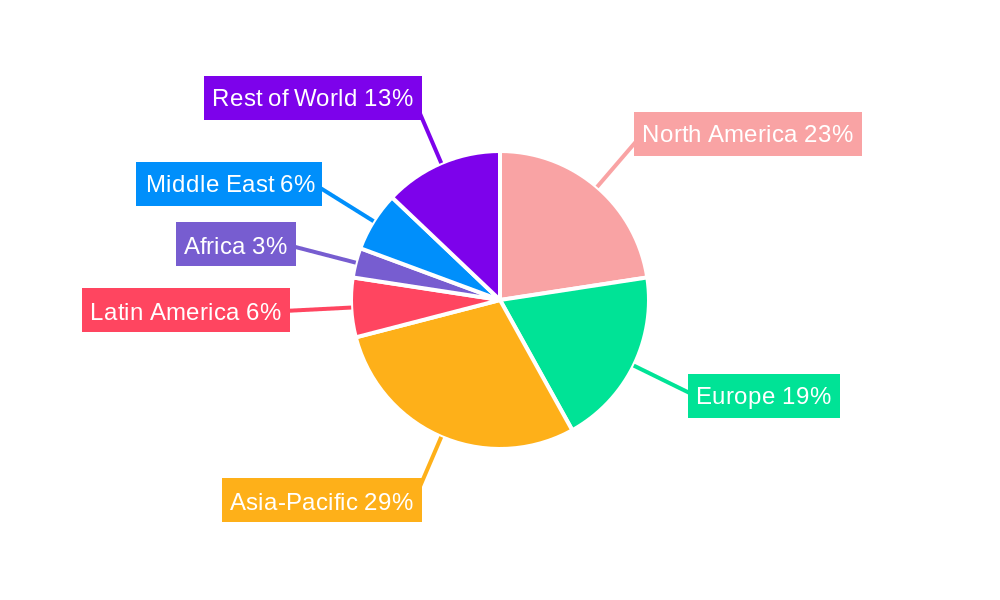
Geographically, North America and Asia-Pacific lead market expansion, driven by high technology adoption and significant consumer bases. Emerging markets in Africa and Latin America present substantial untapped opportunities. The market is segmented by service type (mobile, fixed-line, broadband), technology (4G, 5G, fiber optics), and user segment (residential, enterprise). Strategic initiatives such as mergers, acquisitions, and alliances, alongside continuous technological innovation, define the competitive landscape. Future market trajectory will be shaped by ongoing infrastructure modernization and the progression to 5G and subsequent technologies. Sustained profitability will depend on efficient cost management, strategic collaborations, and the effective utilization of data analytics for personalized services and enhanced customer loyalty.
Telecommunication Services Company Market Share
Telecommunication Services Market Report: 2019-2033
This comprehensive report provides a detailed analysis of the global telecommunication services market, encompassing historical data (2019-2024), current estimates (2025), and future forecasts (2025-2033). The study delves into market dynamics, growth trends, regional dominance, product landscape, key players, and emerging opportunities within the parent market of telecommunications and its child markets, such as mobile and fixed-line services, broadband internet, and cloud-based communication solutions. The report is invaluable for industry professionals, investors, and strategic decision-makers seeking to understand and capitalize on the evolving landscape of the telecommunications sector. Market values are presented in million units.
Telecommunication Services Market Dynamics & Structure
The global telecommunication services market is characterized by high competition, significant technological innovation, and evolving regulatory frameworks. Market concentration is moderately high, with a few dominant players commanding substantial market share. However, the increasing adoption of disruptive technologies and the rise of new entrants are reshaping the competitive landscape. The market is driven by a growing demand for high-speed internet, mobile data, and cloud-based services, fueled by increasing smartphone penetration and the rise of the digital economy. Mergers and acquisitions (M&A) activities are frequent, signifying the ongoing consolidation and expansion strategies within the industry.
- Market Concentration: The top 5 players account for approximately xx% of the global market share in 2025 (Estimated).
- Technological Innovation: 5G deployment, fiber optic expansion, and the growing adoption of cloud-based solutions are primary drivers.
- Regulatory Frameworks: Government policies regarding spectrum allocation, infrastructure investment, and data privacy significantly impact market growth.
- Competitive Product Substitutes: Over-the-top (OTT) communication services pose a significant competitive threat to traditional telecom providers.
- End-User Demographics: The increasing penetration of smartphones and internet access across various demographics fuels market growth.
- M&A Trends: An average of xx M&A deals valued at approximately $xx billion were recorded annually during the historical period (2019-2024). The forecast period is expected to see a similar trend with xx deals per year.
Telecommunication Services Growth Trends & Insights
The global telecommunication services market has witnessed robust growth over the historical period, with a CAGR of xx% from 2019 to 2024. This growth is projected to continue at a CAGR of xx% from 2025 to 2033, reaching a market size of $xx billion by 2033. This expansion is driven by several factors, including increasing mobile and broadband penetration, rising demand for data-intensive services, and ongoing technological advancements. The market penetration rate for mobile broadband is expected to reach xx% by 2033, indicating significant untapped potential. Consumer behavior shifts towards greater digital engagement and reliance on connected devices continue to drive demand. The adoption of 5G technology is poised to accelerate growth further, enabling new applications and services. Technological disruptions, including the emergence of IoT and edge computing, are reshaping the market dynamics and creating new opportunities.
Dominant Regions, Countries, or Segments in Telecommunication Services
North America and Asia-Pacific are the leading regions in the global telecommunication services market, holding the largest market share. North America benefits from robust infrastructure and high consumer spending. Asia-Pacific's growth is propelled by rapid urbanization, rising disposable incomes, and expanding smartphone penetration.
- North America: Strong regulatory environment, advanced infrastructure, high technological adoption.
- Asia-Pacific: Rapidly growing population, rising smartphone penetration, increasing internet usage.
- Europe: Mature market with relatively high penetration rates but with continued growth driven by technological upgrades.
These regions exhibit significant market share and substantial growth potential due to the factors listed above. Specific countries like the United States, China, India, and Japan are key contributors to this regional growth, showcasing strong market size and high CAGR projections.
Telecommunication Services Product Landscape
The telecommunication services market offers a diverse range of products and services, including mobile voice and data services, fixed-line telephony, broadband internet access, cable television, and cloud-based communication solutions. Significant advancements in network infrastructure, particularly the deployment of 5G networks and fiber optics, are improving the speed, reliability, and capacity of these services. The integration of IoT devices and the development of new applications are further expanding the market's product landscape. Unique selling propositions include enhanced security features, personalized experiences, and customized service packages.
Key Drivers, Barriers & Challenges in Telecommunication Services
Key Drivers: Technological advancements (5G, fiber optics), increasing smartphone penetration, rising demand for data-intensive services, government initiatives promoting digital infrastructure.
Key Challenges: Intense competition from OTT providers, regulatory hurdles concerning spectrum allocation and data privacy, infrastructure limitations in developing regions, and the high cost of 5G network deployment, resulting in a slower than expected adoption rate in some regions and potentially affecting revenue by xx million in the next 3 years. Supply chain disruptions (estimated to impact revenue by approximately xx million in 2026) also pose a significant challenge.
Emerging Opportunities in Telecommunication Services
Emerging opportunities include the growth of the Internet of Things (IoT), the expansion of 5G networks, the increasing demand for cloud-based communication solutions, and the development of new applications and services in areas such as telehealth and smart cities. Untapped markets in developing economies also present significant opportunities. Evolving consumer preferences towards personalized and secure communication services are driving the development of innovative products and solutions.
Growth Accelerators in the Telecommunication Services Industry
Strategic partnerships, technological breakthroughs (e.g., advancements in AI and edge computing), and aggressive market expansion into underserved regions are accelerating the growth of the telecommunication services industry. Investments in infrastructure development and the implementation of innovative pricing strategies also contribute to the market's expansion. Further, government regulations favoring competition and investment in 5G networks significantly influence the sector's future trajectory.
Key Players Shaping the Telecommunication Services Market
Notable Milestones in Telecommunication Services Sector
- 2020: Increased investment in 5G network infrastructure by major players.
- 2021: Launch of several new cloud-based communication platforms.
- 2022: Significant M&A activity within the industry.
- 2023: Growing adoption of IoT devices and related services.
- 2024: Increased focus on cybersecurity and data privacy.
- 2025 (Estimated): Significant increase in 5G network penetration.
In-Depth Telecommunication Services Market Outlook
The telecommunication services market is poised for continued growth driven by ongoing technological advancements, increasing demand for data, and expansion into new markets. Strategic partnerships and investments in infrastructure development will play a crucial role in shaping future market dynamics. The focus on digital transformation, personalized services, and enhanced security will drive innovation and create exciting new opportunities for both established players and emerging entrants. The market is expected to experience robust growth, presenting lucrative investment prospects and strategic opportunities for companies seeking to expand their presence within the industry.
Telecommunication Services Segmentation
-
1. Application
- 1.1. Residential
- 1.2. Commercial
- 1.3. Government
-
2. Type
- 2.1. Basic Telecommunications Services
- 2.2. Value-added Telecommunications Services
Telecommunication Services Segmentation By Geography
-
1. North America
- 1.1. United States
- 1.2. Canada
- 1.3. Mexico
-
2. South America
- 2.1. Brazil
- 2.2. Argentina
- 2.3. Rest of South America
-
3. Europe
- 3.1. United Kingdom
- 3.2. Germany
- 3.3. France
- 3.4. Italy
- 3.5. Spain
- 3.6. Russia
- 3.7. Benelux
- 3.8. Nordics
- 3.9. Rest of Europe
-
4. Middle East & Africa
- 4.1. Turkey
- 4.2. Israel
- 4.3. GCC
- 4.4. North Africa
- 4.5. South Africa
- 4.6. Rest of Middle East & Africa
-
5. Asia Pacific
- 5.1. China
- 5.2. India
- 5.3. Japan
- 5.4. South Korea
- 5.5. ASEAN
- 5.6. Oceania
- 5.7. Rest of Asia Pacific
Telecommunication Services Regional Market Share
Geographic Coverage of Telecommunication Services
Telecommunication Services REPORT HIGHLIGHTS
| Aspects | Details |
|---|---|
| Study Period | 2020-2034 |
| Base Year | 2025 |
| Estimated Year | 2026 |
| Forecast Period | 2026-2034 |
| Historical Period | 2020-2025 |
| Growth Rate | CAGR of 5.23% from 2020-2034 |
| Segmentation |
|
Table of Contents
- 1. Introduction
- 1.1. Research Scope
- 1.2. Market Segmentation
- 1.3. Research Objective
- 1.4. Definitions and Assumptions
- 2. Executive Summary
- 2.1. Market Snapshot
- 3. Market Dynamics
- 3.1. Market Drivers
- 3.2. Market Restrains
- 3.3. Market Trends
- 3.4. Market Opportunities
- 4. Market Factor Analysis
- 4.1. Porters Five Forces
- 4.1.1. Bargaining Power of Suppliers
- 4.1.2. Bargaining Power of Buyers
- 4.1.3. Threat of New Entrants
- 4.1.4. Threat of Substitutes
- 4.1.5. Competitive Rivalry
- 4.2. PESTEL analysis
- 4.3. BCG Analysis
- 4.3.1. Stars (High Growth, High Market Share)
- 4.3.2. Cash Cows (Low Growth, High Market Share)
- 4.3.3. Question Mark (High Growth, Low Market Share)
- 4.3.4. Dogs (Low Growth, Low Market Share)
- 4.4. Ansoff Matrix Analysis
- 4.5. Supply Chain Analysis
- 4.6. Regulatory Landscape
- 4.7. Current Market Potential and Opportunity Assessment (TAM–SAM–SOM Framework)
- 4.8. IMR Analyst Note
- 4.1. Porters Five Forces
- 5. Market Analysis, Insights and Forecast 2021-2033
- 5.1. Market Analysis, Insights and Forecast - by Application
- 5.1.1. Residential
- 5.1.2. Commercial
- 5.1.3. Government
- 5.2. Market Analysis, Insights and Forecast - by Type
- 5.2.1. Basic Telecommunications Services
- 5.2.2. Value-added Telecommunications Services
- 5.3. Market Analysis, Insights and Forecast - by Region
- 5.3.1. North America
- 5.3.2. South America
- 5.3.3. Europe
- 5.3.4. Middle East & Africa
- 5.3.5. Asia Pacific
- 5.1. Market Analysis, Insights and Forecast - by Application
- 6. Global Telecommunication Services Analysis, Insights and Forecast, 2021-2033
- 6.1. Market Analysis, Insights and Forecast - by Application
- 6.1.1. Residential
- 6.1.2. Commercial
- 6.1.3. Government
- 6.2. Market Analysis, Insights and Forecast - by Type
- 6.2.1. Basic Telecommunications Services
- 6.2.2. Value-added Telecommunications Services
- 6.1. Market Analysis, Insights and Forecast - by Application
- 7. North America Telecommunication Services Analysis, Insights and Forecast, 2020-2032
- 7.1. Market Analysis, Insights and Forecast - by Application
- 7.1.1. Residential
- 7.1.2. Commercial
- 7.1.3. Government
- 7.2. Market Analysis, Insights and Forecast - by Type
- 7.2.1. Basic Telecommunications Services
- 7.2.2. Value-added Telecommunications Services
- 7.1. Market Analysis, Insights and Forecast - by Application
- 8. South America Telecommunication Services Analysis, Insights and Forecast, 2020-2032
- 8.1. Market Analysis, Insights and Forecast - by Application
- 8.1.1. Residential
- 8.1.2. Commercial
- 8.1.3. Government
- 8.2. Market Analysis, Insights and Forecast - by Type
- 8.2.1. Basic Telecommunications Services
- 8.2.2. Value-added Telecommunications Services
- 8.1. Market Analysis, Insights and Forecast - by Application
- 9. Europe Telecommunication Services Analysis, Insights and Forecast, 2020-2032
- 9.1. Market Analysis, Insights and Forecast - by Application
- 9.1.1. Residential
- 9.1.2. Commercial
- 9.1.3. Government
- 9.2. Market Analysis, Insights and Forecast - by Type
- 9.2.1. Basic Telecommunications Services
- 9.2.2. Value-added Telecommunications Services
- 9.1. Market Analysis, Insights and Forecast - by Application
- 10. Middle East & Africa Telecommunication Services Analysis, Insights and Forecast, 2020-2032
- 10.1. Market Analysis, Insights and Forecast - by Application
- 10.1.1. Residential
- 10.1.2. Commercial
- 10.1.3. Government
- 10.2. Market Analysis, Insights and Forecast - by Type
- 10.2.1. Basic Telecommunications Services
- 10.2.2. Value-added Telecommunications Services
- 10.1. Market Analysis, Insights and Forecast - by Application
- 11. Asia Pacific Telecommunication Services Analysis, Insights and Forecast, 2020-2032
- 11.1. Market Analysis, Insights and Forecast - by Application
- 11.1.1. Residential
- 11.1.2. Commercial
- 11.1.3. Government
- 11.2. Market Analysis, Insights and Forecast - by Type
- 11.2.1. Basic Telecommunications Services
- 11.2.2. Value-added Telecommunications Services
- 11.1. Market Analysis, Insights and Forecast - by Application
- 12. Competitive Analysis
- 12.1. Company Profiles
- 12.1.1 Virgin Media
- 12.1.1.1. Company Overview
- 12.1.1.2. Products
- 12.1.1.3. Company Financials
- 12.1.1.4. SWOT Analysis
- 12.1.2 Verizon Communications
- 12.1.2.1. Company Overview
- 12.1.2.2. Products
- 12.1.2.3. Company Financials
- 12.1.2.4. SWOT Analysis
- 12.1.3 Orange S.A
- 12.1.3.1. Company Overview
- 12.1.3.2. Products
- 12.1.3.3. Company Financials
- 12.1.3.4. SWOT Analysis
- 12.1.4 Telefonica SA
- 12.1.4.1. Company Overview
- 12.1.4.2. Products
- 12.1.4.3. Company Financials
- 12.1.4.4. SWOT Analysis
- 12.1.5 T-Mobile
- 12.1.5.1. Company Overview
- 12.1.5.2. Products
- 12.1.5.3. Company Financials
- 12.1.5.4. SWOT Analysis
- 12.1.6 Bharti Airtel
- 12.1.6.1. Company Overview
- 12.1.6.2. Products
- 12.1.6.3. Company Financials
- 12.1.6.4. SWOT Analysis
- 12.1.7 AT&T Inc
- 12.1.7.1. Company Overview
- 12.1.7.2. Products
- 12.1.7.3. Company Financials
- 12.1.7.4. SWOT Analysis
- 12.1.8 TalkTalk Telecom Group
- 12.1.8.1. Company Overview
- 12.1.8.2. Products
- 12.1.8.3. Company Financials
- 12.1.8.4. SWOT Analysis
- 12.1.9 Vodafone
- 12.1.9.1. Company Overview
- 12.1.9.2. Products
- 12.1.9.3. Company Financials
- 12.1.9.4. SWOT Analysis
- 12.1.10 Telus Communications
- 12.1.10.1. Company Overview
- 12.1.10.2. Products
- 12.1.10.3. Company Financials
- 12.1.10.4. SWOT Analysis
- 12.1.11 Telnet Belgium
- 12.1.11.1. Company Overview
- 12.1.11.2. Products
- 12.1.11.3. Company Financials
- 12.1.11.4. SWOT Analysis
- 12.1.12 Rogers Communications
- 12.1.12.1. Company Overview
- 12.1.12.2. Products
- 12.1.12.3. Company Financials
- 12.1.12.4. SWOT Analysis
- 12.1.13 BCE
- 12.1.13.1. Company Overview
- 12.1.13.2. Products
- 12.1.13.3. Company Financials
- 12.1.13.4. SWOT Analysis
- 12.1.14 China Mobile
- 12.1.14.1. Company Overview
- 12.1.14.2. Products
- 12.1.14.3. Company Financials
- 12.1.14.4. SWOT Analysis
- 12.1.15 China Unicom
- 12.1.15.1. Company Overview
- 12.1.15.2. Products
- 12.1.15.3. Company Financials
- 12.1.15.4. SWOT Analysis
- 12.1.16 China Telecom
- 12.1.16.1. Company Overview
- 12.1.16.2. Products
- 12.1.16.3. Company Financials
- 12.1.16.4. SWOT Analysis
- 12.1.1 Virgin Media
- 12.2. Market Entropy
- 12.2.1 Company's Key Areas Served
- 12.2.2 Recent Developments
- 12.3. Company Market Share Analysis 2025
- 12.3.1 Top 5 Companies Market Share Analysis
- 12.3.2 Top 3 Companies Market Share Analysis
- 12.4. List of Potential Customers
- 13. Research Methodology
List of Figures
- Figure 1: Global Telecommunication Services Revenue Breakdown (million, %) by Region 2025 & 2033
- Figure 2: North America Telecommunication Services Revenue (million), by Application 2025 & 2033
- Figure 3: North America Telecommunication Services Revenue Share (%), by Application 2025 & 2033
- Figure 4: North America Telecommunication Services Revenue (million), by Type 2025 & 2033
- Figure 5: North America Telecommunication Services Revenue Share (%), by Type 2025 & 2033
- Figure 6: North America Telecommunication Services Revenue (million), by Country 2025 & 2033
- Figure 7: North America Telecommunication Services Revenue Share (%), by Country 2025 & 2033
- Figure 8: South America Telecommunication Services Revenue (million), by Application 2025 & 2033
- Figure 9: South America Telecommunication Services Revenue Share (%), by Application 2025 & 2033
- Figure 10: South America Telecommunication Services Revenue (million), by Type 2025 & 2033
- Figure 11: South America Telecommunication Services Revenue Share (%), by Type 2025 & 2033
- Figure 12: South America Telecommunication Services Revenue (million), by Country 2025 & 2033
- Figure 13: South America Telecommunication Services Revenue Share (%), by Country 2025 & 2033
- Figure 14: Europe Telecommunication Services Revenue (million), by Application 2025 & 2033
- Figure 15: Europe Telecommunication Services Revenue Share (%), by Application 2025 & 2033
- Figure 16: Europe Telecommunication Services Revenue (million), by Type 2025 & 2033
- Figure 17: Europe Telecommunication Services Revenue Share (%), by Type 2025 & 2033
- Figure 18: Europe Telecommunication Services Revenue (million), by Country 2025 & 2033
- Figure 19: Europe Telecommunication Services Revenue Share (%), by Country 2025 & 2033
- Figure 20: Middle East & Africa Telecommunication Services Revenue (million), by Application 2025 & 2033
- Figure 21: Middle East & Africa Telecommunication Services Revenue Share (%), by Application 2025 & 2033
- Figure 22: Middle East & Africa Telecommunication Services Revenue (million), by Type 2025 & 2033
- Figure 23: Middle East & Africa Telecommunication Services Revenue Share (%), by Type 2025 & 2033
- Figure 24: Middle East & Africa Telecommunication Services Revenue (million), by Country 2025 & 2033
- Figure 25: Middle East & Africa Telecommunication Services Revenue Share (%), by Country 2025 & 2033
- Figure 26: Asia Pacific Telecommunication Services Revenue (million), by Application 2025 & 2033
- Figure 27: Asia Pacific Telecommunication Services Revenue Share (%), by Application 2025 & 2033
- Figure 28: Asia Pacific Telecommunication Services Revenue (million), by Type 2025 & 2033
- Figure 29: Asia Pacific Telecommunication Services Revenue Share (%), by Type 2025 & 2033
- Figure 30: Asia Pacific Telecommunication Services Revenue (million), by Country 2025 & 2033
- Figure 31: Asia Pacific Telecommunication Services Revenue Share (%), by Country 2025 & 2033
List of Tables
- Table 1: Global Telecommunication Services Revenue million Forecast, by Application 2020 & 2033
- Table 2: Global Telecommunication Services Revenue million Forecast, by Type 2020 & 2033
- Table 3: Global Telecommunication Services Revenue million Forecast, by Region 2020 & 2033
- Table 4: Global Telecommunication Services Revenue million Forecast, by Application 2020 & 2033
- Table 5: Global Telecommunication Services Revenue million Forecast, by Type 2020 & 2033
- Table 6: Global Telecommunication Services Revenue million Forecast, by Country 2020 & 2033
- Table 7: United States Telecommunication Services Revenue (million) Forecast, by Application 2020 & 2033
- Table 8: Canada Telecommunication Services Revenue (million) Forecast, by Application 2020 & 2033
- Table 9: Mexico Telecommunication Services Revenue (million) Forecast, by Application 2020 & 2033
- Table 10: Global Telecommunication Services Revenue million Forecast, by Application 2020 & 2033
- Table 11: Global Telecommunication Services Revenue million Forecast, by Type 2020 & 2033
- Table 12: Global Telecommunication Services Revenue million Forecast, by Country 2020 & 2033
- Table 13: Brazil Telecommunication Services Revenue (million) Forecast, by Application 2020 & 2033
- Table 14: Argentina Telecommunication Services Revenue (million) Forecast, by Application 2020 & 2033
- Table 15: Rest of South America Telecommunication Services Revenue (million) Forecast, by Application 2020 & 2033
- Table 16: Global Telecommunication Services Revenue million Forecast, by Application 2020 & 2033
- Table 17: Global Telecommunication Services Revenue million Forecast, by Type 2020 & 2033
- Table 18: Global Telecommunication Services Revenue million Forecast, by Country 2020 & 2033
- Table 19: United Kingdom Telecommunication Services Revenue (million) Forecast, by Application 2020 & 2033
- Table 20: Germany Telecommunication Services Revenue (million) Forecast, by Application 2020 & 2033
- Table 21: France Telecommunication Services Revenue (million) Forecast, by Application 2020 & 2033
- Table 22: Italy Telecommunication Services Revenue (million) Forecast, by Application 2020 & 2033
- Table 23: Spain Telecommunication Services Revenue (million) Forecast, by Application 2020 & 2033
- Table 24: Russia Telecommunication Services Revenue (million) Forecast, by Application 2020 & 2033
- Table 25: Benelux Telecommunication Services Revenue (million) Forecast, by Application 2020 & 2033
- Table 26: Nordics Telecommunication Services Revenue (million) Forecast, by Application 2020 & 2033
- Table 27: Rest of Europe Telecommunication Services Revenue (million) Forecast, by Application 2020 & 2033
- Table 28: Global Telecommunication Services Revenue million Forecast, by Application 2020 & 2033
- Table 29: Global Telecommunication Services Revenue million Forecast, by Type 2020 & 2033
- Table 30: Global Telecommunication Services Revenue million Forecast, by Country 2020 & 2033
- Table 31: Turkey Telecommunication Services Revenue (million) Forecast, by Application 2020 & 2033
- Table 32: Israel Telecommunication Services Revenue (million) Forecast, by Application 2020 & 2033
- Table 33: GCC Telecommunication Services Revenue (million) Forecast, by Application 2020 & 2033
- Table 34: North Africa Telecommunication Services Revenue (million) Forecast, by Application 2020 & 2033
- Table 35: South Africa Telecommunication Services Revenue (million) Forecast, by Application 2020 & 2033
- Table 36: Rest of Middle East & Africa Telecommunication Services Revenue (million) Forecast, by Application 2020 & 2033
- Table 37: Global Telecommunication Services Revenue million Forecast, by Application 2020 & 2033
- Table 38: Global Telecommunication Services Revenue million Forecast, by Type 2020 & 2033
- Table 39: Global Telecommunication Services Revenue million Forecast, by Country 2020 & 2033
- Table 40: China Telecommunication Services Revenue (million) Forecast, by Application 2020 & 2033
- Table 41: India Telecommunication Services Revenue (million) Forecast, by Application 2020 & 2033
- Table 42: Japan Telecommunication Services Revenue (million) Forecast, by Application 2020 & 2033
- Table 43: South Korea Telecommunication Services Revenue (million) Forecast, by Application 2020 & 2033
- Table 44: ASEAN Telecommunication Services Revenue (million) Forecast, by Application 2020 & 2033
- Table 45: Oceania Telecommunication Services Revenue (million) Forecast, by Application 2020 & 2033
- Table 46: Rest of Asia Pacific Telecommunication Services Revenue (million) Forecast, by Application 2020 & 2033
Frequently Asked Questions
1. What is the projected Compound Annual Growth Rate (CAGR) of the Telecommunication Services?
The projected CAGR is approximately 5.23%.
2. Which companies are prominent players in the Telecommunication Services?
Key companies in the market include Virgin Media, Verizon Communications, Orange S.A, Telefonica SA, T-Mobile, Bharti Airtel, AT&T Inc, TalkTalk Telecom Group, Vodafone, Telus Communications, Telnet Belgium, Rogers Communications, BCE, China Mobile, China Unicom, China Telecom.
3. What are the main segments of the Telecommunication Services?
The market segments include Application, Type.
4. Can you provide details about the market size?
The market size is estimated to be USD 2095716.3 million as of 2022.
5. What are some drivers contributing to market growth?
N/A
6. What are the notable trends driving market growth?
N/A
7. Are there any restraints impacting market growth?
N/A
8. Can you provide examples of recent developments in the market?
N/A
9. What pricing options are available for accessing the report?
Pricing options include single-user, multi-user, and enterprise licenses priced at USD 2900.00, USD 4350.00, and USD 5800.00 respectively.
10. Is the market size provided in terms of value or volume?
The market size is provided in terms of value, measured in million.
11. Are there any specific market keywords associated with the report?
Yes, the market keyword associated with the report is "Telecommunication Services," which aids in identifying and referencing the specific market segment covered.
12. How do I determine which pricing option suits my needs best?
The pricing options vary based on user requirements and access needs. Individual users may opt for single-user licenses, while businesses requiring broader access may choose multi-user or enterprise licenses for cost-effective access to the report.
13. Are there any additional resources or data provided in the Telecommunication Services report?
While the report offers comprehensive insights, it's advisable to review the specific contents or supplementary materials provided to ascertain if additional resources or data are available.
14. How can I stay updated on further developments or reports in the Telecommunication Services?
To stay informed about further developments, trends, and reports in the Telecommunication Services, consider subscribing to industry newsletters, following relevant companies and organizations, or regularly checking reputable industry news sources and publications.
Methodology
Step 1 - Identification of Relevant Samples Size from Population Database


Step 2 - Approaches for Defining Global Market Size (Value, Volume* & Price*)

Note*: In applicable scenarios
Step 3 - Data Sources
Primary Research
- Web Analytics
- Survey Reports
- Research Institute
- Latest Research Reports
- Opinion Leaders
Secondary Research
- Annual Reports
- White Paper
- Latest Press Release
- Industry Association
- Paid Database
- Investor Presentations

Step 4 - Data Triangulation
Involves using different sources of information in order to increase the validity of a study
These sources are likely to be stakeholders in a program - participants, other researchers, program staff, other community members, and so on.
Then we put all data in single framework & apply various statistical tools to find out the dynamic on the market.
During the analysis stage, feedback from the stakeholder groups would be compared to determine areas of agreement as well as areas of divergence