

Key Insights
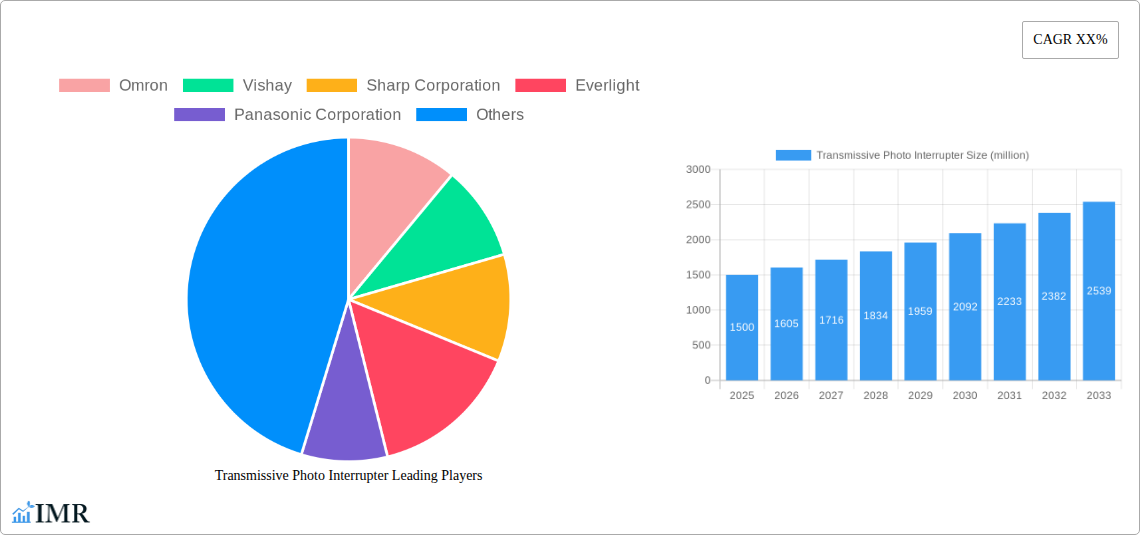
The transmissive photointerrupter market is experiencing robust growth, driven by increasing automation across diverse industries. The market, estimated at $1.5 billion in 2025, is projected to exhibit a Compound Annual Growth Rate (CAGR) of 7% from 2025 to 2033, reaching approximately $2.5 billion by 2033. This growth is fueled by the rising adoption of automation in manufacturing, automotive, consumer electronics, and healthcare sectors. Key trends shaping the market include the miniaturization of components, the integration of advanced features like higher sensitivity and faster response times, and the increasing demand for cost-effective solutions. Companies like Omron, Vishay, and Sharp Corporation are leading players, leveraging their technological expertise and established market presence to cater to the evolving needs of diverse applications. While rising raw material costs and potential supply chain disruptions pose challenges, the overall market outlook remains positive due to ongoing technological advancements and the sustained demand for automation across a wide spectrum of industries.
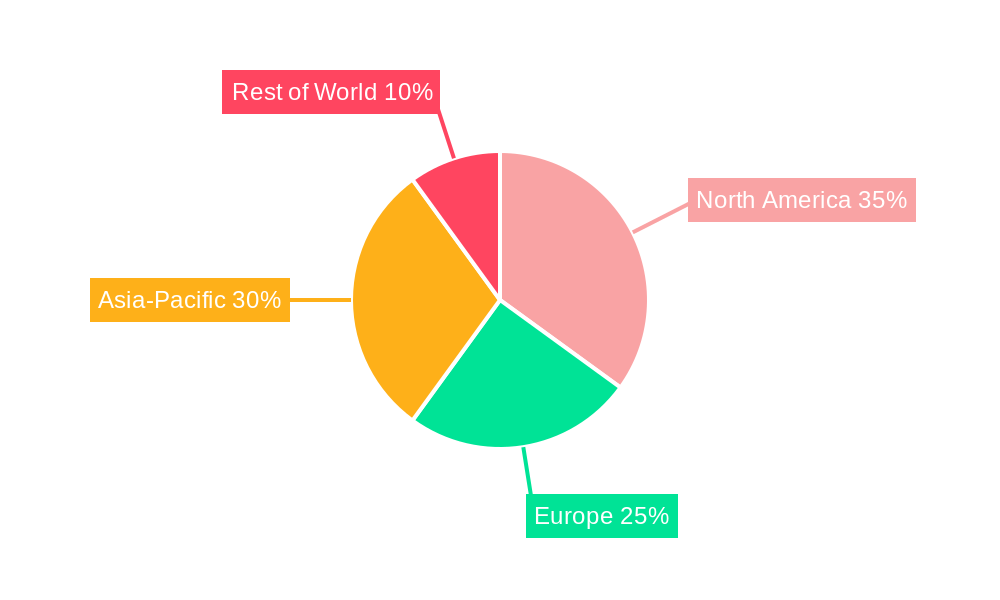
The competitive landscape is characterized by a mix of established players and emerging companies. The major players are investing heavily in research and development to improve the performance and functionalities of transmissive photointerrupters. This focus on innovation is enabling the development of more sophisticated devices that are capable of meeting the stringent requirements of various applications. Furthermore, strategic partnerships and acquisitions are becoming increasingly prevalent as companies seek to expand their market reach and product portfolios. Regional variations in market growth are expected, with North America and Asia-Pacific anticipated to be the major contributors, driven by strong industrialization and technological advancements in these regions. The market segmentation is largely influenced by application type, with significant demand from the automotive and industrial automation sectors.
Transmissive Photo Interrupter Market Report: 2019-2033
This comprehensive report provides an in-depth analysis of the global Transmissive Photo Interrupter market, encompassing market dynamics, growth trends, regional analysis, competitive landscape, and future outlook. The report covers the period 2019-2033, with a base year of 2025 and a forecast period of 2025-2033. This detailed study is crucial for industry professionals, investors, and strategic decision-makers seeking to understand and capitalize on opportunities within the rapidly evolving photoelectric sensor market. The parent market is the broader optoelectronics industry, and the child market is specific sensor applications within automation and consumer electronics.
Transmissive Photo Interrupter Market Dynamics & Structure
The global transmissive photo interrupter market is characterized by moderate concentration, with key players like Omron, Vishay, and Sharp Corporation holding significant market share. The market is driven by technological advancements in sensor miniaturization, improved sensitivity, and increased integration with microcontrollers. Stringent regulatory frameworks concerning safety and energy efficiency in various applications also influence market dynamics. Competitive substitutes include alternative sensing technologies such as ultrasonic and capacitive sensors. The end-user demographics are broad, spanning automotive, industrial automation, consumer electronics, and healthcare. The historical period (2019-2024) witnessed xx M&A deals, with an estimated xx% increase projected during the forecast period (2025-2033).
- Market Concentration: Moderately concentrated, with top 5 players holding approximately xx% market share in 2024.
- Technological Innovation: Miniaturization, improved sensitivity, and integrated microcontroller capabilities are key drivers.
- Regulatory Landscape: Safety and energy efficiency standards influence market growth and product design.
- Competitive Substitutes: Ultrasonic, capacitive, and inductive sensors pose competitive pressure.
- End-User Demographics: Automotive, industrial automation, consumer electronics, and healthcare are major end-use sectors.
- M&A Activity: xx M&A deals in 2019-2024, with a projected increase to xx deals during 2025-2033.
Transmissive Photo Interrupter Growth Trends & Insights
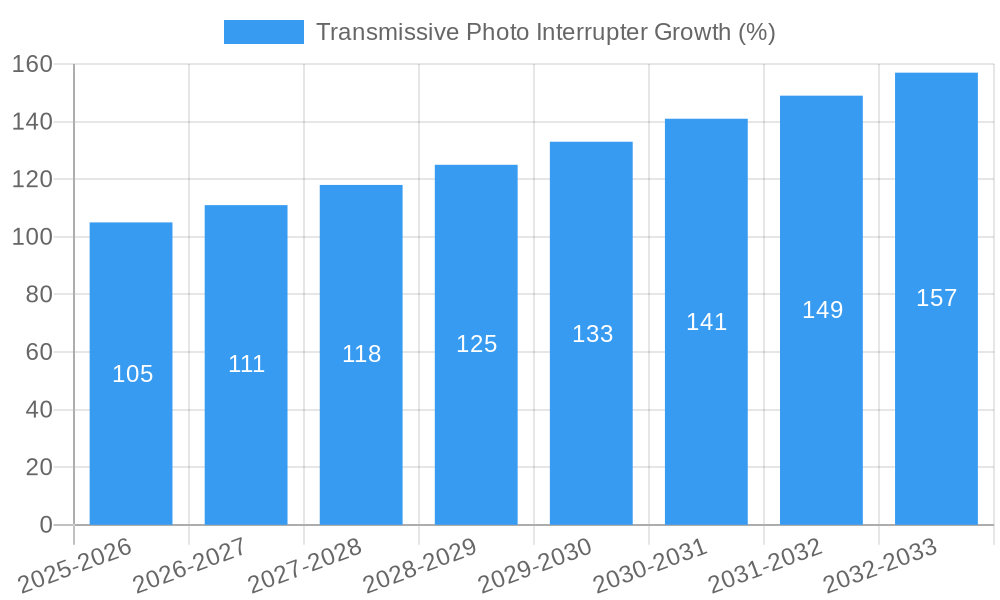
The global transmissive photo interrupter market exhibited a CAGR of xx% during 2019-2024, reaching a market size of xx million units in 2024. This growth is attributed to increasing automation across various industries and rising demand for advanced sensor technologies in consumer electronics. The adoption rate is projected to increase significantly due to the decreasing cost of sensors, coupled with enhanced performance and miniaturization. Technological disruptions, such as the development of high-precision, low-power consumption sensors, are driving market expansion. Consumer behavior shifts towards smart devices and automation are fueling market demand. The forecast period (2025-2033) projects a CAGR of xx%, reaching xx million units by 2033, with market penetration steadily increasing in emerging economies.
Dominant Regions, Countries, or Segments in Transmissive Photo Interrupter
Asia-Pacific is projected to be the dominant region in the transmissive photo interrupter market during the forecast period, driven by robust growth in the electronics manufacturing sector and expanding industrial automation in countries like China, Japan, and South Korea. North America and Europe will also witness significant growth, driven by demand from automotive and healthcare sectors.
- Key Drivers in Asia-Pacific: Rapid industrialization, rising automation investments, and a large consumer electronics market.
- Key Drivers in North America: Growing automotive production, increasing healthcare spending, and adoption of smart technologies.
- Key Drivers in Europe: Focus on automation in manufacturing and increased adoption of advanced sensor technologies.
- Market Share: Asia-Pacific is projected to hold xx% market share by 2033.
Transmissive Photo Interrupter Product Landscape
Transmissive photo interrupters are experiencing innovations in packaging size, enhanced sensitivity, and improved signal-to-noise ratios. Applications range from simple object detection in consumer electronics to sophisticated position sensing in industrial automation. Key performance metrics include switching speed, operating voltage, and response time. Unique selling propositions focus on miniaturization, cost-effectiveness, and enhanced reliability. Technological advancements center around improved light sources (e.g., LEDs) and higher-sensitivity phototransistors.
Key Drivers, Barriers & Challenges in Transmissive Photo Interrupter
Key Drivers: Increased automation across industries, growing demand for precise sensing solutions in consumer electronics, and ongoing technological advancements driving improved performance and lower costs.
Challenges and Restraints: Fluctuations in raw material prices, supply chain disruptions, and the emergence of alternative sensing technologies pose significant challenges. Regulatory compliance issues and potential trade barriers also impact market dynamics. For instance, supply chain disruptions in 2024 led to a xx% increase in sensor costs impacting xx million units of production.
Emerging Opportunities in Transmissive Photo Interrupter
Emerging opportunities lie in the integration of transmissive photo interrupters with IoT devices, development of high-precision sensors for advanced robotics, and expansion into untapped markets such as medical devices and smart agriculture. The growing demand for automation in the logistics industry also presents a significant opportunity.
Growth Accelerators in the Transmissive Photo Interrupter Industry
Strategic partnerships between sensor manufacturers and system integrators, combined with continuous technological breakthroughs in sensor design and manufacturing processes, are set to accelerate market growth. Market expansion into new applications and geographic regions will further contribute to sustained growth.
Key Players Shaping the Transmissive Photo Interrupter Market
- Omron
- Vishay
- Sharp Corporation
- Everlight
- Panasonic Corporation
- Broadcom
- Rohm Semiconductor
- TT Electronics
- Honeywell
- Nippon Aleph
- Kingbright
- Kodenshi
- Lite-On
- OncQue Corporation
- okayaelec
Notable Milestones in Transmissive Photo Interrupter Sector
- 2020, Q3: Omron launches a new line of high-precision photo interrupters for industrial automation.
- 2022, Q1: Vishay announces a strategic partnership with a major automotive manufacturer for sensor supply.
- 2023, Q4: Sharp Corporation unveils a miniaturized photo interrupter for consumer electronics applications.
- (Further milestones require additional data)
In-Depth Transmissive Photo Interrupter Market Outlook
The transmissive photo interrupter market is poised for robust growth driven by increasing automation and the adoption of advanced technologies across diverse industries. Strategic investments in R&D, expansion into new markets, and strategic partnerships will be crucial for sustained long-term growth. The market exhibits significant potential for innovation and expansion, offering compelling opportunities for key players and new entrants.
Transmissive Photo Interrupter Segmentation
-
1. Application
- 1.1. Automotive
- 1.2. Consumer Electronics
- 1.3. ATM
- 1.4. Medical Equipment
- 1.5. Robots
- 1.6. Other
-
2. Types
- 2.1. Surface Mount
- 2.2. Screw Mount
- 2.3. Through-Hole
Transmissive Photo Interrupter Segmentation By Geography
-
1. North America
- 1.1. United States
- 1.2. Canada
- 1.3. Mexico
-
2. South America
- 2.1. Brazil
- 2.2. Argentina
- 2.3. Rest of South America
-
3. Europe
- 3.1. United Kingdom
- 3.2. Germany
- 3.3. France
- 3.4. Italy
- 3.5. Spain
- 3.6. Russia
- 3.7. Benelux
- 3.8. Nordics
- 3.9. Rest of Europe
-
4. Middle East & Africa
- 4.1. Turkey
- 4.2. Israel
- 4.3. GCC
- 4.4. North Africa
- 4.5. South Africa
- 4.6. Rest of Middle East & Africa
-
5. Asia Pacific
- 5.1. China
- 5.2. India
- 5.3. Japan
- 5.4. South Korea
- 5.5. ASEAN
- 5.6. Oceania
- 5.7. Rest of Asia Pacific
Transmissive Photo Interrupter REPORT HIGHLIGHTS
| Aspects | Details |
|---|---|
| Study Period | 2019-2033 |
| Base Year | 2024 |
| Estimated Year | 2025 |
| Forecast Period | 2025-2033 |
| Historical Period | 2019-2024 |
| Growth Rate | CAGR of XX% from 2019-2033 |
| Segmentation |
|
Table of Contents
- 1. Introduction
- 1.1. Research Scope
- 1.2. Market Segmentation
- 1.3. Research Methodology
- 1.4. Definitions and Assumptions
- 2. Executive Summary
- 2.1. Introduction
- 3. Market Dynamics
- 3.1. Introduction
- 3.2. Market Drivers
- 3.3. Market Restrains
- 3.4. Market Trends
- 4. Market Factor Analysis
- 4.1. Porters Five Forces
- 4.2. Supply/Value Chain
- 4.3. PESTEL analysis
- 4.4. Market Entropy
- 4.5. Patent/Trademark Analysis
- 5. Global Transmissive Photo Interrupter Analysis, Insights and Forecast, 2019-2031
- 5.1. Market Analysis, Insights and Forecast - by Application
- 5.1.1. Automotive
- 5.1.2. Consumer Electronics
- 5.1.3. ATM
- 5.1.4. Medical Equipment
- 5.1.5. Robots
- 5.1.6. Other
- 5.2. Market Analysis, Insights and Forecast - by Types
- 5.2.1. Surface Mount
- 5.2.2. Screw Mount
- 5.2.3. Through-Hole
- 5.3. Market Analysis, Insights and Forecast - by Region
- 5.3.1. North America
- 5.3.2. South America
- 5.3.3. Europe
- 5.3.4. Middle East & Africa
- 5.3.5. Asia Pacific
- 5.1. Market Analysis, Insights and Forecast - by Application
- 6. North America Transmissive Photo Interrupter Analysis, Insights and Forecast, 2019-2031
- 6.1. Market Analysis, Insights and Forecast - by Application
- 6.1.1. Automotive
- 6.1.2. Consumer Electronics
- 6.1.3. ATM
- 6.1.4. Medical Equipment
- 6.1.5. Robots
- 6.1.6. Other
- 6.2. Market Analysis, Insights and Forecast - by Types
- 6.2.1. Surface Mount
- 6.2.2. Screw Mount
- 6.2.3. Through-Hole
- 6.1. Market Analysis, Insights and Forecast - by Application
- 7. South America Transmissive Photo Interrupter Analysis, Insights and Forecast, 2019-2031
- 7.1. Market Analysis, Insights and Forecast - by Application
- 7.1.1. Automotive
- 7.1.2. Consumer Electronics
- 7.1.3. ATM
- 7.1.4. Medical Equipment
- 7.1.5. Robots
- 7.1.6. Other
- 7.2. Market Analysis, Insights and Forecast - by Types
- 7.2.1. Surface Mount
- 7.2.2. Screw Mount
- 7.2.3. Through-Hole
- 7.1. Market Analysis, Insights and Forecast - by Application
- 8. Europe Transmissive Photo Interrupter Analysis, Insights and Forecast, 2019-2031
- 8.1. Market Analysis, Insights and Forecast - by Application
- 8.1.1. Automotive
- 8.1.2. Consumer Electronics
- 8.1.3. ATM
- 8.1.4. Medical Equipment
- 8.1.5. Robots
- 8.1.6. Other
- 8.2. Market Analysis, Insights and Forecast - by Types
- 8.2.1. Surface Mount
- 8.2.2. Screw Mount
- 8.2.3. Through-Hole
- 8.1. Market Analysis, Insights and Forecast - by Application
- 9. Middle East & Africa Transmissive Photo Interrupter Analysis, Insights and Forecast, 2019-2031
- 9.1. Market Analysis, Insights and Forecast - by Application
- 9.1.1. Automotive
- 9.1.2. Consumer Electronics
- 9.1.3. ATM
- 9.1.4. Medical Equipment
- 9.1.5. Robots
- 9.1.6. Other
- 9.2. Market Analysis, Insights and Forecast - by Types
- 9.2.1. Surface Mount
- 9.2.2. Screw Mount
- 9.2.3. Through-Hole
- 9.1. Market Analysis, Insights and Forecast - by Application
- 10. Asia Pacific Transmissive Photo Interrupter Analysis, Insights and Forecast, 2019-2031
- 10.1. Market Analysis, Insights and Forecast - by Application
- 10.1.1. Automotive
- 10.1.2. Consumer Electronics
- 10.1.3. ATM
- 10.1.4. Medical Equipment
- 10.1.5. Robots
- 10.1.6. Other
- 10.2. Market Analysis, Insights and Forecast - by Types
- 10.2.1. Surface Mount
- 10.2.2. Screw Mount
- 10.2.3. Through-Hole
- 10.1. Market Analysis, Insights and Forecast - by Application
- 11. Competitive Analysis
- 11.1. Global Market Share Analysis 2024
- 11.2. Company Profiles
- 11.2.1 Omron
- 11.2.1.1. Overview
- 11.2.1.2. Products
- 11.2.1.3. SWOT Analysis
- 11.2.1.4. Recent Developments
- 11.2.1.5. Financials (Based on Availability)
- 11.2.2 Vishay
- 11.2.2.1. Overview
- 11.2.2.2. Products
- 11.2.2.3. SWOT Analysis
- 11.2.2.4. Recent Developments
- 11.2.2.5. Financials (Based on Availability)
- 11.2.3 Sharp Corporation
- 11.2.3.1. Overview
- 11.2.3.2. Products
- 11.2.3.3. SWOT Analysis
- 11.2.3.4. Recent Developments
- 11.2.3.5. Financials (Based on Availability)
- 11.2.4 Everlight
- 11.2.4.1. Overview
- 11.2.4.2. Products
- 11.2.4.3. SWOT Analysis
- 11.2.4.4. Recent Developments
- 11.2.4.5. Financials (Based on Availability)
- 11.2.5 Panasonic Corporation
- 11.2.5.1. Overview
- 11.2.5.2. Products
- 11.2.5.3. SWOT Analysis
- 11.2.5.4. Recent Developments
- 11.2.5.5. Financials (Based on Availability)
- 11.2.6 Broadcom
- 11.2.6.1. Overview
- 11.2.6.2. Products
- 11.2.6.3. SWOT Analysis
- 11.2.6.4. Recent Developments
- 11.2.6.5. Financials (Based on Availability)
- 11.2.7 Rohm Semiconductor
- 11.2.7.1. Overview
- 11.2.7.2. Products
- 11.2.7.3. SWOT Analysis
- 11.2.7.4. Recent Developments
- 11.2.7.5. Financials (Based on Availability)
- 11.2.8 TT Electronics
- 11.2.8.1. Overview
- 11.2.8.2. Products
- 11.2.8.3. SWOT Analysis
- 11.2.8.4. Recent Developments
- 11.2.8.5. Financials (Based on Availability)
- 11.2.9 Honeywell
- 11.2.9.1. Overview
- 11.2.9.2. Products
- 11.2.9.3. SWOT Analysis
- 11.2.9.4. Recent Developments
- 11.2.9.5. Financials (Based on Availability)
- 11.2.10 Nippon Aleph
- 11.2.10.1. Overview
- 11.2.10.2. Products
- 11.2.10.3. SWOT Analysis
- 11.2.10.4. Recent Developments
- 11.2.10.5. Financials (Based on Availability)
- 11.2.11 Kingbright
- 11.2.11.1. Overview
- 11.2.11.2. Products
- 11.2.11.3. SWOT Analysis
- 11.2.11.4. Recent Developments
- 11.2.11.5. Financials (Based on Availability)
- 11.2.12 Kodenshi
- 11.2.12.1. Overview
- 11.2.12.2. Products
- 11.2.12.3. SWOT Analysis
- 11.2.12.4. Recent Developments
- 11.2.12.5. Financials (Based on Availability)
- 11.2.13 Lite-On
- 11.2.13.1. Overview
- 11.2.13.2. Products
- 11.2.13.3. SWOT Analysis
- 11.2.13.4. Recent Developments
- 11.2.13.5. Financials (Based on Availability)
- 11.2.14 OncQue Corporation
- 11.2.14.1. Overview
- 11.2.14.2. Products
- 11.2.14.3. SWOT Analysis
- 11.2.14.4. Recent Developments
- 11.2.14.5. Financials (Based on Availability)
- 11.2.15 okayaelec
- 11.2.15.1. Overview
- 11.2.15.2. Products
- 11.2.15.3. SWOT Analysis
- 11.2.15.4. Recent Developments
- 11.2.15.5. Financials (Based on Availability)
- 11.2.1 Omron
List of Figures
- Figure 1: Global Transmissive Photo Interrupter Revenue Breakdown (million, %) by Region 2024 & 2032
- Figure 2: Global Transmissive Photo Interrupter Volume Breakdown (K, %) by Region 2024 & 2032
- Figure 3: North America Transmissive Photo Interrupter Revenue (million), by Application 2024 & 2032
- Figure 4: North America Transmissive Photo Interrupter Volume (K), by Application 2024 & 2032
- Figure 5: North America Transmissive Photo Interrupter Revenue Share (%), by Application 2024 & 2032
- Figure 6: North America Transmissive Photo Interrupter Volume Share (%), by Application 2024 & 2032
- Figure 7: North America Transmissive Photo Interrupter Revenue (million), by Types 2024 & 2032
- Figure 8: North America Transmissive Photo Interrupter Volume (K), by Types 2024 & 2032
- Figure 9: North America Transmissive Photo Interrupter Revenue Share (%), by Types 2024 & 2032
- Figure 10: North America Transmissive Photo Interrupter Volume Share (%), by Types 2024 & 2032
- Figure 11: North America Transmissive Photo Interrupter Revenue (million), by Country 2024 & 2032
- Figure 12: North America Transmissive Photo Interrupter Volume (K), by Country 2024 & 2032
- Figure 13: North America Transmissive Photo Interrupter Revenue Share (%), by Country 2024 & 2032
- Figure 14: North America Transmissive Photo Interrupter Volume Share (%), by Country 2024 & 2032
- Figure 15: South America Transmissive Photo Interrupter Revenue (million), by Application 2024 & 2032
- Figure 16: South America Transmissive Photo Interrupter Volume (K), by Application 2024 & 2032
- Figure 17: South America Transmissive Photo Interrupter Revenue Share (%), by Application 2024 & 2032
- Figure 18: South America Transmissive Photo Interrupter Volume Share (%), by Application 2024 & 2032
- Figure 19: South America Transmissive Photo Interrupter Revenue (million), by Types 2024 & 2032
- Figure 20: South America Transmissive Photo Interrupter Volume (K), by Types 2024 & 2032
- Figure 21: South America Transmissive Photo Interrupter Revenue Share (%), by Types 2024 & 2032
- Figure 22: South America Transmissive Photo Interrupter Volume Share (%), by Types 2024 & 2032
- Figure 23: South America Transmissive Photo Interrupter Revenue (million), by Country 2024 & 2032
- Figure 24: South America Transmissive Photo Interrupter Volume (K), by Country 2024 & 2032
- Figure 25: South America Transmissive Photo Interrupter Revenue Share (%), by Country 2024 & 2032
- Figure 26: South America Transmissive Photo Interrupter Volume Share (%), by Country 2024 & 2032
- Figure 27: Europe Transmissive Photo Interrupter Revenue (million), by Application 2024 & 2032
- Figure 28: Europe Transmissive Photo Interrupter Volume (K), by Application 2024 & 2032
- Figure 29: Europe Transmissive Photo Interrupter Revenue Share (%), by Application 2024 & 2032
- Figure 30: Europe Transmissive Photo Interrupter Volume Share (%), by Application 2024 & 2032
- Figure 31: Europe Transmissive Photo Interrupter Revenue (million), by Types 2024 & 2032
- Figure 32: Europe Transmissive Photo Interrupter Volume (K), by Types 2024 & 2032
- Figure 33: Europe Transmissive Photo Interrupter Revenue Share (%), by Types 2024 & 2032
- Figure 34: Europe Transmissive Photo Interrupter Volume Share (%), by Types 2024 & 2032
- Figure 35: Europe Transmissive Photo Interrupter Revenue (million), by Country 2024 & 2032
- Figure 36: Europe Transmissive Photo Interrupter Volume (K), by Country 2024 & 2032
- Figure 37: Europe Transmissive Photo Interrupter Revenue Share (%), by Country 2024 & 2032
- Figure 38: Europe Transmissive Photo Interrupter Volume Share (%), by Country 2024 & 2032
- Figure 39: Middle East & Africa Transmissive Photo Interrupter Revenue (million), by Application 2024 & 2032
- Figure 40: Middle East & Africa Transmissive Photo Interrupter Volume (K), by Application 2024 & 2032
- Figure 41: Middle East & Africa Transmissive Photo Interrupter Revenue Share (%), by Application 2024 & 2032
- Figure 42: Middle East & Africa Transmissive Photo Interrupter Volume Share (%), by Application 2024 & 2032
- Figure 43: Middle East & Africa Transmissive Photo Interrupter Revenue (million), by Types 2024 & 2032
- Figure 44: Middle East & Africa Transmissive Photo Interrupter Volume (K), by Types 2024 & 2032
- Figure 45: Middle East & Africa Transmissive Photo Interrupter Revenue Share (%), by Types 2024 & 2032
- Figure 46: Middle East & Africa Transmissive Photo Interrupter Volume Share (%), by Types 2024 & 2032
- Figure 47: Middle East & Africa Transmissive Photo Interrupter Revenue (million), by Country 2024 & 2032
- Figure 48: Middle East & Africa Transmissive Photo Interrupter Volume (K), by Country 2024 & 2032
- Figure 49: Middle East & Africa Transmissive Photo Interrupter Revenue Share (%), by Country 2024 & 2032
- Figure 50: Middle East & Africa Transmissive Photo Interrupter Volume Share (%), by Country 2024 & 2032
- Figure 51: Asia Pacific Transmissive Photo Interrupter Revenue (million), by Application 2024 & 2032
- Figure 52: Asia Pacific Transmissive Photo Interrupter Volume (K), by Application 2024 & 2032
- Figure 53: Asia Pacific Transmissive Photo Interrupter Revenue Share (%), by Application 2024 & 2032
- Figure 54: Asia Pacific Transmissive Photo Interrupter Volume Share (%), by Application 2024 & 2032
- Figure 55: Asia Pacific Transmissive Photo Interrupter Revenue (million), by Types 2024 & 2032
- Figure 56: Asia Pacific Transmissive Photo Interrupter Volume (K), by Types 2024 & 2032
- Figure 57: Asia Pacific Transmissive Photo Interrupter Revenue Share (%), by Types 2024 & 2032
- Figure 58: Asia Pacific Transmissive Photo Interrupter Volume Share (%), by Types 2024 & 2032
- Figure 59: Asia Pacific Transmissive Photo Interrupter Revenue (million), by Country 2024 & 2032
- Figure 60: Asia Pacific Transmissive Photo Interrupter Volume (K), by Country 2024 & 2032
- Figure 61: Asia Pacific Transmissive Photo Interrupter Revenue Share (%), by Country 2024 & 2032
- Figure 62: Asia Pacific Transmissive Photo Interrupter Volume Share (%), by Country 2024 & 2032
List of Tables
- Table 1: Global Transmissive Photo Interrupter Revenue million Forecast, by Region 2019 & 2032
- Table 2: Global Transmissive Photo Interrupter Volume K Forecast, by Region 2019 & 2032
- Table 3: Global Transmissive Photo Interrupter Revenue million Forecast, by Application 2019 & 2032
- Table 4: Global Transmissive Photo Interrupter Volume K Forecast, by Application 2019 & 2032
- Table 5: Global Transmissive Photo Interrupter Revenue million Forecast, by Types 2019 & 2032
- Table 6: Global Transmissive Photo Interrupter Volume K Forecast, by Types 2019 & 2032
- Table 7: Global Transmissive Photo Interrupter Revenue million Forecast, by Region 2019 & 2032
- Table 8: Global Transmissive Photo Interrupter Volume K Forecast, by Region 2019 & 2032
- Table 9: Global Transmissive Photo Interrupter Revenue million Forecast, by Application 2019 & 2032
- Table 10: Global Transmissive Photo Interrupter Volume K Forecast, by Application 2019 & 2032
- Table 11: Global Transmissive Photo Interrupter Revenue million Forecast, by Types 2019 & 2032
- Table 12: Global Transmissive Photo Interrupter Volume K Forecast, by Types 2019 & 2032
- Table 13: Global Transmissive Photo Interrupter Revenue million Forecast, by Country 2019 & 2032
- Table 14: Global Transmissive Photo Interrupter Volume K Forecast, by Country 2019 & 2032
- Table 15: United States Transmissive Photo Interrupter Revenue (million) Forecast, by Application 2019 & 2032
- Table 16: United States Transmissive Photo Interrupter Volume (K) Forecast, by Application 2019 & 2032
- Table 17: Canada Transmissive Photo Interrupter Revenue (million) Forecast, by Application 2019 & 2032
- Table 18: Canada Transmissive Photo Interrupter Volume (K) Forecast, by Application 2019 & 2032
- Table 19: Mexico Transmissive Photo Interrupter Revenue (million) Forecast, by Application 2019 & 2032
- Table 20: Mexico Transmissive Photo Interrupter Volume (K) Forecast, by Application 2019 & 2032
- Table 21: Global Transmissive Photo Interrupter Revenue million Forecast, by Application 2019 & 2032
- Table 22: Global Transmissive Photo Interrupter Volume K Forecast, by Application 2019 & 2032
- Table 23: Global Transmissive Photo Interrupter Revenue million Forecast, by Types 2019 & 2032
- Table 24: Global Transmissive Photo Interrupter Volume K Forecast, by Types 2019 & 2032
- Table 25: Global Transmissive Photo Interrupter Revenue million Forecast, by Country 2019 & 2032
- Table 26: Global Transmissive Photo Interrupter Volume K Forecast, by Country 2019 & 2032
- Table 27: Brazil Transmissive Photo Interrupter Revenue (million) Forecast, by Application 2019 & 2032
- Table 28: Brazil Transmissive Photo Interrupter Volume (K) Forecast, by Application 2019 & 2032
- Table 29: Argentina Transmissive Photo Interrupter Revenue (million) Forecast, by Application 2019 & 2032
- Table 30: Argentina Transmissive Photo Interrupter Volume (K) Forecast, by Application 2019 & 2032
- Table 31: Rest of South America Transmissive Photo Interrupter Revenue (million) Forecast, by Application 2019 & 2032
- Table 32: Rest of South America Transmissive Photo Interrupter Volume (K) Forecast, by Application 2019 & 2032
- Table 33: Global Transmissive Photo Interrupter Revenue million Forecast, by Application 2019 & 2032
- Table 34: Global Transmissive Photo Interrupter Volume K Forecast, by Application 2019 & 2032
- Table 35: Global Transmissive Photo Interrupter Revenue million Forecast, by Types 2019 & 2032
- Table 36: Global Transmissive Photo Interrupter Volume K Forecast, by Types 2019 & 2032
- Table 37: Global Transmissive Photo Interrupter Revenue million Forecast, by Country 2019 & 2032
- Table 38: Global Transmissive Photo Interrupter Volume K Forecast, by Country 2019 & 2032
- Table 39: United Kingdom Transmissive Photo Interrupter Revenue (million) Forecast, by Application 2019 & 2032
- Table 40: United Kingdom Transmissive Photo Interrupter Volume (K) Forecast, by Application 2019 & 2032
- Table 41: Germany Transmissive Photo Interrupter Revenue (million) Forecast, by Application 2019 & 2032
- Table 42: Germany Transmissive Photo Interrupter Volume (K) Forecast, by Application 2019 & 2032
- Table 43: France Transmissive Photo Interrupter Revenue (million) Forecast, by Application 2019 & 2032
- Table 44: France Transmissive Photo Interrupter Volume (K) Forecast, by Application 2019 & 2032
- Table 45: Italy Transmissive Photo Interrupter Revenue (million) Forecast, by Application 2019 & 2032
- Table 46: Italy Transmissive Photo Interrupter Volume (K) Forecast, by Application 2019 & 2032
- Table 47: Spain Transmissive Photo Interrupter Revenue (million) Forecast, by Application 2019 & 2032
- Table 48: Spain Transmissive Photo Interrupter Volume (K) Forecast, by Application 2019 & 2032
- Table 49: Russia Transmissive Photo Interrupter Revenue (million) Forecast, by Application 2019 & 2032
- Table 50: Russia Transmissive Photo Interrupter Volume (K) Forecast, by Application 2019 & 2032
- Table 51: Benelux Transmissive Photo Interrupter Revenue (million) Forecast, by Application 2019 & 2032
- Table 52: Benelux Transmissive Photo Interrupter Volume (K) Forecast, by Application 2019 & 2032
- Table 53: Nordics Transmissive Photo Interrupter Revenue (million) Forecast, by Application 2019 & 2032
- Table 54: Nordics Transmissive Photo Interrupter Volume (K) Forecast, by Application 2019 & 2032
- Table 55: Rest of Europe Transmissive Photo Interrupter Revenue (million) Forecast, by Application 2019 & 2032
- Table 56: Rest of Europe Transmissive Photo Interrupter Volume (K) Forecast, by Application 2019 & 2032
- Table 57: Global Transmissive Photo Interrupter Revenue million Forecast, by Application 2019 & 2032
- Table 58: Global Transmissive Photo Interrupter Volume K Forecast, by Application 2019 & 2032
- Table 59: Global Transmissive Photo Interrupter Revenue million Forecast, by Types 2019 & 2032
- Table 60: Global Transmissive Photo Interrupter Volume K Forecast, by Types 2019 & 2032
- Table 61: Global Transmissive Photo Interrupter Revenue million Forecast, by Country 2019 & 2032
- Table 62: Global Transmissive Photo Interrupter Volume K Forecast, by Country 2019 & 2032
- Table 63: Turkey Transmissive Photo Interrupter Revenue (million) Forecast, by Application 2019 & 2032
- Table 64: Turkey Transmissive Photo Interrupter Volume (K) Forecast, by Application 2019 & 2032
- Table 65: Israel Transmissive Photo Interrupter Revenue (million) Forecast, by Application 2019 & 2032
- Table 66: Israel Transmissive Photo Interrupter Volume (K) Forecast, by Application 2019 & 2032
- Table 67: GCC Transmissive Photo Interrupter Revenue (million) Forecast, by Application 2019 & 2032
- Table 68: GCC Transmissive Photo Interrupter Volume (K) Forecast, by Application 2019 & 2032
- Table 69: North Africa Transmissive Photo Interrupter Revenue (million) Forecast, by Application 2019 & 2032
- Table 70: North Africa Transmissive Photo Interrupter Volume (K) Forecast, by Application 2019 & 2032
- Table 71: South Africa Transmissive Photo Interrupter Revenue (million) Forecast, by Application 2019 & 2032
- Table 72: South Africa Transmissive Photo Interrupter Volume (K) Forecast, by Application 2019 & 2032
- Table 73: Rest of Middle East & Africa Transmissive Photo Interrupter Revenue (million) Forecast, by Application 2019 & 2032
- Table 74: Rest of Middle East & Africa Transmissive Photo Interrupter Volume (K) Forecast, by Application 2019 & 2032
- Table 75: Global Transmissive Photo Interrupter Revenue million Forecast, by Application 2019 & 2032
- Table 76: Global Transmissive Photo Interrupter Volume K Forecast, by Application 2019 & 2032
- Table 77: Global Transmissive Photo Interrupter Revenue million Forecast, by Types 2019 & 2032
- Table 78: Global Transmissive Photo Interrupter Volume K Forecast, by Types 2019 & 2032
- Table 79: Global Transmissive Photo Interrupter Revenue million Forecast, by Country 2019 & 2032
- Table 80: Global Transmissive Photo Interrupter Volume K Forecast, by Country 2019 & 2032
- Table 81: China Transmissive Photo Interrupter Revenue (million) Forecast, by Application 2019 & 2032
- Table 82: China Transmissive Photo Interrupter Volume (K) Forecast, by Application 2019 & 2032
- Table 83: India Transmissive Photo Interrupter Revenue (million) Forecast, by Application 2019 & 2032
- Table 84: India Transmissive Photo Interrupter Volume (K) Forecast, by Application 2019 & 2032
- Table 85: Japan Transmissive Photo Interrupter Revenue (million) Forecast, by Application 2019 & 2032
- Table 86: Japan Transmissive Photo Interrupter Volume (K) Forecast, by Application 2019 & 2032
- Table 87: South Korea Transmissive Photo Interrupter Revenue (million) Forecast, by Application 2019 & 2032
- Table 88: South Korea Transmissive Photo Interrupter Volume (K) Forecast, by Application 2019 & 2032
- Table 89: ASEAN Transmissive Photo Interrupter Revenue (million) Forecast, by Application 2019 & 2032
- Table 90: ASEAN Transmissive Photo Interrupter Volume (K) Forecast, by Application 2019 & 2032
- Table 91: Oceania Transmissive Photo Interrupter Revenue (million) Forecast, by Application 2019 & 2032
- Table 92: Oceania Transmissive Photo Interrupter Volume (K) Forecast, by Application 2019 & 2032
- Table 93: Rest of Asia Pacific Transmissive Photo Interrupter Revenue (million) Forecast, by Application 2019 & 2032
- Table 94: Rest of Asia Pacific Transmissive Photo Interrupter Volume (K) Forecast, by Application 2019 & 2032
Frequently Asked Questions
1. What is the projected Compound Annual Growth Rate (CAGR) of the Transmissive Photo Interrupter?
The projected CAGR is approximately XX%.
2. Which companies are prominent players in the Transmissive Photo Interrupter?
Key companies in the market include Omron, Vishay, Sharp Corporation, Everlight, Panasonic Corporation, Broadcom, Rohm Semiconductor, TT Electronics, Honeywell, Nippon Aleph, Kingbright, Kodenshi, Lite-On, OncQue Corporation, okayaelec.
3. What are the main segments of the Transmissive Photo Interrupter?
The market segments include Application, Types.
4. Can you provide details about the market size?
The market size is estimated to be USD XXX million as of 2022.
5. What are some drivers contributing to market growth?
N/A
6. What are the notable trends driving market growth?
N/A
7. Are there any restraints impacting market growth?
N/A
8. Can you provide examples of recent developments in the market?
N/A
9. What pricing options are available for accessing the report?
Pricing options include single-user, multi-user, and enterprise licenses priced at USD 4350.00, USD 6525.00, and USD 8700.00 respectively.
10. Is the market size provided in terms of value or volume?
The market size is provided in terms of value, measured in million and volume, measured in K.
11. Are there any specific market keywords associated with the report?
Yes, the market keyword associated with the report is "Transmissive Photo Interrupter," which aids in identifying and referencing the specific market segment covered.
12. How do I determine which pricing option suits my needs best?
The pricing options vary based on user requirements and access needs. Individual users may opt for single-user licenses, while businesses requiring broader access may choose multi-user or enterprise licenses for cost-effective access to the report.
13. Are there any additional resources or data provided in the Transmissive Photo Interrupter report?
While the report offers comprehensive insights, it's advisable to review the specific contents or supplementary materials provided to ascertain if additional resources or data are available.
14. How can I stay updated on further developments or reports in the Transmissive Photo Interrupter?
To stay informed about further developments, trends, and reports in the Transmissive Photo Interrupter, consider subscribing to industry newsletters, following relevant companies and organizations, or regularly checking reputable industry news sources and publications.
Methodology
Step 1 - Identification of Relevant Samples Size from Population Database


Step 2 - Approaches for Defining Global Market Size (Value, Volume* & Price*)

Note*: In applicable scenarios
Step 3 - Data Sources
Primary Research
- Web Analytics
- Survey Reports
- Research Institute
- Latest Research Reports
- Opinion Leaders
Secondary Research
- Annual Reports
- White Paper
- Latest Press Release
- Industry Association
- Paid Database
- Investor Presentations

Step 4 - Data Triangulation
Involves using different sources of information in order to increase the validity of a study
These sources are likely to be stakeholders in a program - participants, other researchers, program staff, other community members, and so on.
Then we put all data in single framework & apply various statistical tools to find out the dynamic on the market.
During the analysis stage, feedback from the stakeholder groups would be compared to determine areas of agreement as well as areas of divergence
