

Key Insights
The global turbine air filtration market is projected for robust expansion, reaching an estimated market size of 2.09 billion by 2025, with a Compound Annual Growth Rate (CAGR) of 3.73% from 2025 to 2033. Key growth drivers include escalating demand for cleaner energy in power generation and stringent global environmental regulations mandating emission reduction. The oil and gas sector's focus on operational efficiency and equipment protection also significantly contributes to this growth. Technological advancements in filtration media and system design are further propelling the market forward, with high-velocity filtration systems demonstrating notable potential.
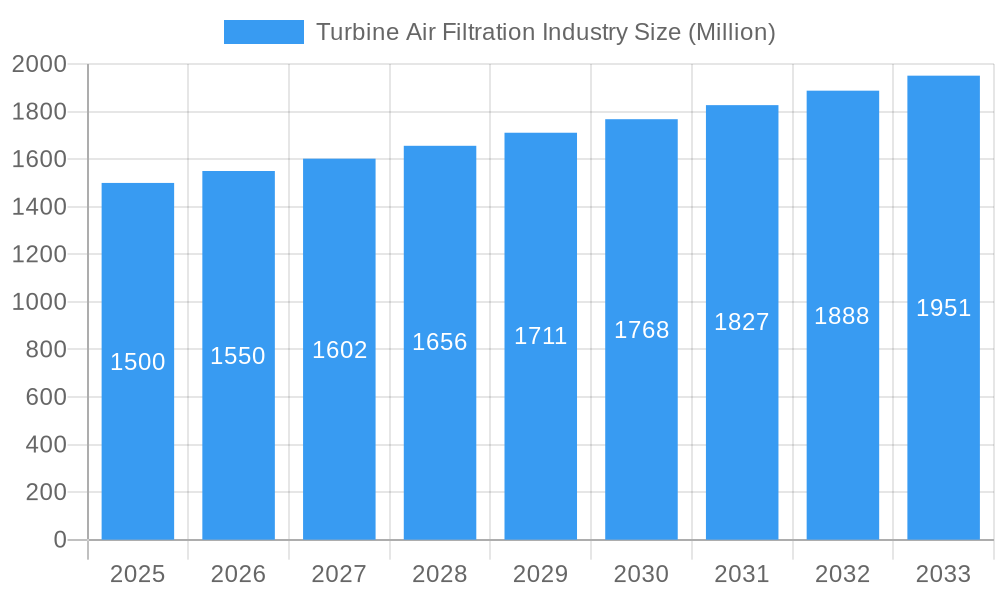
Turbine Air Filtration Industry Market Size (In Billion)
Market restraints include the high initial investment for advanced filtration systems and ongoing operational costs for maintenance and replacement. However, the long-term advantages of extended equipment lifespan, reduced downtime, and regulatory compliance are expected to offset these challenges, ensuring sustained market growth. North America and Europe demonstrate strong performance, while Asia-Pacific is an emerging growth hub driven by industrialization and increased power generation. Leading players like Daikin Industries, Donaldson Company, and MANN+HUMMEL are instrumental through innovation and strategic alliances. Future trajectory will be shaped by continued technological innovation, supportive regulatory environments, and heightened awareness of the environmental and economic benefits of turbine air filtration.
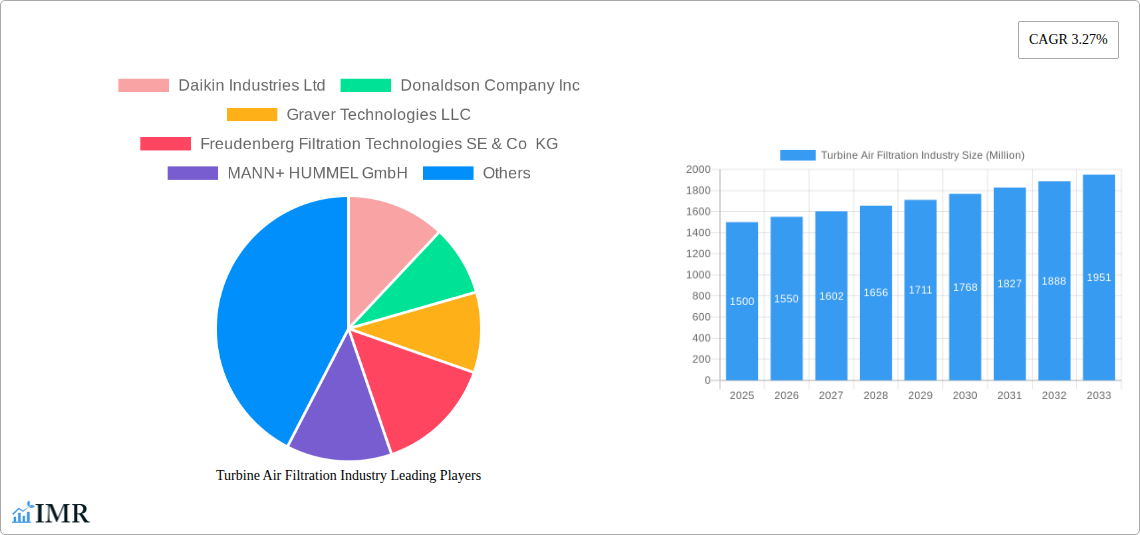
Turbine Air Filtration Industry Company Market Share
Turbine Air Filtration Industry Market Report: 2019-2033
This comprehensive report provides a detailed analysis of the Turbine Air Filtration industry, encompassing market dynamics, growth trends, regional segmentation, product landscape, and key players. With a study period spanning 2019-2033, a base year of 2025, and a forecast period of 2025-2033, this report is an invaluable resource for industry professionals, investors, and strategists seeking to understand and capitalize on the opportunities within this dynamic market. The report analyzes the parent market of industrial filtration and the child market of turbine air filtration, providing a granular view of market segments like power generation and oil & gas. The market size is estimated to be xx Million in 2025.
Turbine Air Filtration Industry Market Dynamics & Structure
The turbine air filtration market is characterized by a moderately concentrated landscape, with several major players holding significant market share. Technological innovation, driven by the need for enhanced efficiency and reduced environmental impact, is a key driver. Stringent regulatory frameworks concerning emissions and safety standards further shape market dynamics. Competitive pressure from substitute technologies (e.g., alternative filtration methods) and the increasing demand from end-users in power generation and oil & gas sectors are significant factors. M&A activity, while not excessively frequent, plays a role in shaping market consolidation and technological integration.
- Market Concentration: Moderate, with the top 5 players holding approximately xx% of the market share in 2025.
- Technological Innovation: Focus on higher efficiency, lower pressure drop filters, and smart filtration systems.
- Regulatory Landscape: Stringent emission standards drive demand for high-performance filters.
- Competitive Substitutes: Alternative filtration techniques pose a moderate competitive threat.
- End-User Demographics: Primarily power generation, oil & gas, and other industrial sectors.
- M&A Trends: Consolidation expected through strategic acquisitions of smaller specialized companies.
Turbine Air Filtration Industry Growth Trends & Insights
The turbine air filtration market experienced significant growth during the historical period (2019-2024), fueled by increasing industrial activity and stringent environmental regulations. The market is projected to maintain a robust Compound Annual Growth Rate (CAGR) of xx% during the forecast period (2025-2033), driven by the rising demand for power generation and oil & gas infrastructure development. Technological advancements, such as the adoption of advanced filtration media and smart sensor integration, are further enhancing market growth. Shifting consumer preferences towards sustainable and energy-efficient solutions contribute to this growth. Market penetration is expected to reach xx% by 2033. The market size is predicted to reach xx Million by 2033.
Dominant Regions, Countries, or Segments in Turbine Air Filtration Industry
North America and Europe are currently the dominant regions, driven by robust industrial activity and stringent environmental regulations. Within applications, Power Generation and Oil & Gas represent the largest segments. Within face velocity, Medium Velocity filters hold the largest market share.
- Key Drivers (Power Generation): Increasing investments in renewable energy infrastructure and the retrofitting of existing power plants.
- Key Drivers (Oil & Gas): Expansion of upstream and downstream activities and stringent emission regulations.
- Key Drivers (Medium Velocity): Wide applicability across various turbine types and balance between efficiency and cost.
- Market Share: Power Generation holds approximately xx% of the market share, Oil & Gas accounts for xx%, and other industrial applications contribute to the remaining xx%. Medium Velocity filters possess a xx% market share.
Turbine Air Filtration Industry Product Landscape
The turbine air filtration market showcases a diverse range of products, including high-efficiency particulate air (HEPA) filters, ultra-low penetration air (ULPA) filters, and specialized filters designed for specific turbine applications. These filters are differentiated based on their filtration efficiency, pressure drop characteristics, and service life. Technological advancements focus on improving filtration performance, extending filter life, and reducing overall system costs. Unique selling propositions often center on superior filtration efficiency, reduced maintenance needs, and extended operational life.
Key Drivers, Barriers & Challenges in Turbine Air Filtration Industry
Key Drivers: Stringent environmental regulations, increasing energy demand, and technological advancements in filtration media are driving market growth.
Challenges: High initial investment costs, supply chain disruptions impacting the availability of raw materials, and intense competition among established players pose significant challenges. The quantifiable impact of supply chain issues is estimated to be a xx% reduction in production capacity during peak periods.
Emerging Opportunities in Turbine Air Filtration Industry
Emerging opportunities lie in the development of smart filtration systems with integrated sensors for real-time monitoring, the expansion into emerging economies with growing industrialization, and the focus on sustainable and recyclable filter materials.
Growth Accelerators in the Turbine Air Filtration Industry
Technological breakthroughs in filtration media, strategic partnerships between filter manufacturers and turbine OEMs, and expansion into new geographical markets, particularly in developing Asian economies, are key growth catalysts.
Key Players Shaping the Turbine Air Filtration Industry Market
- Daikin Industries Ltd
- Donaldson Company Inc
- Graver Technologies LLC
- Freudenberg Filtration Technologies SE & Co KG
- MANN+ HUMMEL GmbH
- Koch Filter Corporation
- Camfil AB
- Advanced Filtration Concepts
- W L Gore & Associates Inc
- Parker Hannifin Corporation
- Nordic Air Filtration A/S
Notable Milestones in Turbine Air Filtration Industry Sector
- June 2021: Camfil Group expands its technical research center, signifying investment in R&D and future innovation.
- May 2021: Parker Hannifin launches ASSURE filter line, introducing a new high-performance product to the market.
- March 2021: Transco's REAE project filing signals infrastructure development and increased demand for turbine air filtration systems.
In-Depth Turbine Air Filtration Industry Market Outlook
The turbine air filtration market exhibits strong growth potential, driven by continuous technological innovation, increasing demand from key industrial sectors, and stringent environmental regulations. Strategic partnerships, focus on sustainable solutions, and expansion into emerging markets will be crucial for continued success in this dynamic industry. The market is poised for sustained growth, presenting significant opportunities for existing and new players alike.
Turbine Air Filtration Industry Segmentation
-
1. Application
- 1.1. Power Generation
- 1.2. Oil and Gas
- 1.3. Others
-
2. Face Velocity
- 2.1. Low Velocity
- 2.2. Medium Velocity
- 2.3. High Velocity
Turbine Air Filtration Industry Segmentation By Geography
- 1. North America
- 2. Europe
- 3. Asia Pacific
- 4. South America
- 5. Middle East and Africa
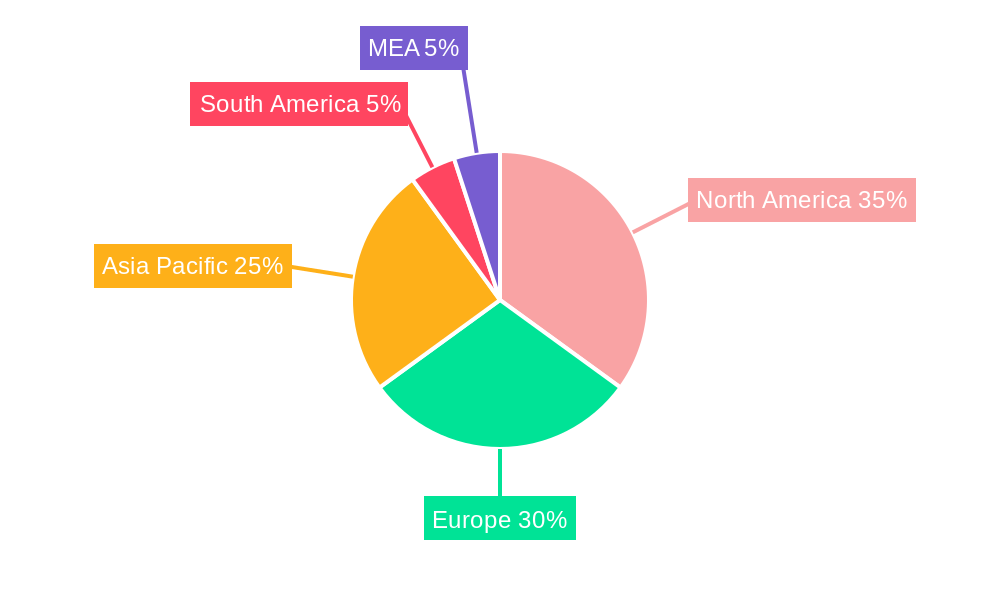
Turbine Air Filtration Industry Regional Market Share
Geographic Coverage of Turbine Air Filtration Industry
Turbine Air Filtration Industry REPORT HIGHLIGHTS
| Aspects | Details |
|---|---|
| Study Period | 2020-2034 |
| Base Year | 2025 |
| Estimated Year | 2026 |
| Forecast Period | 2026-2034 |
| Historical Period | 2020-2025 |
| Growth Rate | CAGR of 3.73% from 2020-2034 |
| Segmentation |
|
Table of Contents
- 1. Introduction
- 1.1. Research Scope
- 1.2. Market Segmentation
- 1.3. Research Objective
- 1.4. Definitions and Assumptions
- 2. Executive Summary
- 2.1. Market Snapshot
- 3. Market Dynamics
- 3.1. Market Drivers
- 3.2. Market Restrains
- 3.3. Market Trends
- 3.4. Market Opportunities
- 4. Market Factor Analysis
- 4.1. Porters Five Forces
- 4.1.1. Bargaining Power of Suppliers
- 4.1.2. Bargaining Power of Buyers
- 4.1.3. Threat of New Entrants
- 4.1.4. Threat of Substitutes
- 4.1.5. Competitive Rivalry
- 4.2. PESTEL analysis
- 4.3. BCG Analysis
- 4.3.1. Stars (High Growth, High Market Share)
- 4.3.2. Cash Cows (Low Growth, High Market Share)
- 4.3.3. Question Mark (High Growth, Low Market Share)
- 4.3.4. Dogs (Low Growth, Low Market Share)
- 4.4. Ansoff Matrix Analysis
- 4.5. Supply Chain Analysis
- 4.6. Regulatory Landscape
- 4.7. Current Market Potential and Opportunity Assessment (TAM–SAM–SOM Framework)
- 4.8. IMR Analyst Note
- 4.1. Porters Five Forces
- 5. Market Analysis, Insights and Forecast 2021-2033
- 5.1. Market Analysis, Insights and Forecast - by Application
- 5.1.1. Power Generation
- 5.1.2. Oil and Gas
- 5.1.3. Others
- 5.2. Market Analysis, Insights and Forecast - by Face Velocity
- 5.2.1. Low Velocity
- 5.2.2. Medium Velocity
- 5.2.3. High Velocity
- 5.3. Market Analysis, Insights and Forecast - by Region
- 5.3.1. North America
- 5.3.2. Europe
- 5.3.3. Asia Pacific
- 5.3.4. South America
- 5.3.5. Middle East and Africa
- 5.1. Market Analysis, Insights and Forecast - by Application
- 6. Global Turbine Air Filtration Industry Analysis, Insights and Forecast, 2021-2033
- 6.1. Market Analysis, Insights and Forecast - by Application
- 6.1.1. Power Generation
- 6.1.2. Oil and Gas
- 6.1.3. Others
- 6.2. Market Analysis, Insights and Forecast - by Face Velocity
- 6.2.1. Low Velocity
- 6.2.2. Medium Velocity
- 6.2.3. High Velocity
- 6.1. Market Analysis, Insights and Forecast - by Application
- 7. North America Turbine Air Filtration Industry Analysis, Insights and Forecast, 2020-2032
- 7.1. Market Analysis, Insights and Forecast - by Application
- 7.1.1. Power Generation
- 7.1.2. Oil and Gas
- 7.1.3. Others
- 7.2. Market Analysis, Insights and Forecast - by Face Velocity
- 7.2.1. Low Velocity
- 7.2.2. Medium Velocity
- 7.2.3. High Velocity
- 7.1. Market Analysis, Insights and Forecast - by Application
- 8. Europe Turbine Air Filtration Industry Analysis, Insights and Forecast, 2020-2032
- 8.1. Market Analysis, Insights and Forecast - by Application
- 8.1.1. Power Generation
- 8.1.2. Oil and Gas
- 8.1.3. Others
- 8.2. Market Analysis, Insights and Forecast - by Face Velocity
- 8.2.1. Low Velocity
- 8.2.2. Medium Velocity
- 8.2.3. High Velocity
- 8.1. Market Analysis, Insights and Forecast - by Application
- 9. Asia Pacific Turbine Air Filtration Industry Analysis, Insights and Forecast, 2020-2032
- 9.1. Market Analysis, Insights and Forecast - by Application
- 9.1.1. Power Generation
- 9.1.2. Oil and Gas
- 9.1.3. Others
- 9.2. Market Analysis, Insights and Forecast - by Face Velocity
- 9.2.1. Low Velocity
- 9.2.2. Medium Velocity
- 9.2.3. High Velocity
- 9.1. Market Analysis, Insights and Forecast - by Application
- 10. South America Turbine Air Filtration Industry Analysis, Insights and Forecast, 2020-2032
- 10.1. Market Analysis, Insights and Forecast - by Application
- 10.1.1. Power Generation
- 10.1.2. Oil and Gas
- 10.1.3. Others
- 10.2. Market Analysis, Insights and Forecast - by Face Velocity
- 10.2.1. Low Velocity
- 10.2.2. Medium Velocity
- 10.2.3. High Velocity
- 10.1. Market Analysis, Insights and Forecast - by Application
- 11. Middle East and Africa Turbine Air Filtration Industry Analysis, Insights and Forecast, 2020-2032
- 11.1. Market Analysis, Insights and Forecast - by Application
- 11.1.1. Power Generation
- 11.1.2. Oil and Gas
- 11.1.3. Others
- 11.2. Market Analysis, Insights and Forecast - by Face Velocity
- 11.2.1. Low Velocity
- 11.2.2. Medium Velocity
- 11.2.3. High Velocity
- 11.1. Market Analysis, Insights and Forecast - by Application
- 12. Competitive Analysis
- 12.1. Company Profiles
- 12.1.1 Daikin Industries Ltd
- 12.1.1.1. Company Overview
- 12.1.1.2. Products
- 12.1.1.3. Company Financials
- 12.1.1.4. SWOT Analysis
- 12.1.2 Donaldson Company Inc
- 12.1.2.1. Company Overview
- 12.1.2.2. Products
- 12.1.2.3. Company Financials
- 12.1.2.4. SWOT Analysis
- 12.1.3 Graver Technologies LLC
- 12.1.3.1. Company Overview
- 12.1.3.2. Products
- 12.1.3.3. Company Financials
- 12.1.3.4. SWOT Analysis
- 12.1.4 Freudenberg Filtration Technologies SE & Co KG
- 12.1.4.1. Company Overview
- 12.1.4.2. Products
- 12.1.4.3. Company Financials
- 12.1.4.4. SWOT Analysis
- 12.1.5 MANN+ HUMMEL GmbH
- 12.1.5.1. Company Overview
- 12.1.5.2. Products
- 12.1.5.3. Company Financials
- 12.1.5.4. SWOT Analysis
- 12.1.6 Koch Filter Corporation
- 12.1.6.1. Company Overview
- 12.1.6.2. Products
- 12.1.6.3. Company Financials
- 12.1.6.4. SWOT Analysis
- 12.1.7 Camfil AB
- 12.1.7.1. Company Overview
- 12.1.7.2. Products
- 12.1.7.3. Company Financials
- 12.1.7.4. SWOT Analysis
- 12.1.8 Advanced Filtration Concepts
- 12.1.8.1. Company Overview
- 12.1.8.2. Products
- 12.1.8.3. Company Financials
- 12.1.8.4. SWOT Analysis
- 12.1.9 W L Gore & Associates Inc *List Not Exhaustive
- 12.1.9.1. Company Overview
- 12.1.9.2. Products
- 12.1.9.3. Company Financials
- 12.1.9.4. SWOT Analysis
- 12.1.10 Parker Hannifin Corporation
- 12.1.10.1. Company Overview
- 12.1.10.2. Products
- 12.1.10.3. Company Financials
- 12.1.10.4. SWOT Analysis
- 12.1.11 Nordic Air Filtration A/S
- 12.1.11.1. Company Overview
- 12.1.11.2. Products
- 12.1.11.3. Company Financials
- 12.1.11.4. SWOT Analysis
- 12.1.1 Daikin Industries Ltd
- 12.2. Market Entropy
- 12.2.1 Company's Key Areas Served
- 12.2.2 Recent Developments
- 12.3. Company Market Share Analysis 2025
- 12.3.1 Top 5 Companies Market Share Analysis
- 12.3.2 Top 3 Companies Market Share Analysis
- 12.4. List of Potential Customers
- 13. Research Methodology
List of Figures
- Figure 1: Global Turbine Air Filtration Industry Revenue Breakdown (billion, %) by Region 2025 & 2033
- Figure 2: Global Turbine Air Filtration Industry Volume Breakdown (K Unit, %) by Region 2025 & 2033
- Figure 3: North America Turbine Air Filtration Industry Revenue (billion), by Application 2025 & 2033
- Figure 4: North America Turbine Air Filtration Industry Volume (K Unit), by Application 2025 & 2033
- Figure 5: North America Turbine Air Filtration Industry Revenue Share (%), by Application 2025 & 2033
- Figure 6: North America Turbine Air Filtration Industry Volume Share (%), by Application 2025 & 2033
- Figure 7: North America Turbine Air Filtration Industry Revenue (billion), by Face Velocity 2025 & 2033
- Figure 8: North America Turbine Air Filtration Industry Volume (K Unit), by Face Velocity 2025 & 2033
- Figure 9: North America Turbine Air Filtration Industry Revenue Share (%), by Face Velocity 2025 & 2033
- Figure 10: North America Turbine Air Filtration Industry Volume Share (%), by Face Velocity 2025 & 2033
- Figure 11: North America Turbine Air Filtration Industry Revenue (billion), by Country 2025 & 2033
- Figure 12: North America Turbine Air Filtration Industry Volume (K Unit), by Country 2025 & 2033
- Figure 13: North America Turbine Air Filtration Industry Revenue Share (%), by Country 2025 & 2033
- Figure 14: North America Turbine Air Filtration Industry Volume Share (%), by Country 2025 & 2033
- Figure 15: Europe Turbine Air Filtration Industry Revenue (billion), by Application 2025 & 2033
- Figure 16: Europe Turbine Air Filtration Industry Volume (K Unit), by Application 2025 & 2033
- Figure 17: Europe Turbine Air Filtration Industry Revenue Share (%), by Application 2025 & 2033
- Figure 18: Europe Turbine Air Filtration Industry Volume Share (%), by Application 2025 & 2033
- Figure 19: Europe Turbine Air Filtration Industry Revenue (billion), by Face Velocity 2025 & 2033
- Figure 20: Europe Turbine Air Filtration Industry Volume (K Unit), by Face Velocity 2025 & 2033
- Figure 21: Europe Turbine Air Filtration Industry Revenue Share (%), by Face Velocity 2025 & 2033
- Figure 22: Europe Turbine Air Filtration Industry Volume Share (%), by Face Velocity 2025 & 2033
- Figure 23: Europe Turbine Air Filtration Industry Revenue (billion), by Country 2025 & 2033
- Figure 24: Europe Turbine Air Filtration Industry Volume (K Unit), by Country 2025 & 2033
- Figure 25: Europe Turbine Air Filtration Industry Revenue Share (%), by Country 2025 & 2033
- Figure 26: Europe Turbine Air Filtration Industry Volume Share (%), by Country 2025 & 2033
- Figure 27: Asia Pacific Turbine Air Filtration Industry Revenue (billion), by Application 2025 & 2033
- Figure 28: Asia Pacific Turbine Air Filtration Industry Volume (K Unit), by Application 2025 & 2033
- Figure 29: Asia Pacific Turbine Air Filtration Industry Revenue Share (%), by Application 2025 & 2033
- Figure 30: Asia Pacific Turbine Air Filtration Industry Volume Share (%), by Application 2025 & 2033
- Figure 31: Asia Pacific Turbine Air Filtration Industry Revenue (billion), by Face Velocity 2025 & 2033
- Figure 32: Asia Pacific Turbine Air Filtration Industry Volume (K Unit), by Face Velocity 2025 & 2033
- Figure 33: Asia Pacific Turbine Air Filtration Industry Revenue Share (%), by Face Velocity 2025 & 2033
- Figure 34: Asia Pacific Turbine Air Filtration Industry Volume Share (%), by Face Velocity 2025 & 2033
- Figure 35: Asia Pacific Turbine Air Filtration Industry Revenue (billion), by Country 2025 & 2033
- Figure 36: Asia Pacific Turbine Air Filtration Industry Volume (K Unit), by Country 2025 & 2033
- Figure 37: Asia Pacific Turbine Air Filtration Industry Revenue Share (%), by Country 2025 & 2033
- Figure 38: Asia Pacific Turbine Air Filtration Industry Volume Share (%), by Country 2025 & 2033
- Figure 39: South America Turbine Air Filtration Industry Revenue (billion), by Application 2025 & 2033
- Figure 40: South America Turbine Air Filtration Industry Volume (K Unit), by Application 2025 & 2033
- Figure 41: South America Turbine Air Filtration Industry Revenue Share (%), by Application 2025 & 2033
- Figure 42: South America Turbine Air Filtration Industry Volume Share (%), by Application 2025 & 2033
- Figure 43: South America Turbine Air Filtration Industry Revenue (billion), by Face Velocity 2025 & 2033
- Figure 44: South America Turbine Air Filtration Industry Volume (K Unit), by Face Velocity 2025 & 2033
- Figure 45: South America Turbine Air Filtration Industry Revenue Share (%), by Face Velocity 2025 & 2033
- Figure 46: South America Turbine Air Filtration Industry Volume Share (%), by Face Velocity 2025 & 2033
- Figure 47: South America Turbine Air Filtration Industry Revenue (billion), by Country 2025 & 2033
- Figure 48: South America Turbine Air Filtration Industry Volume (K Unit), by Country 2025 & 2033
- Figure 49: South America Turbine Air Filtration Industry Revenue Share (%), by Country 2025 & 2033
- Figure 50: South America Turbine Air Filtration Industry Volume Share (%), by Country 2025 & 2033
- Figure 51: Middle East and Africa Turbine Air Filtration Industry Revenue (billion), by Application 2025 & 2033
- Figure 52: Middle East and Africa Turbine Air Filtration Industry Volume (K Unit), by Application 2025 & 2033
- Figure 53: Middle East and Africa Turbine Air Filtration Industry Revenue Share (%), by Application 2025 & 2033
- Figure 54: Middle East and Africa Turbine Air Filtration Industry Volume Share (%), by Application 2025 & 2033
- Figure 55: Middle East and Africa Turbine Air Filtration Industry Revenue (billion), by Face Velocity 2025 & 2033
- Figure 56: Middle East and Africa Turbine Air Filtration Industry Volume (K Unit), by Face Velocity 2025 & 2033
- Figure 57: Middle East and Africa Turbine Air Filtration Industry Revenue Share (%), by Face Velocity 2025 & 2033
- Figure 58: Middle East and Africa Turbine Air Filtration Industry Volume Share (%), by Face Velocity 2025 & 2033
- Figure 59: Middle East and Africa Turbine Air Filtration Industry Revenue (billion), by Country 2025 & 2033
- Figure 60: Middle East and Africa Turbine Air Filtration Industry Volume (K Unit), by Country 2025 & 2033
- Figure 61: Middle East and Africa Turbine Air Filtration Industry Revenue Share (%), by Country 2025 & 2033
- Figure 62: Middle East and Africa Turbine Air Filtration Industry Volume Share (%), by Country 2025 & 2033
List of Tables
- Table 1: Global Turbine Air Filtration Industry Revenue billion Forecast, by Application 2020 & 2033
- Table 2: Global Turbine Air Filtration Industry Volume K Unit Forecast, by Application 2020 & 2033
- Table 3: Global Turbine Air Filtration Industry Revenue billion Forecast, by Face Velocity 2020 & 2033
- Table 4: Global Turbine Air Filtration Industry Volume K Unit Forecast, by Face Velocity 2020 & 2033
- Table 5: Global Turbine Air Filtration Industry Revenue billion Forecast, by Region 2020 & 2033
- Table 6: Global Turbine Air Filtration Industry Volume K Unit Forecast, by Region 2020 & 2033
- Table 7: Global Turbine Air Filtration Industry Revenue billion Forecast, by Application 2020 & 2033
- Table 8: Global Turbine Air Filtration Industry Volume K Unit Forecast, by Application 2020 & 2033
- Table 9: Global Turbine Air Filtration Industry Revenue billion Forecast, by Face Velocity 2020 & 2033
- Table 10: Global Turbine Air Filtration Industry Volume K Unit Forecast, by Face Velocity 2020 & 2033
- Table 11: Global Turbine Air Filtration Industry Revenue billion Forecast, by Country 2020 & 2033
- Table 12: Global Turbine Air Filtration Industry Volume K Unit Forecast, by Country 2020 & 2033
- Table 13: Global Turbine Air Filtration Industry Revenue billion Forecast, by Application 2020 & 2033
- Table 14: Global Turbine Air Filtration Industry Volume K Unit Forecast, by Application 2020 & 2033
- Table 15: Global Turbine Air Filtration Industry Revenue billion Forecast, by Face Velocity 2020 & 2033
- Table 16: Global Turbine Air Filtration Industry Volume K Unit Forecast, by Face Velocity 2020 & 2033
- Table 17: Global Turbine Air Filtration Industry Revenue billion Forecast, by Country 2020 & 2033
- Table 18: Global Turbine Air Filtration Industry Volume K Unit Forecast, by Country 2020 & 2033
- Table 19: Global Turbine Air Filtration Industry Revenue billion Forecast, by Application 2020 & 2033
- Table 20: Global Turbine Air Filtration Industry Volume K Unit Forecast, by Application 2020 & 2033
- Table 21: Global Turbine Air Filtration Industry Revenue billion Forecast, by Face Velocity 2020 & 2033
- Table 22: Global Turbine Air Filtration Industry Volume K Unit Forecast, by Face Velocity 2020 & 2033
- Table 23: Global Turbine Air Filtration Industry Revenue billion Forecast, by Country 2020 & 2033
- Table 24: Global Turbine Air Filtration Industry Volume K Unit Forecast, by Country 2020 & 2033
- Table 25: Global Turbine Air Filtration Industry Revenue billion Forecast, by Application 2020 & 2033
- Table 26: Global Turbine Air Filtration Industry Volume K Unit Forecast, by Application 2020 & 2033
- Table 27: Global Turbine Air Filtration Industry Revenue billion Forecast, by Face Velocity 2020 & 2033
- Table 28: Global Turbine Air Filtration Industry Volume K Unit Forecast, by Face Velocity 2020 & 2033
- Table 29: Global Turbine Air Filtration Industry Revenue billion Forecast, by Country 2020 & 2033
- Table 30: Global Turbine Air Filtration Industry Volume K Unit Forecast, by Country 2020 & 2033
- Table 31: Global Turbine Air Filtration Industry Revenue billion Forecast, by Application 2020 & 2033
- Table 32: Global Turbine Air Filtration Industry Volume K Unit Forecast, by Application 2020 & 2033
- Table 33: Global Turbine Air Filtration Industry Revenue billion Forecast, by Face Velocity 2020 & 2033
- Table 34: Global Turbine Air Filtration Industry Volume K Unit Forecast, by Face Velocity 2020 & 2033
- Table 35: Global Turbine Air Filtration Industry Revenue billion Forecast, by Country 2020 & 2033
- Table 36: Global Turbine Air Filtration Industry Volume K Unit Forecast, by Country 2020 & 2033
Frequently Asked Questions
1. What is the projected Compound Annual Growth Rate (CAGR) of the Turbine Air Filtration Industry?
The projected CAGR is approximately 3.73%.
2. Which companies are prominent players in the Turbine Air Filtration Industry?
Key companies in the market include Daikin Industries Ltd, Donaldson Company Inc, Graver Technologies LLC, Freudenberg Filtration Technologies SE & Co KG, MANN+ HUMMEL GmbH, Koch Filter Corporation, Camfil AB, Advanced Filtration Concepts, W L Gore & Associates Inc *List Not Exhaustive, Parker Hannifin Corporation, Nordic Air Filtration A/S.
3. What are the main segments of the Turbine Air Filtration Industry?
The market segments include Application, Face Velocity.
4. Can you provide details about the market size?
The market size is estimated to be USD 2.09 billion as of 2022.
5. What are some drivers contributing to market growth?
4.; Increasing Number of Automobiles4.; The Government Policy Regarding Pollution Emission Control Parameters.
6. What are the notable trends driving market growth?
Power Generation Segment to Dominate the Market.
7. Are there any restraints impacting market growth?
4.; The Technological Limitations of Air Filters.
8. Can you provide examples of recent developments in the market?
In June 2021, Camfil Group announced the expansion of its state-of-the-art technical research center in Trosa, Sweden, which is expected to be completed by the end of 2021.
9. What pricing options are available for accessing the report?
Pricing options include single-user, multi-user, and enterprise licenses priced at USD 4750, USD 5250, and USD 8750 respectively.
10. Is the market size provided in terms of value or volume?
The market size is provided in terms of value, measured in billion and volume, measured in K Unit.
11. Are there any specific market keywords associated with the report?
Yes, the market keyword associated with the report is "Turbine Air Filtration Industry," which aids in identifying and referencing the specific market segment covered.
12. How do I determine which pricing option suits my needs best?
The pricing options vary based on user requirements and access needs. Individual users may opt for single-user licenses, while businesses requiring broader access may choose multi-user or enterprise licenses for cost-effective access to the report.
13. Are there any additional resources or data provided in the Turbine Air Filtration Industry report?
While the report offers comprehensive insights, it's advisable to review the specific contents or supplementary materials provided to ascertain if additional resources or data are available.
14. How can I stay updated on further developments or reports in the Turbine Air Filtration Industry?
To stay informed about further developments, trends, and reports in the Turbine Air Filtration Industry, consider subscribing to industry newsletters, following relevant companies and organizations, or regularly checking reputable industry news sources and publications.
Methodology
Step 1 - Identification of Relevant Samples Size from Population Database


Step 2 - Approaches for Defining Global Market Size (Value, Volume* & Price*)

Note*: In applicable scenarios
Step 3 - Data Sources
Primary Research
- Web Analytics
- Survey Reports
- Research Institute
- Latest Research Reports
- Opinion Leaders
Secondary Research
- Annual Reports
- White Paper
- Latest Press Release
- Industry Association
- Paid Database
- Investor Presentations

Step 4 - Data Triangulation
Involves using different sources of information in order to increase the validity of a study
These sources are likely to be stakeholders in a program - participants, other researchers, program staff, other community members, and so on.
Then we put all data in single framework & apply various statistical tools to find out the dynamic on the market.
During the analysis stage, feedback from the stakeholder groups would be compared to determine areas of agreement as well as areas of divergence