

Key Insights
The US Hazardous Location LED Lighting market is poised for significant expansion, projected to reach an estimated \$XX million by 2025, with a robust Compound Annual Growth Rate (CAGR) of 9.10% anticipated through 2033. This growth is primarily propelled by the increasing demand for enhanced safety and operational efficiency in industries operating within potentially explosive environments. Key drivers include stringent regulatory mandates for explosion-proof lighting, the inherent energy efficiency and longevity of LED technology, and the growing adoption of smart lighting solutions that offer remote monitoring and control capabilities. The transition from traditional lighting systems to advanced LED solutions is a critical trend, driven by both safety imperatives and the reduction of operational costs, including lower energy consumption and reduced maintenance requirements. Furthermore, the ongoing digital transformation across industrial sectors is fueling the integration of IoT-enabled hazardous location lighting, enabling predictive maintenance and optimizing lighting performance in real-time.
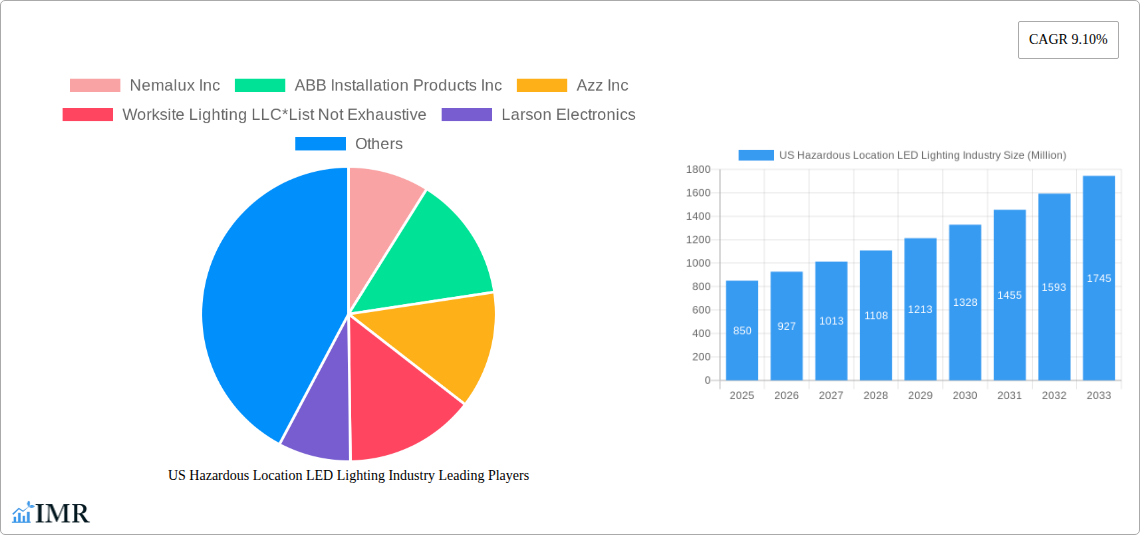
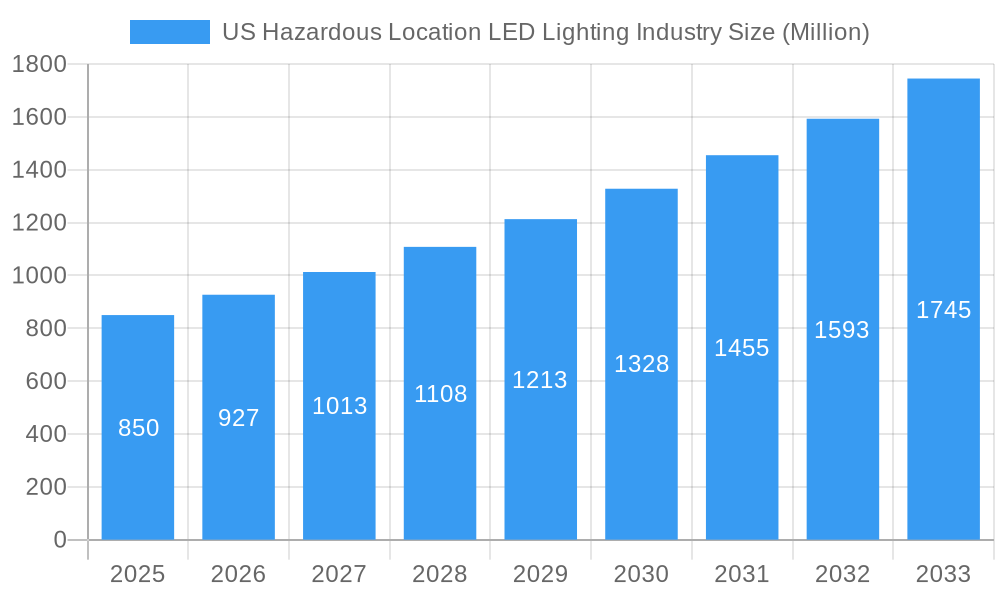
US Hazardous Location LED Lighting Industry Market Size (In Million)
Despite the positive outlook, the market faces certain restraints. The initial high capital investment for high-performance hazardous location LED fixtures can be a barrier for some smaller enterprises. Additionally, the availability of cheaper, less robust alternatives may present a challenge, though their lack of compliance with safety standards limits their long-term viability. The market is segmented across various device types, including Zone 0, Zone 20, Zone 1, Zone 21, and Zone 22, catering to specific risk levels. End-user verticals such as Oil and Gas, Petrochemical, Industrial, Power Generation, and Pharmaceutical are the primary consumers, each with unique safety and operational demands. North America, particularly the United States, is expected to maintain its dominant market position due to its established industrial base, stringent safety regulations, and significant investment in infrastructure upgrades and technological advancements in hazardous environments.
US Hazardous Location LED Lighting Industry Company Market Share
This comprehensive report delivers an in-depth analysis of the US Hazardous Location LED Lighting Industry, providing critical insights for stakeholders navigating this dynamic and safety-critical market. The study covers the historical period of 2019-2024, the base year of 2025, and a detailed forecast period extending to 2033, with the estimated year also being 2025. With a focus on US Hazardous Location LED Lighting Market Size, Market Share, CAGR, and Growth Trends, this report offers an unparalleled resource for understanding the present and future landscape. It meticulously examines both the parent market and child market segments, ensuring a holistic view.
US Hazardous Location LED Lighting Industry Market Dynamics & Structure
The US Hazardous Location LED Lighting industry is characterized by a moderately concentrated market structure, with key players investing heavily in technological innovation to meet stringent safety requirements. Driven by advancements in LED efficiency and explosion-proof enclosure designs, manufacturers are continuously introducing enhanced luminaires capable of withstanding extreme environmental conditions and flammable atmospheres. Regulatory frameworks, such as ATEX and NEC standards, play a pivotal role in dictating product design and deployment, acting as both a driver for compliance and a barrier to entry for less sophisticated solutions. Competitive product substitutes, though increasingly limited as LED technology matures, still include traditional HID and fluorescent lighting in some legacy applications. End-user demographics are heavily skewed towards industrial sectors with inherent risks. Mergers and acquisitions (M&A) activity, while not at peak levels, remains a strategic tool for consolidation and market penetration. The estimated market concentration for the base year 2025 stands at approximately 65% held by the top five players. M&A deal volumes averaged 3-5 significant transactions annually during the historical period. Barriers to innovation include the high cost of R&D for certification and the long product development cycles required to meet industry-specific safety standards.
- Market Concentration: Moderately concentrated, with a focus on specialized manufacturers.
- Technological Innovation Drivers: Enhanced LED efficacy, improved thermal management, robust explosion-proof enclosures, smart lighting integration for remote monitoring.
- Regulatory Frameworks: ATEX, NEC, IECEx standards are paramount, driving demand for certified products.
- Competitive Product Substitutes: Traditional HID and fluorescent lighting (decreasingly relevant).
- End-User Demographics: Predominantly Oil & Gas, Petrochemical, Industrial Manufacturing, and Power Generation sectors.
- M&A Trends: Strategic acquisitions for technology integration and market expansion.
US Hazardous Location LED Lighting Industry Growth Trends & Insights
The US Hazardous Location LED Lighting market is poised for significant expansion, driven by a confluence of factors including stringent safety mandates, the inherent energy efficiency of LED technology, and the increasing awareness of the operational benefits offered by advanced lighting solutions. The market size for hazardous location LED lighting in the US is projected to grow from an estimated $1,500 million in 2025 to reach $2,250 million by 2033, exhibiting a Compound Annual Growth Rate (CAGR) of approximately 5.5% during the forecast period. Adoption rates for LED solutions in hazardous environments are steadily increasing, driven by the long-term cost savings associated with reduced energy consumption and extended lifespan compared to traditional lighting technologies. Technological disruptions, such as the integration of IoT capabilities for predictive maintenance and remote diagnostics, are further enhancing the value proposition of LED lighting systems in these critical applications. Consumer behavior shifts are evident, with end-users increasingly prioritizing safety, reliability, and operational efficiency when making purchasing decisions. The historical period (2019-2024) saw a steady upward trend, with the market growing from an estimated $1,100 million in 2019 to $1,450 million in 2024. Market penetration of LED technology in hazardous locations is estimated to be around 70% in 2025, with significant room for further growth in replacing legacy systems and in new installations. The demand for specialized lighting solutions in Zone 2 and Zone 22 applications is a key growth driver, offering a more accessible entry point for LED adoption. The ongoing modernization of industrial infrastructure across various sectors, particularly in oil and gas and chemical processing, is creating sustained demand for compliant and robust lighting solutions. The development of more compact and lightweight luminaires is also contributing to easier installation and reduced labor costs, further accelerating market adoption. The increasing emphasis on workplace safety and compliance with evolving safety regulations continues to be a primary impetus for the transition to advanced LED lighting systems.
Dominant Regions, Countries, or Segments in US Hazardous Location LED Lighting Industry
Within the US Hazardous Location LED Lighting industry, the Oil and Gas end-user vertical stands out as the dominant segment, consistently driving market growth and innovation. This dominance stems from the inherent risks associated with exploration, extraction, refining, and transportation processes, which necessitate the highest standards of safety and reliability in lighting infrastructure. The market share for the Oil and Gas segment is estimated to be approximately 35% of the total US Hazardous Location LED Lighting market in 2025. Key drivers for this segment’s leadership include substantial capital expenditure on new infrastructure projects, ongoing maintenance and upgrade cycles for existing facilities, and stringent regulatory compliance requirements specific to explosive atmospheres.
Key Drivers for Oil and Gas Dominance:
- Safety Regulations: Strict adherence to ATEX, NEC, and API standards in exploration, drilling, and processing sites.
- Infrastructure Investment: Continuous investment in new refineries, offshore platforms, and pipeline networks.
- Operational Efficiency: Demand for reliable lighting to ensure uninterrupted operations and prevent accidents.
- Harsh Environmental Conditions: Need for robust luminaires capable of withstanding corrosive elements, extreme temperatures, and potential ignition sources.
Geographically, regions with a strong presence of oil and gas operations, such as the Gulf Coast states (Texas, Louisiana, etc.), are the primary consumers of hazardous location LED lighting. These regions benefit from significant economic policies supporting the energy sector and extensive industrial infrastructure.
Among device types, Zone 1 and Zone 21 applications, which represent areas where flammable gases, vapors, or dust are likely to occur in normal operation, command a significant portion of the market due to the higher risk profile. The market share for Zone 1 and Zone 21 combined is estimated to be around 40% in 2025.
Petro Chemical and Industrial sectors also represent substantial growth areas, driven by similar safety concerns and the need for specialized lighting solutions. The Power Generation sector, particularly in facilities handling coal or other combustible materials, also presents ongoing demand.
- Dominant End-User Vertical: Oil and Gas (estimated 35% market share in 2025).
- Leading Geographical Concentration: Gulf Coast states (Texas, Louisiana).
- Significant Device Type Segments: Zone 1 and Zone 21 (combined estimated 40% market share in 2025).
- Other Key End-User Verticals: Petro Chemical, Industrial, Power Generation.
US Hazardous Location LED Lighting Industry Product Landscape
The product landscape for US Hazardous Location LED Lighting is defined by high-performance, safety-certified luminaires designed for extreme environments. Innovations focus on enhancing ingress protection (IP ratings), improving thermal management to prevent overheating, and expanding the range of explosion-proof certifications to meet diverse global and regional standards. Applications span a wide spectrum, from general area illumination in refineries and chemical plants to task lighting in confined spaces and mobile equipment. Performance metrics are paramount, with emphasis on lumen output, efficacy (lumens per watt), color rendering index (CRI), and operational lifespan (often exceeding 50,000 hours). Unique selling propositions include integrated features like dimming capabilities, emergency backup, and compatibility with smart control systems for enhanced operational efficiency and safety monitoring. Technological advancements are leading to more compact, lightweight designs, reducing installation complexity and costs, while also offering increased resistance to vibration and shock.
Key Drivers, Barriers & Challenges in US Hazardous Location LED Lighting Industry
Key Drivers:
- Stringent Safety Regulations: Mandates for intrinsically safe and explosion-proof lighting in hazardous environments.
- Energy Efficiency Mandates: Government initiatives and corporate sustainability goals driving the adoption of energy-saving LED technology.
- Long-Term Cost Savings: Reduced energy consumption, lower maintenance, and extended lifespan of LED luminaires.
- Technological Advancements: Improved LED efficacy, durability, and integration of smart features.
- Industrial Modernization: Upgrades and new construction in critical sectors like Oil & Gas and Petrochemicals.
Barriers & Challenges:
- High Initial Investment Costs: Certified hazardous location fixtures are inherently more expensive due to specialized materials and manufacturing processes.
- Complex Certification Processes: Obtaining necessary safety certifications (e.g., ATEX, NEC) is time-consuming and costly.
- Supply Chain Volatility: Potential disruptions in the availability of specialized components and raw materials.
- Skilled Labor Shortages: Need for trained personnel for installation and maintenance in hazardous areas.
- Competition from Legacy Technologies: In some niche applications, existing traditional lighting systems may persist until end-of-life.
- Awareness and Training Gaps: Ensuring end-users are fully aware of the benefits and proper installation of LED hazardous location lighting. The estimated impact of supply chain issues on lead times for specialized components can range from 10-20%, impacting project timelines. Regulatory hurdles can add 6-12 months to product development and certification cycles.
Emerging Opportunities in US Hazardous Location LED Lighting Industry
Emerging opportunities within the US Hazardous Location LED Lighting industry lie in the integration of advanced smart technologies and the expansion into underserved niche markets. The growing demand for IoT-enabled hazardous location lighting presents a significant avenue for growth, allowing for remote monitoring, predictive maintenance, and real-time data analytics that enhance operational safety and efficiency. Furthermore, the development of highly specialized lighting solutions for emerging industries like hydrogen fuel production facilities and advanced battery manufacturing plants, which present unique hazardous atmosphere challenges, offers untapped market potential. There is also an increasing preference for circular economy principles, driving demand for luminaires with extended lifespans and improved recyclability.
Growth Accelerators in the US Hazardous Location LED Lighting Industry Industry
Several key catalysts are accelerating the growth of the US Hazardous Location LED Lighting industry. Technological breakthroughs in areas like solid-state lighting reliability and advanced material science are enabling the creation of more robust and efficient luminaires. Strategic partnerships between lighting manufacturers and industrial automation companies are fostering the development of integrated smart lighting solutions that enhance operational intelligence and safety protocols. Furthermore, market expansion strategies by key players, focusing on underserved industrial verticals and geographical regions, are driving broader adoption. The continuous push for enhanced safety compliance across all sectors, coupled with the long-term economic benefits of LED technology, acts as a powerful, ongoing growth accelerator.
Key Players Shaping the US Hazardous Location LED Lighting Industry Market
- Nemalux Inc
- ABB Installation Products Inc
- Azz Inc
- Worksite Lighting LLC
- Larson Electronics
- GE Current
- Hubbell Limited
- Emerson Electric Co
- Digital Lumens Inc (OSRAM)
- Eaton Corporation
Notable Milestones in US Hazardous Location LED Lighting Industry Sector
- 2019: Increased adoption of ATEX-certified LED solutions driven by stricter international safety standards compliance.
- 2020: Introduction of enhanced lumen packages and improved thermal management in explosion-proof LED fixtures.
- 2021: Growing integration of smart lighting controls and IoT capabilities for remote monitoring in hazardous locations.
- 2022: Significant investment in R&D for Zone 0 and Zone 20 compliant LED lighting to address the highest risk categories.
- 2023: Expansion of product lines to include more aesthetically integrated and versatile hazardous location luminaires for diverse industrial settings.
- 2024: Advancements in material science leading to lighter and more corrosion-resistant explosion-proof enclosures.
In-Depth US Hazardous Location LED Lighting Industry Market Outlook
The US Hazardous Location LED Lighting industry is set for sustained growth, fueled by an unwavering commitment to safety and the relentless pursuit of operational efficiency. The outlook is exceptionally positive, driven by ongoing industrial modernization, stringent regulatory enforcement, and the inherent superiority of LED technology in harsh environments. Growth accelerators such as next-generation smart lighting integration, offering predictive maintenance and real-time analytics, will further solidify the market's trajectory. Strategic market expansion into burgeoning sectors and the development of highly specialized lighting solutions for emerging hazardous applications will unlock new revenue streams. The industry's ability to innovate in response to evolving safety standards and the increasing demand for sustainable and cost-effective lighting solutions positions it for robust expansion throughout the forecast period.
US Hazardous Location LED Lighting Industry Segmentation
-
1. Device Type
- 1.1. Zone 0
- 1.2. Zone 20
- 1.3. Zone 1
- 1.4. Zone 21
- 1.5. Zone 22
-
2. End-User Vertical
- 2.1. Oil and Gas
- 2.2. Petro Chemical
- 2.3. Industrial
- 2.4. Power Generation
- 2.5. Pharmaceutical
- 2.6. Processing
- 2.7. Other End-user Industries
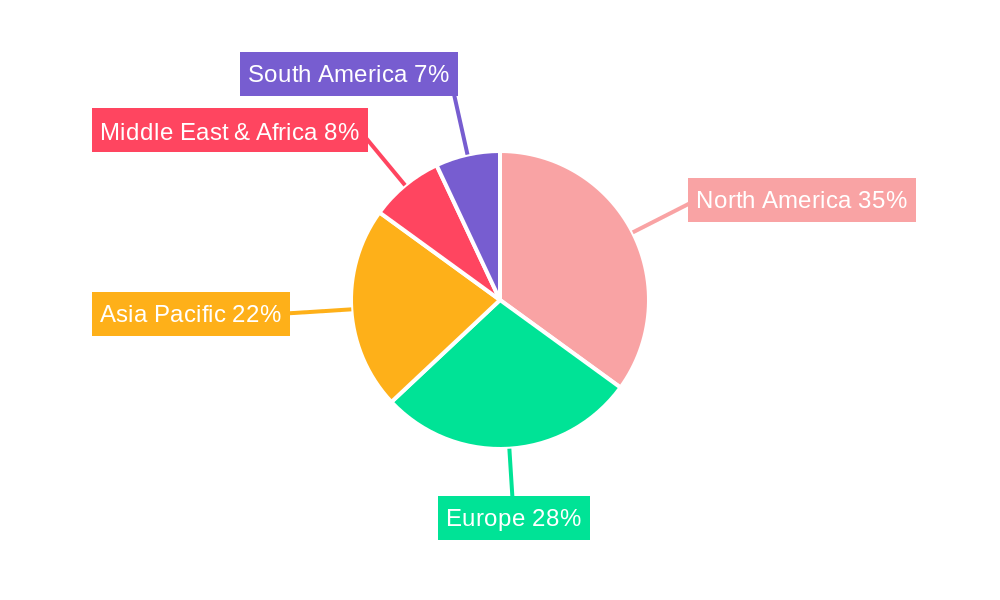
US Hazardous Location LED Lighting Industry Segmentation By Geography
-
1. North America
- 1.1. United States
- 1.2. Canada
- 1.3. Mexico
-
2. South America
- 2.1. Brazil
- 2.2. Argentina
- 2.3. Rest of South America
-
3. Europe
- 3.1. United Kingdom
- 3.2. Germany
- 3.3. France
- 3.4. Italy
- 3.5. Spain
- 3.6. Russia
- 3.7. Benelux
- 3.8. Nordics
- 3.9. Rest of Europe
-
4. Middle East & Africa
- 4.1. Turkey
- 4.2. Israel
- 4.3. GCC
- 4.4. North Africa
- 4.5. South Africa
- 4.6. Rest of Middle East & Africa
-
5. Asia Pacific
- 5.1. China
- 5.2. India
- 5.3. Japan
- 5.4. South Korea
- 5.5. ASEAN
- 5.6. Oceania
- 5.7. Rest of Asia Pacific
US Hazardous Location LED Lighting Industry Regional Market Share
Geographic Coverage of US Hazardous Location LED Lighting Industry
US Hazardous Location LED Lighting Industry REPORT HIGHLIGHTS
| Aspects | Details |
|---|---|
| Study Period | 2020-2034 |
| Base Year | 2025 |
| Estimated Year | 2026 |
| Forecast Period | 2026-2034 |
| Historical Period | 2020-2025 |
| Growth Rate | CAGR of 8% from 2020-2034 |
| Segmentation |
|
Table of Contents
- 1. Introduction
- 1.1. Research Scope
- 1.2. Market Segmentation
- 1.3. Research Objective
- 1.4. Definitions and Assumptions
- 2. Executive Summary
- 2.1. Market Snapshot
- 3. Market Dynamics
- 3.1. Market Drivers
- 3.2. Market Restrains
- 3.3. Market Trends
- 3.4. Market Opportunities
- 4. Market Factor Analysis
- 4.1. Porters Five Forces
- 4.1.1. Bargaining Power of Suppliers
- 4.1.2. Bargaining Power of Buyers
- 4.1.3. Threat of New Entrants
- 4.1.4. Threat of Substitutes
- 4.1.5. Competitive Rivalry
- 4.2. PESTEL analysis
- 4.3. BCG Analysis
- 4.3.1. Stars (High Growth, High Market Share)
- 4.3.2. Cash Cows (Low Growth, High Market Share)
- 4.3.3. Question Mark (High Growth, Low Market Share)
- 4.3.4. Dogs (Low Growth, Low Market Share)
- 4.4. Ansoff Matrix Analysis
- 4.5. Supply Chain Analysis
- 4.6. Regulatory Landscape
- 4.7. Current Market Potential and Opportunity Assessment (TAM–SAM–SOM Framework)
- 4.8. IMR Analyst Note
- 4.1. Porters Five Forces
- 5. Market Analysis, Insights and Forecast 2021-2033
- 5.1. Market Analysis, Insights and Forecast - by Device Type
- 5.1.1. Zone 0
- 5.1.2. Zone 20
- 5.1.3. Zone 1
- 5.1.4. Zone 21
- 5.1.5. Zone 22
- 5.2. Market Analysis, Insights and Forecast - by End-User Vertical
- 5.2.1. Oil and Gas
- 5.2.2. Petro Chemical
- 5.2.3. Industrial
- 5.2.4. Power Generation
- 5.2.5. Pharmaceutical
- 5.2.6. Processing
- 5.2.7. Other End-user Industries
- 5.3. Market Analysis, Insights and Forecast - by Region
- 5.3.1. North America
- 5.3.2. South America
- 5.3.3. Europe
- 5.3.4. Middle East & Africa
- 5.3.5. Asia Pacific
- 5.1. Market Analysis, Insights and Forecast - by Device Type
- 6. Global US Hazardous Location LED Lighting Industry Analysis, Insights and Forecast, 2021-2033
- 6.1. Market Analysis, Insights and Forecast - by Device Type
- 6.1.1. Zone 0
- 6.1.2. Zone 20
- 6.1.3. Zone 1
- 6.1.4. Zone 21
- 6.1.5. Zone 22
- 6.2. Market Analysis, Insights and Forecast - by End-User Vertical
- 6.2.1. Oil and Gas
- 6.2.2. Petro Chemical
- 6.2.3. Industrial
- 6.2.4. Power Generation
- 6.2.5. Pharmaceutical
- 6.2.6. Processing
- 6.2.7. Other End-user Industries
- 6.1. Market Analysis, Insights and Forecast - by Device Type
- 7. North America US Hazardous Location LED Lighting Industry Analysis, Insights and Forecast, 2020-2032
- 7.1. Market Analysis, Insights and Forecast - by Device Type
- 7.1.1. Zone 0
- 7.1.2. Zone 20
- 7.1.3. Zone 1
- 7.1.4. Zone 21
- 7.1.5. Zone 22
- 7.2. Market Analysis, Insights and Forecast - by End-User Vertical
- 7.2.1. Oil and Gas
- 7.2.2. Petro Chemical
- 7.2.3. Industrial
- 7.2.4. Power Generation
- 7.2.5. Pharmaceutical
- 7.2.6. Processing
- 7.2.7. Other End-user Industries
- 7.1. Market Analysis, Insights and Forecast - by Device Type
- 8. South America US Hazardous Location LED Lighting Industry Analysis, Insights and Forecast, 2020-2032
- 8.1. Market Analysis, Insights and Forecast - by Device Type
- 8.1.1. Zone 0
- 8.1.2. Zone 20
- 8.1.3. Zone 1
- 8.1.4. Zone 21
- 8.1.5. Zone 22
- 8.2. Market Analysis, Insights and Forecast - by End-User Vertical
- 8.2.1. Oil and Gas
- 8.2.2. Petro Chemical
- 8.2.3. Industrial
- 8.2.4. Power Generation
- 8.2.5. Pharmaceutical
- 8.2.6. Processing
- 8.2.7. Other End-user Industries
- 8.1. Market Analysis, Insights and Forecast - by Device Type
- 9. Europe US Hazardous Location LED Lighting Industry Analysis, Insights and Forecast, 2020-2032
- 9.1. Market Analysis, Insights and Forecast - by Device Type
- 9.1.1. Zone 0
- 9.1.2. Zone 20
- 9.1.3. Zone 1
- 9.1.4. Zone 21
- 9.1.5. Zone 22
- 9.2. Market Analysis, Insights and Forecast - by End-User Vertical
- 9.2.1. Oil and Gas
- 9.2.2. Petro Chemical
- 9.2.3. Industrial
- 9.2.4. Power Generation
- 9.2.5. Pharmaceutical
- 9.2.6. Processing
- 9.2.7. Other End-user Industries
- 9.1. Market Analysis, Insights and Forecast - by Device Type
- 10. Middle East & Africa US Hazardous Location LED Lighting Industry Analysis, Insights and Forecast, 2020-2032
- 10.1. Market Analysis, Insights and Forecast - by Device Type
- 10.1.1. Zone 0
- 10.1.2. Zone 20
- 10.1.3. Zone 1
- 10.1.4. Zone 21
- 10.1.5. Zone 22
- 10.2. Market Analysis, Insights and Forecast - by End-User Vertical
- 10.2.1. Oil and Gas
- 10.2.2. Petro Chemical
- 10.2.3. Industrial
- 10.2.4. Power Generation
- 10.2.5. Pharmaceutical
- 10.2.6. Processing
- 10.2.7. Other End-user Industries
- 10.1. Market Analysis, Insights and Forecast - by Device Type
- 11. Asia Pacific US Hazardous Location LED Lighting Industry Analysis, Insights and Forecast, 2020-2032
- 11.1. Market Analysis, Insights and Forecast - by Device Type
- 11.1.1. Zone 0
- 11.1.2. Zone 20
- 11.1.3. Zone 1
- 11.1.4. Zone 21
- 11.1.5. Zone 22
- 11.2. Market Analysis, Insights and Forecast - by End-User Vertical
- 11.2.1. Oil and Gas
- 11.2.2. Petro Chemical
- 11.2.3. Industrial
- 11.2.4. Power Generation
- 11.2.5. Pharmaceutical
- 11.2.6. Processing
- 11.2.7. Other End-user Industries
- 11.1. Market Analysis, Insights and Forecast - by Device Type
- 12. Competitive Analysis
- 12.1. Company Profiles
- 12.1.1 Nemalux Inc
- 12.1.1.1. Company Overview
- 12.1.1.2. Products
- 12.1.1.3. Company Financials
- 12.1.1.4. SWOT Analysis
- 12.1.2 ABB Installation Products Inc
- 12.1.2.1. Company Overview
- 12.1.2.2. Products
- 12.1.2.3. Company Financials
- 12.1.2.4. SWOT Analysis
- 12.1.3 Azz Inc
- 12.1.3.1. Company Overview
- 12.1.3.2. Products
- 12.1.3.3. Company Financials
- 12.1.3.4. SWOT Analysis
- 12.1.4 Worksite Lighting LLC*List Not Exhaustive
- 12.1.4.1. Company Overview
- 12.1.4.2. Products
- 12.1.4.3. Company Financials
- 12.1.4.4. SWOT Analysis
- 12.1.5 Larson Electronics
- 12.1.5.1. Company Overview
- 12.1.5.2. Products
- 12.1.5.3. Company Financials
- 12.1.5.4. SWOT Analysis
- 12.1.6 GE Current
- 12.1.6.1. Company Overview
- 12.1.6.2. Products
- 12.1.6.3. Company Financials
- 12.1.6.4. SWOT Analysis
- 12.1.7 Hubbell Limited
- 12.1.7.1. Company Overview
- 12.1.7.2. Products
- 12.1.7.3. Company Financials
- 12.1.7.4. SWOT Analysis
- 12.1.8 Emerson Electric Co
- 12.1.8.1. Company Overview
- 12.1.8.2. Products
- 12.1.8.3. Company Financials
- 12.1.8.4. SWOT Analysis
- 12.1.9 Digital Lumens Inc (OSRAM)
- 12.1.9.1. Company Overview
- 12.1.9.2. Products
- 12.1.9.3. Company Financials
- 12.1.9.4. SWOT Analysis
- 12.1.10 Eaton Corporation
- 12.1.10.1. Company Overview
- 12.1.10.2. Products
- 12.1.10.3. Company Financials
- 12.1.10.4. SWOT Analysis
- 12.1.1 Nemalux Inc
- 12.2. Market Entropy
- 12.2.1 Company's Key Areas Served
- 12.2.2 Recent Developments
- 12.3. Company Market Share Analysis 2025
- 12.3.1 Top 5 Companies Market Share Analysis
- 12.3.2 Top 3 Companies Market Share Analysis
- 12.4. List of Potential Customers
- 13. Research Methodology
List of Figures
- Figure 1: Global US Hazardous Location LED Lighting Industry Revenue Breakdown (undefined, %) by Region 2025 & 2033
- Figure 2: North America US Hazardous Location LED Lighting Industry Revenue (undefined), by Device Type 2025 & 2033
- Figure 3: North America US Hazardous Location LED Lighting Industry Revenue Share (%), by Device Type 2025 & 2033
- Figure 4: North America US Hazardous Location LED Lighting Industry Revenue (undefined), by End-User Vertical 2025 & 2033
- Figure 5: North America US Hazardous Location LED Lighting Industry Revenue Share (%), by End-User Vertical 2025 & 2033
- Figure 6: North America US Hazardous Location LED Lighting Industry Revenue (undefined), by Country 2025 & 2033
- Figure 7: North America US Hazardous Location LED Lighting Industry Revenue Share (%), by Country 2025 & 2033
- Figure 8: South America US Hazardous Location LED Lighting Industry Revenue (undefined), by Device Type 2025 & 2033
- Figure 9: South America US Hazardous Location LED Lighting Industry Revenue Share (%), by Device Type 2025 & 2033
- Figure 10: South America US Hazardous Location LED Lighting Industry Revenue (undefined), by End-User Vertical 2025 & 2033
- Figure 11: South America US Hazardous Location LED Lighting Industry Revenue Share (%), by End-User Vertical 2025 & 2033
- Figure 12: South America US Hazardous Location LED Lighting Industry Revenue (undefined), by Country 2025 & 2033
- Figure 13: South America US Hazardous Location LED Lighting Industry Revenue Share (%), by Country 2025 & 2033
- Figure 14: Europe US Hazardous Location LED Lighting Industry Revenue (undefined), by Device Type 2025 & 2033
- Figure 15: Europe US Hazardous Location LED Lighting Industry Revenue Share (%), by Device Type 2025 & 2033
- Figure 16: Europe US Hazardous Location LED Lighting Industry Revenue (undefined), by End-User Vertical 2025 & 2033
- Figure 17: Europe US Hazardous Location LED Lighting Industry Revenue Share (%), by End-User Vertical 2025 & 2033
- Figure 18: Europe US Hazardous Location LED Lighting Industry Revenue (undefined), by Country 2025 & 2033
- Figure 19: Europe US Hazardous Location LED Lighting Industry Revenue Share (%), by Country 2025 & 2033
- Figure 20: Middle East & Africa US Hazardous Location LED Lighting Industry Revenue (undefined), by Device Type 2025 & 2033
- Figure 21: Middle East & Africa US Hazardous Location LED Lighting Industry Revenue Share (%), by Device Type 2025 & 2033
- Figure 22: Middle East & Africa US Hazardous Location LED Lighting Industry Revenue (undefined), by End-User Vertical 2025 & 2033
- Figure 23: Middle East & Africa US Hazardous Location LED Lighting Industry Revenue Share (%), by End-User Vertical 2025 & 2033
- Figure 24: Middle East & Africa US Hazardous Location LED Lighting Industry Revenue (undefined), by Country 2025 & 2033
- Figure 25: Middle East & Africa US Hazardous Location LED Lighting Industry Revenue Share (%), by Country 2025 & 2033
- Figure 26: Asia Pacific US Hazardous Location LED Lighting Industry Revenue (undefined), by Device Type 2025 & 2033
- Figure 27: Asia Pacific US Hazardous Location LED Lighting Industry Revenue Share (%), by Device Type 2025 & 2033
- Figure 28: Asia Pacific US Hazardous Location LED Lighting Industry Revenue (undefined), by End-User Vertical 2025 & 2033
- Figure 29: Asia Pacific US Hazardous Location LED Lighting Industry Revenue Share (%), by End-User Vertical 2025 & 2033
- Figure 30: Asia Pacific US Hazardous Location LED Lighting Industry Revenue (undefined), by Country 2025 & 2033
- Figure 31: Asia Pacific US Hazardous Location LED Lighting Industry Revenue Share (%), by Country 2025 & 2033
List of Tables
- Table 1: Global US Hazardous Location LED Lighting Industry Revenue undefined Forecast, by Device Type 2020 & 2033
- Table 2: Global US Hazardous Location LED Lighting Industry Revenue undefined Forecast, by End-User Vertical 2020 & 2033
- Table 3: Global US Hazardous Location LED Lighting Industry Revenue undefined Forecast, by Region 2020 & 2033
- Table 4: Global US Hazardous Location LED Lighting Industry Revenue undefined Forecast, by Device Type 2020 & 2033
- Table 5: Global US Hazardous Location LED Lighting Industry Revenue undefined Forecast, by End-User Vertical 2020 & 2033
- Table 6: Global US Hazardous Location LED Lighting Industry Revenue undefined Forecast, by Country 2020 & 2033
- Table 7: United States US Hazardous Location LED Lighting Industry Revenue (undefined) Forecast, by Application 2020 & 2033
- Table 8: Canada US Hazardous Location LED Lighting Industry Revenue (undefined) Forecast, by Application 2020 & 2033
- Table 9: Mexico US Hazardous Location LED Lighting Industry Revenue (undefined) Forecast, by Application 2020 & 2033
- Table 10: Global US Hazardous Location LED Lighting Industry Revenue undefined Forecast, by Device Type 2020 & 2033
- Table 11: Global US Hazardous Location LED Lighting Industry Revenue undefined Forecast, by End-User Vertical 2020 & 2033
- Table 12: Global US Hazardous Location LED Lighting Industry Revenue undefined Forecast, by Country 2020 & 2033
- Table 13: Brazil US Hazardous Location LED Lighting Industry Revenue (undefined) Forecast, by Application 2020 & 2033
- Table 14: Argentina US Hazardous Location LED Lighting Industry Revenue (undefined) Forecast, by Application 2020 & 2033
- Table 15: Rest of South America US Hazardous Location LED Lighting Industry Revenue (undefined) Forecast, by Application 2020 & 2033
- Table 16: Global US Hazardous Location LED Lighting Industry Revenue undefined Forecast, by Device Type 2020 & 2033
- Table 17: Global US Hazardous Location LED Lighting Industry Revenue undefined Forecast, by End-User Vertical 2020 & 2033
- Table 18: Global US Hazardous Location LED Lighting Industry Revenue undefined Forecast, by Country 2020 & 2033
- Table 19: United Kingdom US Hazardous Location LED Lighting Industry Revenue (undefined) Forecast, by Application 2020 & 2033
- Table 20: Germany US Hazardous Location LED Lighting Industry Revenue (undefined) Forecast, by Application 2020 & 2033
- Table 21: France US Hazardous Location LED Lighting Industry Revenue (undefined) Forecast, by Application 2020 & 2033
- Table 22: Italy US Hazardous Location LED Lighting Industry Revenue (undefined) Forecast, by Application 2020 & 2033
- Table 23: Spain US Hazardous Location LED Lighting Industry Revenue (undefined) Forecast, by Application 2020 & 2033
- Table 24: Russia US Hazardous Location LED Lighting Industry Revenue (undefined) Forecast, by Application 2020 & 2033
- Table 25: Benelux US Hazardous Location LED Lighting Industry Revenue (undefined) Forecast, by Application 2020 & 2033
- Table 26: Nordics US Hazardous Location LED Lighting Industry Revenue (undefined) Forecast, by Application 2020 & 2033
- Table 27: Rest of Europe US Hazardous Location LED Lighting Industry Revenue (undefined) Forecast, by Application 2020 & 2033
- Table 28: Global US Hazardous Location LED Lighting Industry Revenue undefined Forecast, by Device Type 2020 & 2033
- Table 29: Global US Hazardous Location LED Lighting Industry Revenue undefined Forecast, by End-User Vertical 2020 & 2033
- Table 30: Global US Hazardous Location LED Lighting Industry Revenue undefined Forecast, by Country 2020 & 2033
- Table 31: Turkey US Hazardous Location LED Lighting Industry Revenue (undefined) Forecast, by Application 2020 & 2033
- Table 32: Israel US Hazardous Location LED Lighting Industry Revenue (undefined) Forecast, by Application 2020 & 2033
- Table 33: GCC US Hazardous Location LED Lighting Industry Revenue (undefined) Forecast, by Application 2020 & 2033
- Table 34: North Africa US Hazardous Location LED Lighting Industry Revenue (undefined) Forecast, by Application 2020 & 2033
- Table 35: South Africa US Hazardous Location LED Lighting Industry Revenue (undefined) Forecast, by Application 2020 & 2033
- Table 36: Rest of Middle East & Africa US Hazardous Location LED Lighting Industry Revenue (undefined) Forecast, by Application 2020 & 2033
- Table 37: Global US Hazardous Location LED Lighting Industry Revenue undefined Forecast, by Device Type 2020 & 2033
- Table 38: Global US Hazardous Location LED Lighting Industry Revenue undefined Forecast, by End-User Vertical 2020 & 2033
- Table 39: Global US Hazardous Location LED Lighting Industry Revenue undefined Forecast, by Country 2020 & 2033
- Table 40: China US Hazardous Location LED Lighting Industry Revenue (undefined) Forecast, by Application 2020 & 2033
- Table 41: India US Hazardous Location LED Lighting Industry Revenue (undefined) Forecast, by Application 2020 & 2033
- Table 42: Japan US Hazardous Location LED Lighting Industry Revenue (undefined) Forecast, by Application 2020 & 2033
- Table 43: South Korea US Hazardous Location LED Lighting Industry Revenue (undefined) Forecast, by Application 2020 & 2033
- Table 44: ASEAN US Hazardous Location LED Lighting Industry Revenue (undefined) Forecast, by Application 2020 & 2033
- Table 45: Oceania US Hazardous Location LED Lighting Industry Revenue (undefined) Forecast, by Application 2020 & 2033
- Table 46: Rest of Asia Pacific US Hazardous Location LED Lighting Industry Revenue (undefined) Forecast, by Application 2020 & 2033
Frequently Asked Questions
1. What is the projected Compound Annual Growth Rate (CAGR) of the US Hazardous Location LED Lighting Industry?
The projected CAGR is approximately 8%.
2. Which companies are prominent players in the US Hazardous Location LED Lighting Industry?
Key companies in the market include Nemalux Inc, ABB Installation Products Inc, Azz Inc, Worksite Lighting LLC*List Not Exhaustive, Larson Electronics, GE Current, Hubbell Limited, Emerson Electric Co, Digital Lumens Inc (OSRAM), Eaton Corporation.
3. What are the main segments of the US Hazardous Location LED Lighting Industry?
The market segments include Device Type, End-User Vertical.
4. Can you provide details about the market size?
The market size is estimated to be USD XXX N/A as of 2022.
5. What are some drivers contributing to market growth?
; Regulations Promoting Proper Lighting for Worker Safety in Hazardous Locations; Rising Demand for Cost-effective and Energy-efficient LED Lighting Solution.
6. What are the notable trends driving market growth?
Increasing Demand for Low-Cost. Low-Energy LED Lighting Solutions.
7. Are there any restraints impacting market growth?
Security and Privacy Concerns Due To Communication Technology.
8. Can you provide examples of recent developments in the market?
N/A
9. What pricing options are available for accessing the report?
Pricing options include single-user, multi-user, and enterprise licenses priced at USD 3800, USD 4500, and USD 5800 respectively.
10. Is the market size provided in terms of value or volume?
The market size is provided in terms of value, measured in N/A.
11. Are there any specific market keywords associated with the report?
Yes, the market keyword associated with the report is "US Hazardous Location LED Lighting Industry," which aids in identifying and referencing the specific market segment covered.
12. How do I determine which pricing option suits my needs best?
The pricing options vary based on user requirements and access needs. Individual users may opt for single-user licenses, while businesses requiring broader access may choose multi-user or enterprise licenses for cost-effective access to the report.
13. Are there any additional resources or data provided in the US Hazardous Location LED Lighting Industry report?
While the report offers comprehensive insights, it's advisable to review the specific contents or supplementary materials provided to ascertain if additional resources or data are available.
14. How can I stay updated on further developments or reports in the US Hazardous Location LED Lighting Industry?
To stay informed about further developments, trends, and reports in the US Hazardous Location LED Lighting Industry, consider subscribing to industry newsletters, following relevant companies and organizations, or regularly checking reputable industry news sources and publications.
Methodology
Step 1 - Identification of Relevant Samples Size from Population Database


Step 2 - Approaches for Defining Global Market Size (Value, Volume* & Price*)

Note*: In applicable scenarios
Step 3 - Data Sources
Primary Research
- Web Analytics
- Survey Reports
- Research Institute
- Latest Research Reports
- Opinion Leaders
Secondary Research
- Annual Reports
- White Paper
- Latest Press Release
- Industry Association
- Paid Database
- Investor Presentations

Step 4 - Data Triangulation
Involves using different sources of information in order to increase the validity of a study
These sources are likely to be stakeholders in a program - participants, other researchers, program staff, other community members, and so on.
Then we put all data in single framework & apply various statistical tools to find out the dynamic on the market.
During the analysis stage, feedback from the stakeholder groups would be compared to determine areas of agreement as well as areas of divergence