

Key Insights
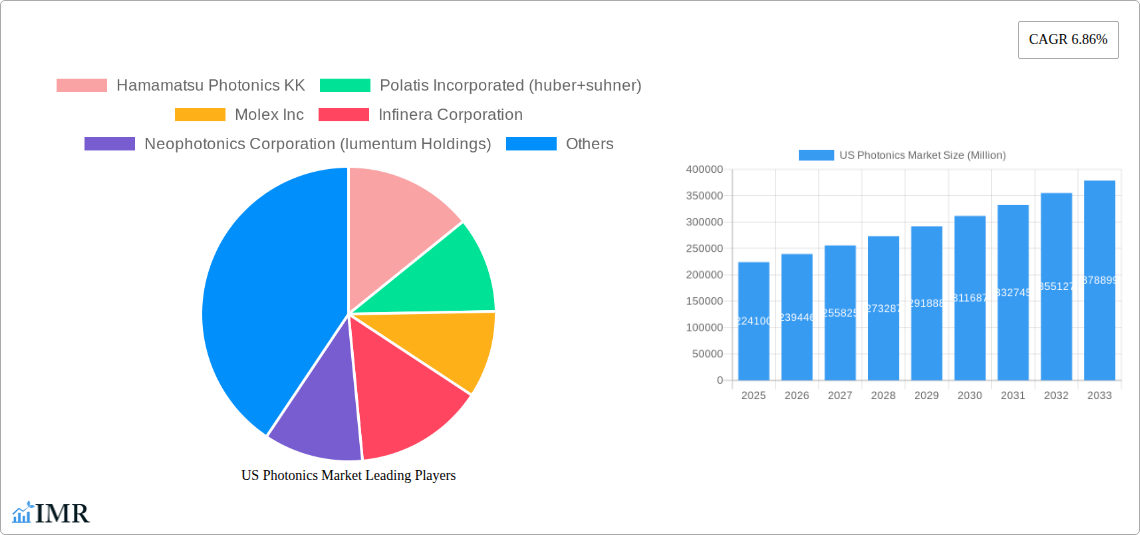
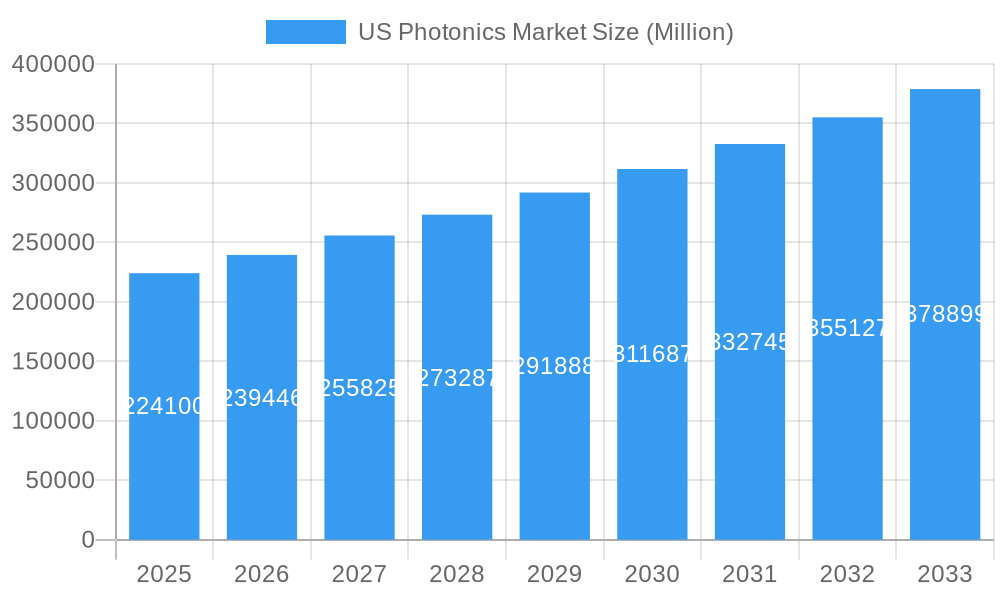
The U.S. photonics market is poised for significant expansion, driven by the intrinsic properties of light and its burgeoning applications across diverse sectors. With a current market size estimated at $224.1 billion in 2025 and a projected Compound Annual Growth Rate (CAGR) of 6.84% through 2033, the industry demonstrates robust momentum. This growth is propelled by advancements in key areas such as quantum computing, advanced sensing technologies for autonomous vehicles and industrial automation, and the ever-increasing demand for high-speed data transmission powered by optical networks. The increasing integration of photonics in medical devices for diagnostics and therapeutics, alongside the evolution of solid-state lighting and augmented reality applications, further fuels this optimistic trajectory.
US Photonics Market Market Size (In Billion)
Leading companies like Hamamatsu Photonics, Intel, and Coherent Corp are at the forefront, innovating in areas such as laser technology, optical sensors, and photonic integrated circuits. The photonics ecosystem benefits from substantial research and development investments, fostered by government initiatives and private sector collaborations aimed at maintaining a competitive edge in critical technologies. While the market enjoys strong drivers, potential restraints such as the high cost of initial investment for certain advanced photonic systems and the need for specialized skilled labor in manufacturing and research could present challenges. Nevertheless, the fundamental advantages of photonics, including its speed, efficiency, and inherent security, ensure its continued indispensability in shaping the future of technology and industry.
US Photonics Market Company Market Share
US Photonics Market Report: Comprehensive Analysis & Future Outlook (2019-2033)
This in-depth report delivers a definitive analysis of the US Photonics Market, encompassing market dynamics, growth trends, regional dominance, product landscape, key drivers, emerging opportunities, and a detailed player analysis. Covering the historical period of 2019-2024, base year 2025, and a comprehensive forecast period of 2025-2033, this report provides critical insights for stakeholders in advanced photonics, optical technologies, and related industries. We delve into parent and child market segments, offering a holistic view of the sector's evolution and future potential, with all values presented in billions of USD.
US Photonics Market Market Dynamics & Structure
The US Photonics market is characterized by a dynamic interplay of technological innovation and robust end-user demand. Market concentration varies across segments, with specialized niches exhibiting higher concentration due to proprietary technologies and significant R&D investments. Key drivers include the relentless pursuit of higher bandwidth in data communication, advancements in medical imaging and diagnostics, and the critical role of photonics in advanced manufacturing and surveying and detection applications. Regulatory frameworks, particularly those concerning export controls and intellectual property, play a significant role in shaping market access and competition. The competitive landscape features both established giants and agile startups, with a constant stream of new product development and technology adoption. Substitute products, while present in some lower-end applications, often lack the precision, speed, and efficiency offered by photonic solutions. End-user demographics are broad, spanning telecommunications, healthcare, defense, automotive, and industrial sectors, each with unique purchasing patterns and technology requirements. Mergers and acquisitions (M&A) are an active trend, as larger companies seek to consolidate market share, acquire cutting-edge technologies, and expand their product portfolios. For instance, the acquisition of smaller innovators by established players aims to streamline supply chains and accelerate time-to-market. Barriers to entry are primarily high R&D costs, complex manufacturing processes, and the need for specialized expertise.
- Market Concentration: Moderate to high in specific segments like fiber optics and laser manufacturing.
- Technological Innovation Drivers: Miniaturization of components, increased data speeds, enhanced imaging resolution, energy efficiency.
- Regulatory Frameworks: Impact on R&D funding, export controls, and industry standards.
- Competitive Product Substitutes: Limited in high-performance applications; more prevalent in general lighting and basic sensing.
- End-User Demographics: Diversified across telecommunications, healthcare, industrial automation, automotive, and defense.
- M&A Trends: Driven by technology acquisition, market consolidation, and vertical integration.
US Photonics Market Growth Trends & Insights
The US Photonics Market is poised for substantial expansion, fueled by transformative technological advancements and escalating demand across diverse industries. The market size is projected to grow from an estimated $XX billion in 2024 to $XX billion by 2033, exhibiting a Compound Annual Growth Rate (CAGR) of XX% during the forecast period. This growth is underpinned by a surge in the adoption of photonic solutions in critical sectors. In data communication, the insatiable demand for higher bandwidth, driven by cloud computing, 5G deployment, and the Internet of Things (IoT), necessitates advanced optical networking solutions, propelling the market forward. The medical technology segment is experiencing significant traction due to the increasing use of photonics in diagnostics, imaging (e.g., optical coherence tomography), minimally invasive surgery, and drug discovery. Furthermore, the evolution of production technology, particularly in areas like laser-based manufacturing, additive manufacturing (3D printing), and precision robotics, is a major growth catalyst. Image capture and display technologies are also benefiting from advancements in high-resolution sensors and immersive display systems, finding applications in consumer electronics, automotive, and augmented/virtual reality. The market penetration of advanced photonic components is expected to deepen as costs decrease and performance capabilities continue to improve. Technological disruptions, such as the development of new laser sources, advanced optical fibers, and novel photodetectors, are constantly reshaping the competitive landscape and creating new market opportunities. Consumer behavior shifts, including a preference for faster, more efficient, and data-intensive technologies, indirectly contribute to the demand for photonics. For example, the proliferation of high-definition streaming and online gaming directly translates to increased demand for robust fiber optic communication infrastructure. The integration of photonics in emerging fields like quantum computing and advanced sensing further underscores its transformative potential. The consistent investment in research and development by leading photonics companies is a key indicator of sustained innovation and future market expansion.
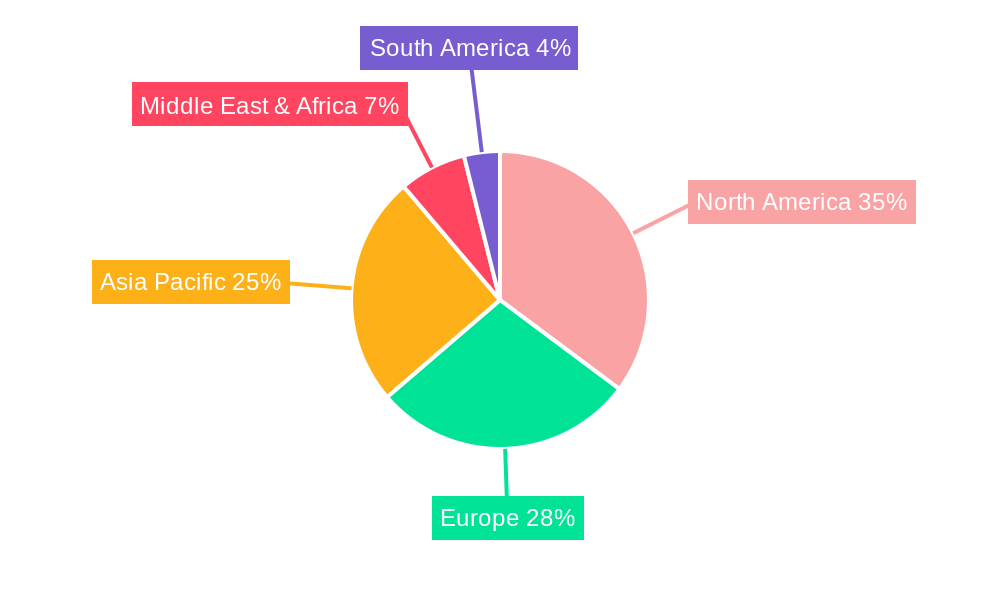
Dominant Regions, Countries, or Segments in US Photonics Market
Within the US Photonics Market, Data Communication stands out as a dominant segment, driving significant growth and innovation. This supremacy is attributed to the relentless demand for faster, more reliable, and higher-capacity data transmission across the nation. The proliferation of 5G networks, the expansion of cloud infrastructure, and the burgeoning IoT ecosystem are all heavily reliant on advanced photonic components and systems. The US government's strategic investments in broadband infrastructure and the increasing adoption of fiber-to-the-home (FTTH) initiatives further bolster the dominance of this segment. Furthermore, the ongoing digital transformation across all industries necessitates continuous upgrades and expansion of data communication networks, creating a sustained demand for photonic solutions.
- Data Communication Dominance:
- Market Share: Estimated to hold approximately XX% of the total US Photonics Market by 2025.
- Key Drivers: 5G deployment, cloud computing growth, IoT expansion, FTTH initiatives, increasing data traffic.
- Economic Policies: Government funding for broadband expansion and digital infrastructure development.
- Infrastructure Development: Significant investment in laying fiber optic cables and upgrading network capacities.
- Technological Advancements: Development of higher-speed transceivers, optical switches, and wavelength-division multiplexing (WDM) technologies.
- Growth Potential: High, driven by the ever-increasing need for bandwidth and connectivity.
While Data Communication leads, other segments like Medical Technology and Production Technology are exhibiting strong growth trajectories. Medical applications, including advanced diagnostics, imaging, and laser surgery, are benefiting from an aging population and increasing healthcare expenditure. Production technology, encompassing laser processing, advanced sensing for automation, and machine vision, is crucial for the reshoring of manufacturing and the enhancement of industrial efficiency. The "Other Applications" segment also encompasses emerging areas like defense, automotive (LiDAR, sensors), and consumer electronics, contributing to the overall market dynamism. The US, as a global hub for technological innovation, benefits from a robust ecosystem that supports the development and commercialization of photonic technologies across all these vital segments.
US Photonics Market Product Landscape
The US Photonics market is characterized by a continuous stream of product innovations designed to enhance performance, efficiency, and functionality. Key product categories include advanced lasers for industrial processing and medical applications, high-speed optical transceivers for data communication, sensitive photodetectors for imaging and sensing, and sophisticated optical components such as lenses, filters, and waveguides. Recent advancements have focused on miniaturization, power efficiency, and integration capabilities. For example, the development of compact, high-power fiber lasers is revolutionizing manufacturing, while novel semiconductor-based photonics are enabling more integrated and cost-effective communication systems. Innovations in areas like plasmonics and metamaterials are paving the way for entirely new applications in sensing and imaging.
Key Drivers, Barriers & Challenges in US Photonics Market
Key Drivers: The US Photonics market is propelled by several key drivers. Technological advancements in areas like laser technology, optical fibers, and semiconductor photonics are creating new possibilities and improving existing applications. The increasing demand for high-speed data communication, fueled by 5G, cloud computing, and IoT, is a major catalyst. The growing adoption of photonics in medical imaging, diagnostics, and minimally invasive surgery, driven by an aging population and advancements in healthcare, is another significant factor. Furthermore, the need for precision and automation in manufacturing, defense, and automotive sectors, where photonics plays a crucial role in sensing and processing, contributes to market growth.
Barriers & Challenges: Despite the robust growth, the market faces several challenges. High research and development costs and the lengthy product development cycles can act as barriers to entry for new players. The intricate nature of photonic manufacturing requires specialized expertise and significant capital investment. Supply chain disruptions, particularly for critical raw materials and specialized components, can impact production and lead times. Intense global competition, with strong players from Asia, also poses a challenge. Furthermore, the need for standardization across various photonic technologies and applications can sometimes slow down adoption. Regulatory hurdles related to intellectual property and export controls can also add complexity.
Emerging Opportunities in US Photonics Market
Emerging opportunities in the US Photonics market are abundant, particularly in the realms of advanced sensing, quantum technologies, and next-generation displays. The burgeoning field of autonomous vehicles, requiring sophisticated LiDAR and optical sensor systems, presents a significant growth avenue. Quantum computing and communication, while still in their nascent stages, rely heavily on photonic principles and offer transformative long-term potential. The expansion of augmented reality (AR) and virtual reality (VR) technologies will drive demand for advanced optical components for displays and tracking systems. Furthermore, the application of photonics in areas like environmental monitoring, security, and industrial inspection is gaining traction, opening up new niche markets.
Growth Accelerators in the US Photonics Market Industry
Several catalysts are accelerating the growth of the US Photonics Market. Continuous investment in research and development by both government agencies and private companies is a primary accelerator, fostering innovation and the creation of disruptive technologies. Strategic partnerships and collaborations between research institutions, component manufacturers, and system integrators are crucial for translating laboratory breakthroughs into commercially viable products. The increasing demand for energy-efficient solutions across all sectors also favors photonics, which often offers lower power consumption compared to traditional technologies. Furthermore, the growing trend of miniaturization and integration of photonic components into smaller, more powerful devices is expanding their applicability and market reach.
Key Players Shaping the US Photonics Market Market
- Hamamatsu Photonics KK
- Polatis Incorporated (huber+suhner)
- Molex Inc
- Infinera Corporation
- Neophotonics Corporation (lumentum Holdings)
- ams OSRAM AG
- Vescent Photonics LLC
- NEC Corporation
- Alcatel-lucent SA (Nokia Corporation)
- Photonic Systems Inc
- Coherent Inc (Coherent Corp)
- Trumpf Group
- Thorlabs Inc
- Intel Corporation
- IPG Photonics
Notable Milestones in US Photonics Market Sector
- June 2023: IPG Photonics showcased its latest technologies for e-mobility manufacturing, materials processing, and specialized applications. The company also introduced its "Cold Oven" laser diode heating technology, offering faster and more energy-efficient thermal processing.
- February 2023: Hamamatsu Photonics developed an optical transceiver (P16671-01AS) achieving 1.25 Gbps data transmission speeds, leveraging their opto-semiconductor manufacturing expertise.
In-Depth US Photonics Market Market Outlook
The US Photonics Market is set for robust and sustained growth, driven by a confluence of technological advancements, expanding applications, and increasing market penetration. Future market potential is immense, fueled by the critical role of photonics in enabling next-generation technologies such as AI, quantum computing, and advanced healthcare solutions. Strategic opportunities lie in further developing integrated photonic circuits, exploring new applications in biophotonics, and contributing to the expansion of high-speed communication infrastructure. The market is expected to witness continued innovation, with a focus on developing more compact, efficient, and cost-effective photonic devices and systems that cater to the evolving needs of a digitally driven economy.
US Photonics Market Segmentation
-
1. Application
- 1.1. Surveying And Detection
- 1.2. Production Technology
- 1.3. Data Communication
- 1.4. Image Capture and Display
- 1.5. Medical Technology
- 1.6. Lighting
- 1.7. Other Applications
US Photonics Market Segmentation By Geography
-
1. North America
- 1.1. United States
- 1.2. Canada
- 1.3. Mexico
-
2. South America
- 2.1. Brazil
- 2.2. Argentina
- 2.3. Rest of South America
-
3. Europe
- 3.1. United Kingdom
- 3.2. Germany
- 3.3. France
- 3.4. Italy
- 3.5. Spain
- 3.6. Russia
- 3.7. Benelux
- 3.8. Nordics
- 3.9. Rest of Europe
-
4. Middle East & Africa
- 4.1. Turkey
- 4.2. Israel
- 4.3. GCC
- 4.4. North Africa
- 4.5. South Africa
- 4.6. Rest of Middle East & Africa
-
5. Asia Pacific
- 5.1. China
- 5.2. India
- 5.3. Japan
- 5.4. South Korea
- 5.5. ASEAN
- 5.6. Oceania
- 5.7. Rest of Asia Pacific
US Photonics Market Regional Market Share
Geographic Coverage of US Photonics Market
US Photonics Market REPORT HIGHLIGHTS
| Aspects | Details |
|---|---|
| Study Period | 2020-2034 |
| Base Year | 2025 |
| Estimated Year | 2026 |
| Forecast Period | 2026-2034 |
| Historical Period | 2020-2025 |
| Growth Rate | CAGR of 6.3% from 2020-2034 |
| Segmentation |
|
Table of Contents
- 1. Introduction
- 1.1. Research Scope
- 1.2. Market Segmentation
- 1.3. Research Objective
- 1.4. Definitions and Assumptions
- 2. Executive Summary
- 2.1. Market Snapshot
- 3. Market Dynamics
- 3.1. Market Drivers
- 3.2. Market Restrains
- 3.3. Market Trends
- 3.4. Market Opportunities
- 4. Market Factor Analysis
- 4.1. Porters Five Forces
- 4.1.1. Bargaining Power of Suppliers
- 4.1.2. Bargaining Power of Buyers
- 4.1.3. Threat of New Entrants
- 4.1.4. Threat of Substitutes
- 4.1.5. Competitive Rivalry
- 4.2. PESTEL analysis
- 4.3. BCG Analysis
- 4.3.1. Stars (High Growth, High Market Share)
- 4.3.2. Cash Cows (Low Growth, High Market Share)
- 4.3.3. Question Mark (High Growth, Low Market Share)
- 4.3.4. Dogs (Low Growth, Low Market Share)
- 4.4. Ansoff Matrix Analysis
- 4.5. Supply Chain Analysis
- 4.6. Regulatory Landscape
- 4.7. Current Market Potential and Opportunity Assessment (TAM–SAM–SOM Framework)
- 4.8. IMR Analyst Note
- 4.1. Porters Five Forces
- 5. Market Analysis, Insights and Forecast 2021-2033
- 5.1. Market Analysis, Insights and Forecast - by Application
- 5.1.1. Surveying And Detection
- 5.1.2. Production Technology
- 5.1.3. Data Communication
- 5.1.4. Image Capture and Display
- 5.1.5. Medical Technology
- 5.1.6. Lighting
- 5.1.7. Other Applications
- 5.2. Market Analysis, Insights and Forecast - by Region
- 5.2.1. North America
- 5.2.2. South America
- 5.2.3. Europe
- 5.2.4. Middle East & Africa
- 5.2.5. Asia Pacific
- 5.1. Market Analysis, Insights and Forecast - by Application
- 6. Global US Photonics Market Analysis, Insights and Forecast, 2021-2033
- 6.1. Market Analysis, Insights and Forecast - by Application
- 6.1.1. Surveying And Detection
- 6.1.2. Production Technology
- 6.1.3. Data Communication
- 6.1.4. Image Capture and Display
- 6.1.5. Medical Technology
- 6.1.6. Lighting
- 6.1.7. Other Applications
- 6.1. Market Analysis, Insights and Forecast - by Application
- 7. North America US Photonics Market Analysis, Insights and Forecast, 2020-2032
- 7.1. Market Analysis, Insights and Forecast - by Application
- 7.1.1. Surveying And Detection
- 7.1.2. Production Technology
- 7.1.3. Data Communication
- 7.1.4. Image Capture and Display
- 7.1.5. Medical Technology
- 7.1.6. Lighting
- 7.1.7. Other Applications
- 7.1. Market Analysis, Insights and Forecast - by Application
- 8. South America US Photonics Market Analysis, Insights and Forecast, 2020-2032
- 8.1. Market Analysis, Insights and Forecast - by Application
- 8.1.1. Surveying And Detection
- 8.1.2. Production Technology
- 8.1.3. Data Communication
- 8.1.4. Image Capture and Display
- 8.1.5. Medical Technology
- 8.1.6. Lighting
- 8.1.7. Other Applications
- 8.1. Market Analysis, Insights and Forecast - by Application
- 9. Europe US Photonics Market Analysis, Insights and Forecast, 2020-2032
- 9.1. Market Analysis, Insights and Forecast - by Application
- 9.1.1. Surveying And Detection
- 9.1.2. Production Technology
- 9.1.3. Data Communication
- 9.1.4. Image Capture and Display
- 9.1.5. Medical Technology
- 9.1.6. Lighting
- 9.1.7. Other Applications
- 9.1. Market Analysis, Insights and Forecast - by Application
- 10. Middle East & Africa US Photonics Market Analysis, Insights and Forecast, 2020-2032
- 10.1. Market Analysis, Insights and Forecast - by Application
- 10.1.1. Surveying And Detection
- 10.1.2. Production Technology
- 10.1.3. Data Communication
- 10.1.4. Image Capture and Display
- 10.1.5. Medical Technology
- 10.1.6. Lighting
- 10.1.7. Other Applications
- 10.1. Market Analysis, Insights and Forecast - by Application
- 11. Asia Pacific US Photonics Market Analysis, Insights and Forecast, 2020-2032
- 11.1. Market Analysis, Insights and Forecast - by Application
- 11.1.1. Surveying And Detection
- 11.1.2. Production Technology
- 11.1.3. Data Communication
- 11.1.4. Image Capture and Display
- 11.1.5. Medical Technology
- 11.1.6. Lighting
- 11.1.7. Other Applications
- 11.1. Market Analysis, Insights and Forecast - by Application
- 12. Competitive Analysis
- 12.1. Company Profiles
- 12.1.1 Hamamatsu Photonics KK
- 12.1.1.1. Company Overview
- 12.1.1.2. Products
- 12.1.1.3. Company Financials
- 12.1.1.4. SWOT Analysis
- 12.1.2 Polatis Incorporated (huber+suhner)
- 12.1.2.1. Company Overview
- 12.1.2.2. Products
- 12.1.2.3. Company Financials
- 12.1.2.4. SWOT Analysis
- 12.1.3 Molex Inc
- 12.1.3.1. Company Overview
- 12.1.3.2. Products
- 12.1.3.3. Company Financials
- 12.1.3.4. SWOT Analysis
- 12.1.4 Infinera Corporation
- 12.1.4.1. Company Overview
- 12.1.4.2. Products
- 12.1.4.3. Company Financials
- 12.1.4.4. SWOT Analysis
- 12.1.5 Neophotonics Corporation (lumentum Holdings)
- 12.1.5.1. Company Overview
- 12.1.5.2. Products
- 12.1.5.3. Company Financials
- 12.1.5.4. SWOT Analysis
- 12.1.6 ams OSRAM AG
- 12.1.6.1. Company Overview
- 12.1.6.2. Products
- 12.1.6.3. Company Financials
- 12.1.6.4. SWOT Analysis
- 12.1.7 Vescent Photonics LLC
- 12.1.7.1. Company Overview
- 12.1.7.2. Products
- 12.1.7.3. Company Financials
- 12.1.7.4. SWOT Analysis
- 12.1.8 NEC Corporation
- 12.1.8.1. Company Overview
- 12.1.8.2. Products
- 12.1.8.3. Company Financials
- 12.1.8.4. SWOT Analysis
- 12.1.9 Alcatel-lucent SA (Nokia Corporation)*List Not Exhaustive
- 12.1.9.1. Company Overview
- 12.1.9.2. Products
- 12.1.9.3. Company Financials
- 12.1.9.4. SWOT Analysis
- 12.1.10 Photonic Systems Inc
- 12.1.10.1. Company Overview
- 12.1.10.2. Products
- 12.1.10.3. Company Financials
- 12.1.10.4. SWOT Analysis
- 12.1.11 Coherent Inc (Coherent Corp )
- 12.1.11.1. Company Overview
- 12.1.11.2. Products
- 12.1.11.3. Company Financials
- 12.1.11.4. SWOT Analysis
- 12.1.12 Trumpf Group
- 12.1.12.1. Company Overview
- 12.1.12.2. Products
- 12.1.12.3. Company Financials
- 12.1.12.4. SWOT Analysis
- 12.1.13 Thorlabs Inc
- 12.1.13.1. Company Overview
- 12.1.13.2. Products
- 12.1.13.3. Company Financials
- 12.1.13.4. SWOT Analysis
- 12.1.14 Intel Corporation
- 12.1.14.1. Company Overview
- 12.1.14.2. Products
- 12.1.14.3. Company Financials
- 12.1.14.4. SWOT Analysis
- 12.1.15 IPG Photonics
- 12.1.15.1. Company Overview
- 12.1.15.2. Products
- 12.1.15.3. Company Financials
- 12.1.15.4. SWOT Analysis
- 12.1.1 Hamamatsu Photonics KK
- 12.2. Market Entropy
- 12.2.1 Company's Key Areas Served
- 12.2.2 Recent Developments
- 12.3. Company Market Share Analysis 2025
- 12.3.1 Top 5 Companies Market Share Analysis
- 12.3.2 Top 3 Companies Market Share Analysis
- 12.4. List of Potential Customers
- 13. Research Methodology
List of Figures
- Figure 1: Global US Photonics Market Revenue Breakdown (billion, %) by Region 2025 & 2033
- Figure 2: North America US Photonics Market Revenue (billion), by Application 2025 & 2033
- Figure 3: North America US Photonics Market Revenue Share (%), by Application 2025 & 2033
- Figure 4: North America US Photonics Market Revenue (billion), by Country 2025 & 2033
- Figure 5: North America US Photonics Market Revenue Share (%), by Country 2025 & 2033
- Figure 6: South America US Photonics Market Revenue (billion), by Application 2025 & 2033
- Figure 7: South America US Photonics Market Revenue Share (%), by Application 2025 & 2033
- Figure 8: South America US Photonics Market Revenue (billion), by Country 2025 & 2033
- Figure 9: South America US Photonics Market Revenue Share (%), by Country 2025 & 2033
- Figure 10: Europe US Photonics Market Revenue (billion), by Application 2025 & 2033
- Figure 11: Europe US Photonics Market Revenue Share (%), by Application 2025 & 2033
- Figure 12: Europe US Photonics Market Revenue (billion), by Country 2025 & 2033
- Figure 13: Europe US Photonics Market Revenue Share (%), by Country 2025 & 2033
- Figure 14: Middle East & Africa US Photonics Market Revenue (billion), by Application 2025 & 2033
- Figure 15: Middle East & Africa US Photonics Market Revenue Share (%), by Application 2025 & 2033
- Figure 16: Middle East & Africa US Photonics Market Revenue (billion), by Country 2025 & 2033
- Figure 17: Middle East & Africa US Photonics Market Revenue Share (%), by Country 2025 & 2033
- Figure 18: Asia Pacific US Photonics Market Revenue (billion), by Application 2025 & 2033
- Figure 19: Asia Pacific US Photonics Market Revenue Share (%), by Application 2025 & 2033
- Figure 20: Asia Pacific US Photonics Market Revenue (billion), by Country 2025 & 2033
- Figure 21: Asia Pacific US Photonics Market Revenue Share (%), by Country 2025 & 2033
List of Tables
- Table 1: Global US Photonics Market Revenue billion Forecast, by Application 2020 & 2033
- Table 2: Global US Photonics Market Revenue billion Forecast, by Region 2020 & 2033
- Table 3: Global US Photonics Market Revenue billion Forecast, by Application 2020 & 2033
- Table 4: Global US Photonics Market Revenue billion Forecast, by Country 2020 & 2033
- Table 5: United States US Photonics Market Revenue (billion) Forecast, by Application 2020 & 2033
- Table 6: Canada US Photonics Market Revenue (billion) Forecast, by Application 2020 & 2033
- Table 7: Mexico US Photonics Market Revenue (billion) Forecast, by Application 2020 & 2033
- Table 8: Global US Photonics Market Revenue billion Forecast, by Application 2020 & 2033
- Table 9: Global US Photonics Market Revenue billion Forecast, by Country 2020 & 2033
- Table 10: Brazil US Photonics Market Revenue (billion) Forecast, by Application 2020 & 2033
- Table 11: Argentina US Photonics Market Revenue (billion) Forecast, by Application 2020 & 2033
- Table 12: Rest of South America US Photonics Market Revenue (billion) Forecast, by Application 2020 & 2033
- Table 13: Global US Photonics Market Revenue billion Forecast, by Application 2020 & 2033
- Table 14: Global US Photonics Market Revenue billion Forecast, by Country 2020 & 2033
- Table 15: United Kingdom US Photonics Market Revenue (billion) Forecast, by Application 2020 & 2033
- Table 16: Germany US Photonics Market Revenue (billion) Forecast, by Application 2020 & 2033
- Table 17: France US Photonics Market Revenue (billion) Forecast, by Application 2020 & 2033
- Table 18: Italy US Photonics Market Revenue (billion) Forecast, by Application 2020 & 2033
- Table 19: Spain US Photonics Market Revenue (billion) Forecast, by Application 2020 & 2033
- Table 20: Russia US Photonics Market Revenue (billion) Forecast, by Application 2020 & 2033
- Table 21: Benelux US Photonics Market Revenue (billion) Forecast, by Application 2020 & 2033
- Table 22: Nordics US Photonics Market Revenue (billion) Forecast, by Application 2020 & 2033
- Table 23: Rest of Europe US Photonics Market Revenue (billion) Forecast, by Application 2020 & 2033
- Table 24: Global US Photonics Market Revenue billion Forecast, by Application 2020 & 2033
- Table 25: Global US Photonics Market Revenue billion Forecast, by Country 2020 & 2033
- Table 26: Turkey US Photonics Market Revenue (billion) Forecast, by Application 2020 & 2033
- Table 27: Israel US Photonics Market Revenue (billion) Forecast, by Application 2020 & 2033
- Table 28: GCC US Photonics Market Revenue (billion) Forecast, by Application 2020 & 2033
- Table 29: North Africa US Photonics Market Revenue (billion) Forecast, by Application 2020 & 2033
- Table 30: South Africa US Photonics Market Revenue (billion) Forecast, by Application 2020 & 2033
- Table 31: Rest of Middle East & Africa US Photonics Market Revenue (billion) Forecast, by Application 2020 & 2033
- Table 32: Global US Photonics Market Revenue billion Forecast, by Application 2020 & 2033
- Table 33: Global US Photonics Market Revenue billion Forecast, by Country 2020 & 2033
- Table 34: China US Photonics Market Revenue (billion) Forecast, by Application 2020 & 2033
- Table 35: India US Photonics Market Revenue (billion) Forecast, by Application 2020 & 2033
- Table 36: Japan US Photonics Market Revenue (billion) Forecast, by Application 2020 & 2033
- Table 37: South Korea US Photonics Market Revenue (billion) Forecast, by Application 2020 & 2033
- Table 38: ASEAN US Photonics Market Revenue (billion) Forecast, by Application 2020 & 2033
- Table 39: Oceania US Photonics Market Revenue (billion) Forecast, by Application 2020 & 2033
- Table 40: Rest of Asia Pacific US Photonics Market Revenue (billion) Forecast, by Application 2020 & 2033
Frequently Asked Questions
1. What is the projected Compound Annual Growth Rate (CAGR) of the US Photonics Market?
The projected CAGR is approximately 6.3%.
2. Which companies are prominent players in the US Photonics Market?
Key companies in the market include Hamamatsu Photonics KK, Polatis Incorporated (huber+suhner), Molex Inc, Infinera Corporation, Neophotonics Corporation (lumentum Holdings), ams OSRAM AG, Vescent Photonics LLC, NEC Corporation, Alcatel-lucent SA (Nokia Corporation)*List Not Exhaustive, Photonic Systems Inc, Coherent Inc (Coherent Corp ), Trumpf Group, Thorlabs Inc, Intel Corporation, IPG Photonics.
3. What are the main segments of the US Photonics Market?
The market segments include Application.
4. Can you provide details about the market size?
The market size is estimated to be USD 1094 billion as of 2022.
5. What are some drivers contributing to market growth?
Emergence of Silicon-based Photonics Applications; Increasing Focus on High-performance and Eco-Friendly Solutions.
6. What are the notable trends driving market growth?
Emergence of Silicon-based Photonics Applications to Drive the Market.
7. Are there any restraints impacting market growth?
High Initial Cost of Photonics - Enabled Devices.
8. Can you provide examples of recent developments in the market?
June 2023: IPG Photonics, a leading fiber laser solutions provider, showcased its latest technologies and solutions for e-mobility manufacturing, materials processing, and specialized applications. IPG also introduced a breakthrough in thermal processing with its "Cold Oven" laser diode heating. This technology replaces traditional infrared bulbs and convection drying furnaces, delivering faster heating and drying processes with higher energy efficiency.
9. What pricing options are available for accessing the report?
Pricing options include single-user, multi-user, and enterprise licenses priced at USD 3800, USD 4500, and USD 5800 respectively.
10. Is the market size provided in terms of value or volume?
The market size is provided in terms of value, measured in billion.
11. Are there any specific market keywords associated with the report?
Yes, the market keyword associated with the report is "US Photonics Market," which aids in identifying and referencing the specific market segment covered.
12. How do I determine which pricing option suits my needs best?
The pricing options vary based on user requirements and access needs. Individual users may opt for single-user licenses, while businesses requiring broader access may choose multi-user or enterprise licenses for cost-effective access to the report.
13. Are there any additional resources or data provided in the US Photonics Market report?
While the report offers comprehensive insights, it's advisable to review the specific contents or supplementary materials provided to ascertain if additional resources or data are available.
14. How can I stay updated on further developments or reports in the US Photonics Market?
To stay informed about further developments, trends, and reports in the US Photonics Market, consider subscribing to industry newsletters, following relevant companies and organizations, or regularly checking reputable industry news sources and publications.
Methodology
Step 1 - Identification of Relevant Samples Size from Population Database


Step 2 - Approaches for Defining Global Market Size (Value, Volume* & Price*)

Note*: In applicable scenarios
Step 3 - Data Sources
Primary Research
- Web Analytics
- Survey Reports
- Research Institute
- Latest Research Reports
- Opinion Leaders
Secondary Research
- Annual Reports
- White Paper
- Latest Press Release
- Industry Association
- Paid Database
- Investor Presentations

Step 4 - Data Triangulation
Involves using different sources of information in order to increase the validity of a study
These sources are likely to be stakeholders in a program - participants, other researchers, program staff, other community members, and so on.
Then we put all data in single framework & apply various statistical tools to find out the dynamic on the market.
During the analysis stage, feedback from the stakeholder groups would be compared to determine areas of agreement as well as areas of divergence