

Key Insights
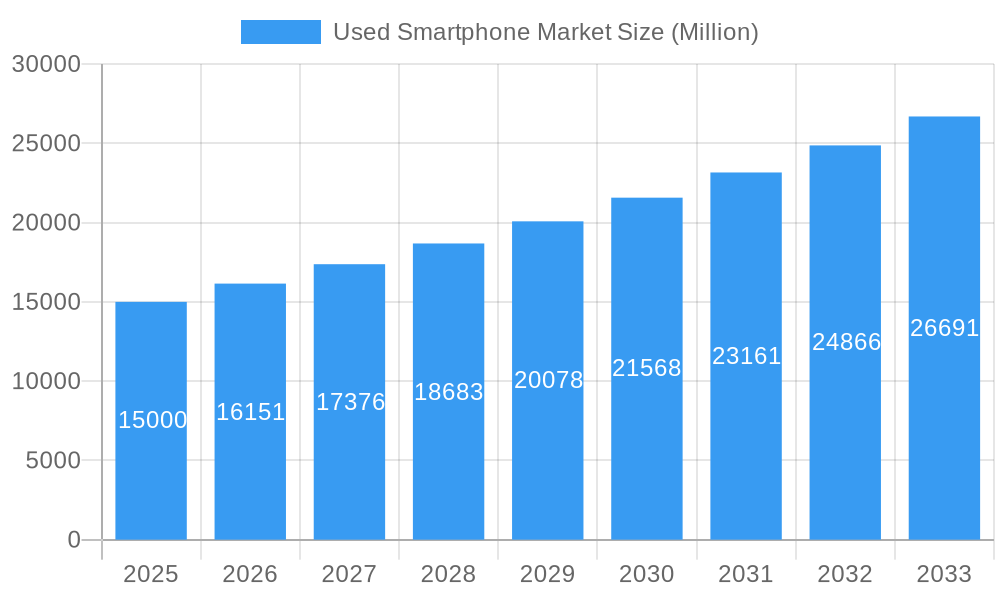
The global used smartphone market is projected for substantial expansion, driven by increasing consumer demand for affordable mobile solutions and a growing commitment to environmental sustainability. With a projected Compound Annual Growth Rate (CAGR) of 22.6% from 2025 to 2033, the market is set to reach a size of 42.33 billion by 2025. This robust growth is underpinned by several key factors: escalating prices of new smartphones are making pre-owned devices a more attractive option for budget-conscious consumers, while a heightened awareness of e-waste and the circular economy encourages the reuse of existing technology. Furthermore, the proliferation of online marketplaces offers consumers convenient access to a wider selection of used smartphones, fostering competitive pricing and increased choice. The market is segmented by device condition (refurbished, like-new, good), sales channel (online, offline), price point (under $200, $200-$500, over $500), and operating system (Android, iOS), effectively catering to a broad spectrum of consumer needs and financial capabilities. Despite inherent challenges such as potential concerns regarding device quality and battery longevity, the inherent cost savings and significant environmental benefits of purchasing used smartphones are powerful market accelerators. Leading e-commerce platforms and electronics retailers are actively participating in this sector, underscoring its maturity and potential for continued growth. Geographically, North America and the Asia-Pacific region are demonstrating strong performance, attributed to high smartphone penetration rates and widespread adoption. Future market dynamics will likely be shaped by ongoing technological advancements, evolving consumer preferences, and the implementation of enhanced quality assurance and certification protocols for pre-owned devices.
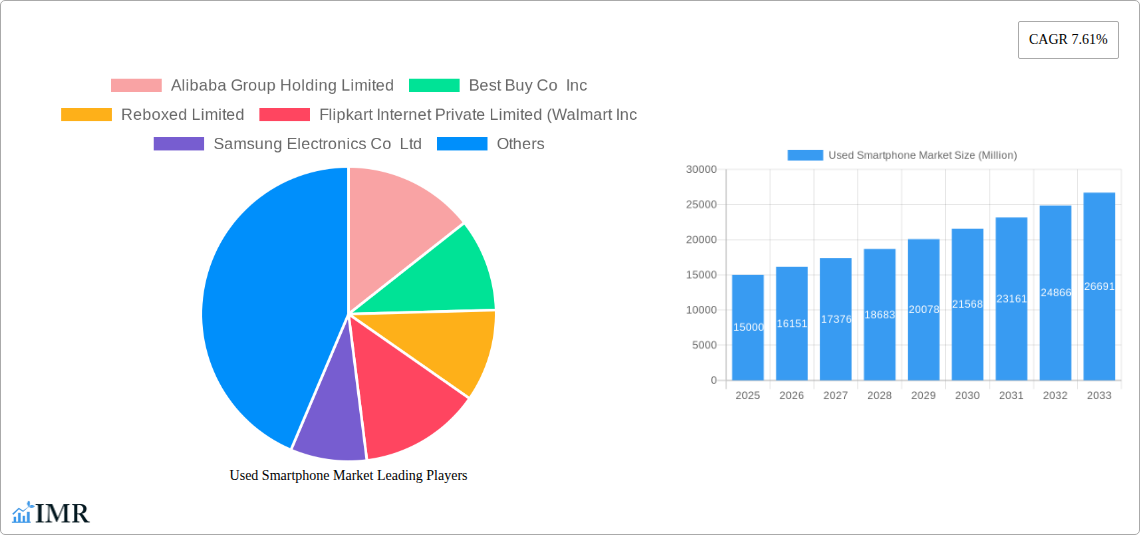
Used Smartphone Market Market Size (In Billion)
The forecast period (2025-2033) anticipates sustained market expansion by capitalizing on existing growth drivers and addressing current limitations. Success for market participants will depend on the transparent grading of device conditions, the provision of comprehensive warranties and repair services, and the strategic utilization of digital channels to maximize reach. Key influences on future growth include effective device lifecycle management, the adoption of more sustainable manufacturing practices by new smartphone manufacturers, and the increasing environmental consciousness of younger demographics. Strategic marketing initiatives that effectively communicate the financial and ecological value proposition of used smartphones will be crucial for sustained expansion. Regions with lower current smartphone penetration represent significant untapped market potential.
Used Smartphone Market Company Market Share
Used Smartphone Market Report: 2019-2033
This comprehensive report provides a detailed analysis of the global used smartphone market, encompassing market dynamics, growth trends, regional performance, and key player strategies. The study period covers 2019-2033, with a base year of 2025 and a forecast period of 2025-2033. This in-depth analysis will equip industry professionals, investors, and strategists with crucial insights into this rapidly evolving market. The report segments the market by condition (Refurbished, Used-like New, Used-Good), channel (Online, Offline), price range (Below $200, $200-$500, Above $500), and operating system (Android, iOS).
Used Smartphone Market Dynamics & Structure
The used smartphone market exhibits a dynamic interplay of factors influencing its structure and growth. Market concentration is moderate, with several key players holding significant shares but facing competition from numerous smaller players and emerging refurbished marketplaces. Technological innovation, particularly in battery technology and repair capabilities, is a key driver, extending the lifespan of devices and fueling demand for used options. Stringent e-waste regulations are shaping the landscape, promoting responsible recycling and refurbishment practices. The market is witnessing increasing consolidation, evidenced by a rising number of mergers and acquisitions (M&As). The competitive landscape is further impacted by the availability of substitute products, such as feature phones and low-cost new smartphones. End-user demographics, particularly the price-sensitive younger population and environmentally conscious consumers, are crucial to market expansion.
- Market Concentration: Moderate, with top 5 players holding xx% of the market in 2024.
- M&A Activity: XX deals closed in 2023, indicating a trend towards consolidation.
- Technological Innovation: Focus on extended battery life and improved repair services.
- Regulatory Framework: Growing emphasis on e-waste management and sustainable practices.
- End-User Demographics: Price-conscious younger generation and environmentally aware consumers are key drivers.
Used Smartphone Market Growth Trends & Insights
The global used smartphone market has shown significant growth during the historical period (2019-2024), experiencing a CAGR of xx%. This growth is attributed to several factors, including increasing smartphone penetration, particularly in developing economies, rising consumer preference for budget-friendly options, and a growing awareness of environmental sustainability. The market size in 2024 was estimated at xx million units, and is projected to reach xx million units by 2025 and xx million units by 2033. Technological disruptions, such as advancements in refurbished device quality and online marketplaces, have accelerated adoption rates. Consumer behavior is shifting towards prioritizing value for money and sustainable consumption, further boosting demand for pre-owned devices.
Dominant Regions, Countries, or Segments in Used Smartphone Market
The used smartphone market demonstrates significant regional variation. Asia-Pacific, particularly India and China, currently dominate due to high smartphone penetration and a large price-sensitive consumer base. The online channel dominates the market, capturing xx% of sales in 2024, owing to its convenience and accessibility. The "Below $200" price segment constitutes the largest share of the market (xx%), reflecting high demand for affordable options. Refurbished smartphones hold the largest market share within the condition segment, reflecting the increasing trust and quality of refurbished devices. Android operating system-based devices hold a larger market share than iOS devices, largely driven by the wider availability of affordable Android devices in the used market.
- Key Regional Drivers: High smartphone penetration in APAC, increasing disposable income in developing economies.
- Channel Dominance: Online channels' convenience drives market share.
- Price Segment Dominance: "Below $200" segment benefits from strong price sensitivity.
- Condition Segment Dominance: Refurbished devices account for the largest market share due to cost-effectiveness and improved quality.
- OS Dominance: Android’s larger presence in the affordable segment drives market share.
Used Smartphone Market Product Landscape
The used smartphone market offers a diverse range of products, encompassing devices from various manufacturers and across different generations. Refurbished models often undergo rigorous quality checks and repairs, while "used-like new" and "used-good" devices maintain varying levels of cosmetic condition and functionality. Key performance metrics include battery life, storage capacity, and processor speed. Many refurbished smartphones offer comparable performance to newer models at significantly lower prices, representing a unique selling proposition. Advancements in diagnostic tools and repair processes contribute to improved quality and reliability.
Key Drivers, Barriers & Challenges in Used Smartphone Market
Key Drivers:
- Growing demand for affordable smartphones.
- Increasing consumer awareness of environmental sustainability.
- Rise of online marketplaces and improved access to refurbished devices.
- Advancements in refurbishment technologies.
Key Challenges:
- Concerns regarding device quality and reliability.
- Potential for counterfeit or damaged devices.
- Lack of standardized quality certifications.
- Managing the complexities of the used device supply chain. Estimates suggest xx% of returned devices are damaged beyond repair, impacting supply.
Emerging Opportunities in Used Smartphone Market
- Expansion into underserved markets in Africa and Latin America.
- Development of innovative financing options for used smartphones.
- Growing demand for refurbished devices in the enterprise sector for cost-effective solutions.
- Increased collaboration between manufacturers and refurbishment companies.
Growth Accelerators in the Used Smartphone Market Industry
The long-term growth of the used smartphone market is expected to be propelled by the increasing demand for affordable and sustainable electronics. Technological advancements in battery technology, improved refurbishment processes, and the emergence of certified refurbished programs are crucial factors. Strategic partnerships between manufacturers, retailers, and refurbishment companies will further enhance the supply chain and consumer trust. Expansion into emerging markets and the development of innovative business models, such as device-as-a-service, will contribute to market growth.
Key Players Shaping the Used Smartphone Market Market
- Alibaba Group Holding Limited
- Best Buy Co Inc
- Reboxed Limited
- Flipkart Internet Private Limited (Walmart Inc)
- Samsung Electronics Co Ltd
- Verizon Communications Inc
- FoneGiant
- Paytm (One97 Communications Limited)
- Amazon com Inc
- Nippon Telephone Inc
- Back Market
- AT&T Inc
- Apple Inc
Notable Milestones in Used Smartphone Market Sector
- September 2023: REFURBED, a portfolio company of Expon Capital, secured a USD 57 million Series C investment, furthering its expansion in the sustainable technology market.
- December 2023: ControlZ, a smartphone refurbishing startup, plans to invest nearly USD 2 million in its Gurugram facility, aiming to repair 1 lakh units in 2024 and 5 lakh units by 2025.
In-Depth Used Smartphone Market Market Outlook
The used smartphone market is poised for sustained growth, driven by increasing affordability, environmental consciousness, and technological advancements. Strategic opportunities lie in expanding into emerging markets, improving supply chain efficiency, and enhancing consumer trust through quality certifications and extended warranties. The focus on sustainable practices and circular economy principles will further contribute to the long-term market potential. Innovation in refurbishment technologies and partnerships across the value chain will unlock new avenues for growth and market expansion.
Used Smartphone Market Segmentation
- 1. Production Analysis
- 2. Consumption Analysis
- 3. Import Market Analysis (Value & Volume)
- 4. Export Market Analysis (Value & Volume)
- 5. Price Trend Analysis
Used Smartphone Market Segmentation By Geography
- 1. North America
- 2. Europe
- 3. Asia Pacific
- 4. Rest of the World
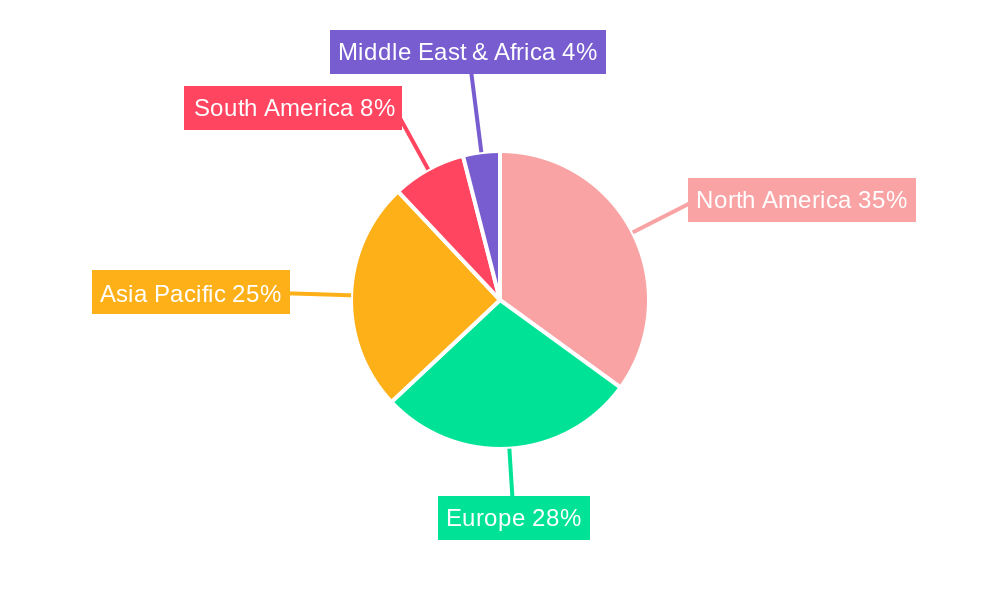
Used Smartphone Market Regional Market Share
Geographic Coverage of Used Smartphone Market
Used Smartphone Market REPORT HIGHLIGHTS
| Aspects | Details |
|---|---|
| Study Period | 2020-2034 |
| Base Year | 2025 |
| Estimated Year | 2026 |
| Forecast Period | 2026-2034 |
| Historical Period | 2020-2025 |
| Growth Rate | CAGR of 22.6% from 2020-2034 |
| Segmentation |
|
Table of Contents
- 1. Introduction
- 1.1. Research Scope
- 1.2. Market Segmentation
- 1.3. Research Methodology
- 1.4. Definitions and Assumptions
- 2. Executive Summary
- 2.1. Introduction
- 3. Market Dynamics
- 3.1. Introduction
- 3.2. Market Drivers
- 3.2.1. Trend Toward Premium Phones (Rise in Upgrade Costs); Growing Popularity of E-commerce Platforms for Used and Refurbished Smartphones; Telecom Operators Focusing on Used Phones with Attractive Plans
- 3.3. Market Restrains
- 3.3.1. Short term supply chain challenges due to the pandemic scenario and the US-China Trade war scenario
- 3.4. Market Trends
- 3.4.1. Growing Popularity of E-commerce Platforms for Used and Refurbished Smartphones to Drive the Market
- 4. Market Factor Analysis
- 4.1. Porters Five Forces
- 4.2. Supply/Value Chain
- 4.3. PESTEL analysis
- 4.4. Market Entropy
- 4.5. Patent/Trademark Analysis
- 5. Global Used Smartphone Market Analysis, Insights and Forecast, 2020-2032
- 5.1. Market Analysis, Insights and Forecast - by Production Analysis
- 5.2. Market Analysis, Insights and Forecast - by Consumption Analysis
- 5.3. Market Analysis, Insights and Forecast - by Import Market Analysis (Value & Volume)
- 5.4. Market Analysis, Insights and Forecast - by Export Market Analysis (Value & Volume)
- 5.5. Market Analysis, Insights and Forecast - by Price Trend Analysis
- 5.6. Market Analysis, Insights and Forecast - by Region
- 5.6.1. North America
- 5.6.2. Europe
- 5.6.3. Asia Pacific
- 5.6.4. Rest of the World
- 5.1. Market Analysis, Insights and Forecast - by Production Analysis
- 6. North America Used Smartphone Market Analysis, Insights and Forecast, 2020-2032
- 6.1. Market Analysis, Insights and Forecast - by Production Analysis
- 6.2. Market Analysis, Insights and Forecast - by Consumption Analysis
- 6.3. Market Analysis, Insights and Forecast - by Import Market Analysis (Value & Volume)
- 6.4. Market Analysis, Insights and Forecast - by Export Market Analysis (Value & Volume)
- 6.5. Market Analysis, Insights and Forecast - by Price Trend Analysis
- 6.1. Market Analysis, Insights and Forecast - by Production Analysis
- 7. Europe Used Smartphone Market Analysis, Insights and Forecast, 2020-2032
- 7.1. Market Analysis, Insights and Forecast - by Production Analysis
- 7.2. Market Analysis, Insights and Forecast - by Consumption Analysis
- 7.3. Market Analysis, Insights and Forecast - by Import Market Analysis (Value & Volume)
- 7.4. Market Analysis, Insights and Forecast - by Export Market Analysis (Value & Volume)
- 7.5. Market Analysis, Insights and Forecast - by Price Trend Analysis
- 7.1. Market Analysis, Insights and Forecast - by Production Analysis
- 8. Asia Pacific Used Smartphone Market Analysis, Insights and Forecast, 2020-2032
- 8.1. Market Analysis, Insights and Forecast - by Production Analysis
- 8.2. Market Analysis, Insights and Forecast - by Consumption Analysis
- 8.3. Market Analysis, Insights and Forecast - by Import Market Analysis (Value & Volume)
- 8.4. Market Analysis, Insights and Forecast - by Export Market Analysis (Value & Volume)
- 8.5. Market Analysis, Insights and Forecast - by Price Trend Analysis
- 8.1. Market Analysis, Insights and Forecast - by Production Analysis
- 9. Rest of the World Used Smartphone Market Analysis, Insights and Forecast, 2020-2032
- 9.1. Market Analysis, Insights and Forecast - by Production Analysis
- 9.2. Market Analysis, Insights and Forecast - by Consumption Analysis
- 9.3. Market Analysis, Insights and Forecast - by Import Market Analysis (Value & Volume)
- 9.4. Market Analysis, Insights and Forecast - by Export Market Analysis (Value & Volume)
- 9.5. Market Analysis, Insights and Forecast - by Price Trend Analysis
- 9.1. Market Analysis, Insights and Forecast - by Production Analysis
- 10. Competitive Analysis
- 10.1. Global Market Share Analysis 2025
- 10.2. Company Profiles
- 10.2.1 Alibaba Group Holding Limited
- 10.2.1.1. Overview
- 10.2.1.2. Products
- 10.2.1.3. SWOT Analysis
- 10.2.1.4. Recent Developments
- 10.2.1.5. Financials (Based on Availability)
- 10.2.2 Best Buy Co Inc
- 10.2.2.1. Overview
- 10.2.2.2. Products
- 10.2.2.3. SWOT Analysis
- 10.2.2.4. Recent Developments
- 10.2.2.5. Financials (Based on Availability)
- 10.2.3 Reboxed Limited
- 10.2.3.1. Overview
- 10.2.3.2. Products
- 10.2.3.3. SWOT Analysis
- 10.2.3.4. Recent Developments
- 10.2.3.5. Financials (Based on Availability)
- 10.2.4 Flipkart Internet Private Limited (Walmart Inc
- 10.2.4.1. Overview
- 10.2.4.2. Products
- 10.2.4.3. SWOT Analysis
- 10.2.4.4. Recent Developments
- 10.2.4.5. Financials (Based on Availability)
- 10.2.5 Samsung Electronics Co Ltd
- 10.2.5.1. Overview
- 10.2.5.2. Products
- 10.2.5.3. SWOT Analysis
- 10.2.5.4. Recent Developments
- 10.2.5.5. Financials (Based on Availability)
- 10.2.6 Verizon Communications Inc
- 10.2.6.1. Overview
- 10.2.6.2. Products
- 10.2.6.3. SWOT Analysis
- 10.2.6.4. Recent Developments
- 10.2.6.5. Financials (Based on Availability)
- 10.2.7 FoneGiant
- 10.2.7.1. Overview
- 10.2.7.2. Products
- 10.2.7.3. SWOT Analysis
- 10.2.7.4. Recent Developments
- 10.2.7.5. Financials (Based on Availability)
- 10.2.8 Paytm (One97 Communications Limited)
- 10.2.8.1. Overview
- 10.2.8.2. Products
- 10.2.8.3. SWOT Analysis
- 10.2.8.4. Recent Developments
- 10.2.8.5. Financials (Based on Availability)
- 10.2.9 Amazon com Inc
- 10.2.9.1. Overview
- 10.2.9.2. Products
- 10.2.9.3. SWOT Analysis
- 10.2.9.4. Recent Developments
- 10.2.9.5. Financials (Based on Availability)
- 10.2.10 Nippon Telephone Inc
- 10.2.10.1. Overview
- 10.2.10.2. Products
- 10.2.10.3. SWOT Analysis
- 10.2.10.4. Recent Developments
- 10.2.10.5. Financials (Based on Availability)
- 10.2.11 Back Market
- 10.2.11.1. Overview
- 10.2.11.2. Products
- 10.2.11.3. SWOT Analysis
- 10.2.11.4. Recent Developments
- 10.2.11.5. Financials (Based on Availability)
- 10.2.12 AT&T Inc
- 10.2.12.1. Overview
- 10.2.12.2. Products
- 10.2.12.3. SWOT Analysis
- 10.2.12.4. Recent Developments
- 10.2.12.5. Financials (Based on Availability)
- 10.2.13 Apple Inc
- 10.2.13.1. Overview
- 10.2.13.2. Products
- 10.2.13.3. SWOT Analysis
- 10.2.13.4. Recent Developments
- 10.2.13.5. Financials (Based on Availability)
- 10.2.1 Alibaba Group Holding Limited
List of Figures
- Figure 1: Global Used Smartphone Market Revenue Breakdown (billion, %) by Region 2025 & 2033
- Figure 2: Global Used Smartphone Market Volume Breakdown (Million, %) by Region 2025 & 2033
- Figure 3: North America Used Smartphone Market Revenue (billion), by Production Analysis 2025 & 2033
- Figure 4: North America Used Smartphone Market Volume (Million), by Production Analysis 2025 & 2033
- Figure 5: North America Used Smartphone Market Revenue Share (%), by Production Analysis 2025 & 2033
- Figure 6: North America Used Smartphone Market Volume Share (%), by Production Analysis 2025 & 2033
- Figure 7: North America Used Smartphone Market Revenue (billion), by Consumption Analysis 2025 & 2033
- Figure 8: North America Used Smartphone Market Volume (Million), by Consumption Analysis 2025 & 2033
- Figure 9: North America Used Smartphone Market Revenue Share (%), by Consumption Analysis 2025 & 2033
- Figure 10: North America Used Smartphone Market Volume Share (%), by Consumption Analysis 2025 & 2033
- Figure 11: North America Used Smartphone Market Revenue (billion), by Import Market Analysis (Value & Volume) 2025 & 2033
- Figure 12: North America Used Smartphone Market Volume (Million), by Import Market Analysis (Value & Volume) 2025 & 2033
- Figure 13: North America Used Smartphone Market Revenue Share (%), by Import Market Analysis (Value & Volume) 2025 & 2033
- Figure 14: North America Used Smartphone Market Volume Share (%), by Import Market Analysis (Value & Volume) 2025 & 2033
- Figure 15: North America Used Smartphone Market Revenue (billion), by Export Market Analysis (Value & Volume) 2025 & 2033
- Figure 16: North America Used Smartphone Market Volume (Million), by Export Market Analysis (Value & Volume) 2025 & 2033
- Figure 17: North America Used Smartphone Market Revenue Share (%), by Export Market Analysis (Value & Volume) 2025 & 2033
- Figure 18: North America Used Smartphone Market Volume Share (%), by Export Market Analysis (Value & Volume) 2025 & 2033
- Figure 19: North America Used Smartphone Market Revenue (billion), by Price Trend Analysis 2025 & 2033
- Figure 20: North America Used Smartphone Market Volume (Million), by Price Trend Analysis 2025 & 2033
- Figure 21: North America Used Smartphone Market Revenue Share (%), by Price Trend Analysis 2025 & 2033
- Figure 22: North America Used Smartphone Market Volume Share (%), by Price Trend Analysis 2025 & 2033
- Figure 23: North America Used Smartphone Market Revenue (billion), by Country 2025 & 2033
- Figure 24: North America Used Smartphone Market Volume (Million), by Country 2025 & 2033
- Figure 25: North America Used Smartphone Market Revenue Share (%), by Country 2025 & 2033
- Figure 26: North America Used Smartphone Market Volume Share (%), by Country 2025 & 2033
- Figure 27: Europe Used Smartphone Market Revenue (billion), by Production Analysis 2025 & 2033
- Figure 28: Europe Used Smartphone Market Volume (Million), by Production Analysis 2025 & 2033
- Figure 29: Europe Used Smartphone Market Revenue Share (%), by Production Analysis 2025 & 2033
- Figure 30: Europe Used Smartphone Market Volume Share (%), by Production Analysis 2025 & 2033
- Figure 31: Europe Used Smartphone Market Revenue (billion), by Consumption Analysis 2025 & 2033
- Figure 32: Europe Used Smartphone Market Volume (Million), by Consumption Analysis 2025 & 2033
- Figure 33: Europe Used Smartphone Market Revenue Share (%), by Consumption Analysis 2025 & 2033
- Figure 34: Europe Used Smartphone Market Volume Share (%), by Consumption Analysis 2025 & 2033
- Figure 35: Europe Used Smartphone Market Revenue (billion), by Import Market Analysis (Value & Volume) 2025 & 2033
- Figure 36: Europe Used Smartphone Market Volume (Million), by Import Market Analysis (Value & Volume) 2025 & 2033
- Figure 37: Europe Used Smartphone Market Revenue Share (%), by Import Market Analysis (Value & Volume) 2025 & 2033
- Figure 38: Europe Used Smartphone Market Volume Share (%), by Import Market Analysis (Value & Volume) 2025 & 2033
- Figure 39: Europe Used Smartphone Market Revenue (billion), by Export Market Analysis (Value & Volume) 2025 & 2033
- Figure 40: Europe Used Smartphone Market Volume (Million), by Export Market Analysis (Value & Volume) 2025 & 2033
- Figure 41: Europe Used Smartphone Market Revenue Share (%), by Export Market Analysis (Value & Volume) 2025 & 2033
- Figure 42: Europe Used Smartphone Market Volume Share (%), by Export Market Analysis (Value & Volume) 2025 & 2033
- Figure 43: Europe Used Smartphone Market Revenue (billion), by Price Trend Analysis 2025 & 2033
- Figure 44: Europe Used Smartphone Market Volume (Million), by Price Trend Analysis 2025 & 2033
- Figure 45: Europe Used Smartphone Market Revenue Share (%), by Price Trend Analysis 2025 & 2033
- Figure 46: Europe Used Smartphone Market Volume Share (%), by Price Trend Analysis 2025 & 2033
- Figure 47: Europe Used Smartphone Market Revenue (billion), by Country 2025 & 2033
- Figure 48: Europe Used Smartphone Market Volume (Million), by Country 2025 & 2033
- Figure 49: Europe Used Smartphone Market Revenue Share (%), by Country 2025 & 2033
- Figure 50: Europe Used Smartphone Market Volume Share (%), by Country 2025 & 2033
- Figure 51: Asia Pacific Used Smartphone Market Revenue (billion), by Production Analysis 2025 & 2033
- Figure 52: Asia Pacific Used Smartphone Market Volume (Million), by Production Analysis 2025 & 2033
- Figure 53: Asia Pacific Used Smartphone Market Revenue Share (%), by Production Analysis 2025 & 2033
- Figure 54: Asia Pacific Used Smartphone Market Volume Share (%), by Production Analysis 2025 & 2033
- Figure 55: Asia Pacific Used Smartphone Market Revenue (billion), by Consumption Analysis 2025 & 2033
- Figure 56: Asia Pacific Used Smartphone Market Volume (Million), by Consumption Analysis 2025 & 2033
- Figure 57: Asia Pacific Used Smartphone Market Revenue Share (%), by Consumption Analysis 2025 & 2033
- Figure 58: Asia Pacific Used Smartphone Market Volume Share (%), by Consumption Analysis 2025 & 2033
- Figure 59: Asia Pacific Used Smartphone Market Revenue (billion), by Import Market Analysis (Value & Volume) 2025 & 2033
- Figure 60: Asia Pacific Used Smartphone Market Volume (Million), by Import Market Analysis (Value & Volume) 2025 & 2033
- Figure 61: Asia Pacific Used Smartphone Market Revenue Share (%), by Import Market Analysis (Value & Volume) 2025 & 2033
- Figure 62: Asia Pacific Used Smartphone Market Volume Share (%), by Import Market Analysis (Value & Volume) 2025 & 2033
- Figure 63: Asia Pacific Used Smartphone Market Revenue (billion), by Export Market Analysis (Value & Volume) 2025 & 2033
- Figure 64: Asia Pacific Used Smartphone Market Volume (Million), by Export Market Analysis (Value & Volume) 2025 & 2033
- Figure 65: Asia Pacific Used Smartphone Market Revenue Share (%), by Export Market Analysis (Value & Volume) 2025 & 2033
- Figure 66: Asia Pacific Used Smartphone Market Volume Share (%), by Export Market Analysis (Value & Volume) 2025 & 2033
- Figure 67: Asia Pacific Used Smartphone Market Revenue (billion), by Price Trend Analysis 2025 & 2033
- Figure 68: Asia Pacific Used Smartphone Market Volume (Million), by Price Trend Analysis 2025 & 2033
- Figure 69: Asia Pacific Used Smartphone Market Revenue Share (%), by Price Trend Analysis 2025 & 2033
- Figure 70: Asia Pacific Used Smartphone Market Volume Share (%), by Price Trend Analysis 2025 & 2033
- Figure 71: Asia Pacific Used Smartphone Market Revenue (billion), by Country 2025 & 2033
- Figure 72: Asia Pacific Used Smartphone Market Volume (Million), by Country 2025 & 2033
- Figure 73: Asia Pacific Used Smartphone Market Revenue Share (%), by Country 2025 & 2033
- Figure 74: Asia Pacific Used Smartphone Market Volume Share (%), by Country 2025 & 2033
- Figure 75: Rest of the World Used Smartphone Market Revenue (billion), by Production Analysis 2025 & 2033
- Figure 76: Rest of the World Used Smartphone Market Volume (Million), by Production Analysis 2025 & 2033
- Figure 77: Rest of the World Used Smartphone Market Revenue Share (%), by Production Analysis 2025 & 2033
- Figure 78: Rest of the World Used Smartphone Market Volume Share (%), by Production Analysis 2025 & 2033
- Figure 79: Rest of the World Used Smartphone Market Revenue (billion), by Consumption Analysis 2025 & 2033
- Figure 80: Rest of the World Used Smartphone Market Volume (Million), by Consumption Analysis 2025 & 2033
- Figure 81: Rest of the World Used Smartphone Market Revenue Share (%), by Consumption Analysis 2025 & 2033
- Figure 82: Rest of the World Used Smartphone Market Volume Share (%), by Consumption Analysis 2025 & 2033
- Figure 83: Rest of the World Used Smartphone Market Revenue (billion), by Import Market Analysis (Value & Volume) 2025 & 2033
- Figure 84: Rest of the World Used Smartphone Market Volume (Million), by Import Market Analysis (Value & Volume) 2025 & 2033
- Figure 85: Rest of the World Used Smartphone Market Revenue Share (%), by Import Market Analysis (Value & Volume) 2025 & 2033
- Figure 86: Rest of the World Used Smartphone Market Volume Share (%), by Import Market Analysis (Value & Volume) 2025 & 2033
- Figure 87: Rest of the World Used Smartphone Market Revenue (billion), by Export Market Analysis (Value & Volume) 2025 & 2033
- Figure 88: Rest of the World Used Smartphone Market Volume (Million), by Export Market Analysis (Value & Volume) 2025 & 2033
- Figure 89: Rest of the World Used Smartphone Market Revenue Share (%), by Export Market Analysis (Value & Volume) 2025 & 2033
- Figure 90: Rest of the World Used Smartphone Market Volume Share (%), by Export Market Analysis (Value & Volume) 2025 & 2033
- Figure 91: Rest of the World Used Smartphone Market Revenue (billion), by Price Trend Analysis 2025 & 2033
- Figure 92: Rest of the World Used Smartphone Market Volume (Million), by Price Trend Analysis 2025 & 2033
- Figure 93: Rest of the World Used Smartphone Market Revenue Share (%), by Price Trend Analysis 2025 & 2033
- Figure 94: Rest of the World Used Smartphone Market Volume Share (%), by Price Trend Analysis 2025 & 2033
- Figure 95: Rest of the World Used Smartphone Market Revenue (billion), by Country 2025 & 2033
- Figure 96: Rest of the World Used Smartphone Market Volume (Million), by Country 2025 & 2033
- Figure 97: Rest of the World Used Smartphone Market Revenue Share (%), by Country 2025 & 2033
- Figure 98: Rest of the World Used Smartphone Market Volume Share (%), by Country 2025 & 2033
List of Tables
- Table 1: Global Used Smartphone Market Revenue billion Forecast, by Production Analysis 2020 & 2033
- Table 2: Global Used Smartphone Market Volume Million Forecast, by Production Analysis 2020 & 2033
- Table 3: Global Used Smartphone Market Revenue billion Forecast, by Consumption Analysis 2020 & 2033
- Table 4: Global Used Smartphone Market Volume Million Forecast, by Consumption Analysis 2020 & 2033
- Table 5: Global Used Smartphone Market Revenue billion Forecast, by Import Market Analysis (Value & Volume) 2020 & 2033
- Table 6: Global Used Smartphone Market Volume Million Forecast, by Import Market Analysis (Value & Volume) 2020 & 2033
- Table 7: Global Used Smartphone Market Revenue billion Forecast, by Export Market Analysis (Value & Volume) 2020 & 2033
- Table 8: Global Used Smartphone Market Volume Million Forecast, by Export Market Analysis (Value & Volume) 2020 & 2033
- Table 9: Global Used Smartphone Market Revenue billion Forecast, by Price Trend Analysis 2020 & 2033
- Table 10: Global Used Smartphone Market Volume Million Forecast, by Price Trend Analysis 2020 & 2033
- Table 11: Global Used Smartphone Market Revenue billion Forecast, by Region 2020 & 2033
- Table 12: Global Used Smartphone Market Volume Million Forecast, by Region 2020 & 2033
- Table 13: Global Used Smartphone Market Revenue billion Forecast, by Production Analysis 2020 & 2033
- Table 14: Global Used Smartphone Market Volume Million Forecast, by Production Analysis 2020 & 2033
- Table 15: Global Used Smartphone Market Revenue billion Forecast, by Consumption Analysis 2020 & 2033
- Table 16: Global Used Smartphone Market Volume Million Forecast, by Consumption Analysis 2020 & 2033
- Table 17: Global Used Smartphone Market Revenue billion Forecast, by Import Market Analysis (Value & Volume) 2020 & 2033
- Table 18: Global Used Smartphone Market Volume Million Forecast, by Import Market Analysis (Value & Volume) 2020 & 2033
- Table 19: Global Used Smartphone Market Revenue billion Forecast, by Export Market Analysis (Value & Volume) 2020 & 2033
- Table 20: Global Used Smartphone Market Volume Million Forecast, by Export Market Analysis (Value & Volume) 2020 & 2033
- Table 21: Global Used Smartphone Market Revenue billion Forecast, by Price Trend Analysis 2020 & 2033
- Table 22: Global Used Smartphone Market Volume Million Forecast, by Price Trend Analysis 2020 & 2033
- Table 23: Global Used Smartphone Market Revenue billion Forecast, by Country 2020 & 2033
- Table 24: Global Used Smartphone Market Volume Million Forecast, by Country 2020 & 2033
- Table 25: Global Used Smartphone Market Revenue billion Forecast, by Production Analysis 2020 & 2033
- Table 26: Global Used Smartphone Market Volume Million Forecast, by Production Analysis 2020 & 2033
- Table 27: Global Used Smartphone Market Revenue billion Forecast, by Consumption Analysis 2020 & 2033
- Table 28: Global Used Smartphone Market Volume Million Forecast, by Consumption Analysis 2020 & 2033
- Table 29: Global Used Smartphone Market Revenue billion Forecast, by Import Market Analysis (Value & Volume) 2020 & 2033
- Table 30: Global Used Smartphone Market Volume Million Forecast, by Import Market Analysis (Value & Volume) 2020 & 2033
- Table 31: Global Used Smartphone Market Revenue billion Forecast, by Export Market Analysis (Value & Volume) 2020 & 2033
- Table 32: Global Used Smartphone Market Volume Million Forecast, by Export Market Analysis (Value & Volume) 2020 & 2033
- Table 33: Global Used Smartphone Market Revenue billion Forecast, by Price Trend Analysis 2020 & 2033
- Table 34: Global Used Smartphone Market Volume Million Forecast, by Price Trend Analysis 2020 & 2033
- Table 35: Global Used Smartphone Market Revenue billion Forecast, by Country 2020 & 2033
- Table 36: Global Used Smartphone Market Volume Million Forecast, by Country 2020 & 2033
- Table 37: Global Used Smartphone Market Revenue billion Forecast, by Production Analysis 2020 & 2033
- Table 38: Global Used Smartphone Market Volume Million Forecast, by Production Analysis 2020 & 2033
- Table 39: Global Used Smartphone Market Revenue billion Forecast, by Consumption Analysis 2020 & 2033
- Table 40: Global Used Smartphone Market Volume Million Forecast, by Consumption Analysis 2020 & 2033
- Table 41: Global Used Smartphone Market Revenue billion Forecast, by Import Market Analysis (Value & Volume) 2020 & 2033
- Table 42: Global Used Smartphone Market Volume Million Forecast, by Import Market Analysis (Value & Volume) 2020 & 2033
- Table 43: Global Used Smartphone Market Revenue billion Forecast, by Export Market Analysis (Value & Volume) 2020 & 2033
- Table 44: Global Used Smartphone Market Volume Million Forecast, by Export Market Analysis (Value & Volume) 2020 & 2033
- Table 45: Global Used Smartphone Market Revenue billion Forecast, by Price Trend Analysis 2020 & 2033
- Table 46: Global Used Smartphone Market Volume Million Forecast, by Price Trend Analysis 2020 & 2033
- Table 47: Global Used Smartphone Market Revenue billion Forecast, by Country 2020 & 2033
- Table 48: Global Used Smartphone Market Volume Million Forecast, by Country 2020 & 2033
- Table 49: Global Used Smartphone Market Revenue billion Forecast, by Production Analysis 2020 & 2033
- Table 50: Global Used Smartphone Market Volume Million Forecast, by Production Analysis 2020 & 2033
- Table 51: Global Used Smartphone Market Revenue billion Forecast, by Consumption Analysis 2020 & 2033
- Table 52: Global Used Smartphone Market Volume Million Forecast, by Consumption Analysis 2020 & 2033
- Table 53: Global Used Smartphone Market Revenue billion Forecast, by Import Market Analysis (Value & Volume) 2020 & 2033
- Table 54: Global Used Smartphone Market Volume Million Forecast, by Import Market Analysis (Value & Volume) 2020 & 2033
- Table 55: Global Used Smartphone Market Revenue billion Forecast, by Export Market Analysis (Value & Volume) 2020 & 2033
- Table 56: Global Used Smartphone Market Volume Million Forecast, by Export Market Analysis (Value & Volume) 2020 & 2033
- Table 57: Global Used Smartphone Market Revenue billion Forecast, by Price Trend Analysis 2020 & 2033
- Table 58: Global Used Smartphone Market Volume Million Forecast, by Price Trend Analysis 2020 & 2033
- Table 59: Global Used Smartphone Market Revenue billion Forecast, by Country 2020 & 2033
- Table 60: Global Used Smartphone Market Volume Million Forecast, by Country 2020 & 2033
Frequently Asked Questions
1. What is the projected Compound Annual Growth Rate (CAGR) of the Used Smartphone Market?
The projected CAGR is approximately 22.6%.
2. Which companies are prominent players in the Used Smartphone Market?
Key companies in the market include Alibaba Group Holding Limited, Best Buy Co Inc, Reboxed Limited, Flipkart Internet Private Limited (Walmart Inc, Samsung Electronics Co Ltd, Verizon Communications Inc, FoneGiant, Paytm (One97 Communications Limited), Amazon com Inc, Nippon Telephone Inc, Back Market, AT&T Inc, Apple Inc.
3. What are the main segments of the Used Smartphone Market?
The market segments include Production Analysis, Consumption Analysis, Import Market Analysis (Value & Volume), Export Market Analysis (Value & Volume), Price Trend Analysis.
4. Can you provide details about the market size?
The market size is estimated to be USD 42.33 billion as of 2022.
5. What are some drivers contributing to market growth?
Trend Toward Premium Phones (Rise in Upgrade Costs); Growing Popularity of E-commerce Platforms for Used and Refurbished Smartphones; Telecom Operators Focusing on Used Phones with Attractive Plans.
6. What are the notable trends driving market growth?
Growing Popularity of E-commerce Platforms for Used and Refurbished Smartphones to Drive the Market.
7. Are there any restraints impacting market growth?
Short term supply chain challenges due to the pandemic scenario and the US-China Trade war scenario.
8. Can you provide examples of recent developments in the market?
December 2023 - Smartphone refurbishing startup ControlZ aims to invest nearly USD 2 million in its Gurugram repair facility again in 2024. The company aims to repair 1 lakh units at the facility in 2024 and scale it to 5 lakh units by 2025.
9. What pricing options are available for accessing the report?
Pricing options include single-user, multi-user, and enterprise licenses priced at USD 4750, USD 5250, and USD 8750 respectively.
10. Is the market size provided in terms of value or volume?
The market size is provided in terms of value, measured in billion and volume, measured in Million.
11. Are there any specific market keywords associated with the report?
Yes, the market keyword associated with the report is "Used Smartphone Market," which aids in identifying and referencing the specific market segment covered.
12. How do I determine which pricing option suits my needs best?
The pricing options vary based on user requirements and access needs. Individual users may opt for single-user licenses, while businesses requiring broader access may choose multi-user or enterprise licenses for cost-effective access to the report.
13. Are there any additional resources or data provided in the Used Smartphone Market report?
While the report offers comprehensive insights, it's advisable to review the specific contents or supplementary materials provided to ascertain if additional resources or data are available.
14. How can I stay updated on further developments or reports in the Used Smartphone Market?
To stay informed about further developments, trends, and reports in the Used Smartphone Market, consider subscribing to industry newsletters, following relevant companies and organizations, or regularly checking reputable industry news sources and publications.
Methodology
Step 1 - Identification of Relevant Samples Size from Population Database


Step 2 - Approaches for Defining Global Market Size (Value, Volume* & Price*)

Note*: In applicable scenarios
Step 3 - Data Sources
Primary Research
- Web Analytics
- Survey Reports
- Research Institute
- Latest Research Reports
- Opinion Leaders
Secondary Research
- Annual Reports
- White Paper
- Latest Press Release
- Industry Association
- Paid Database
- Investor Presentations

Step 4 - Data Triangulation
Involves using different sources of information in order to increase the validity of a study
These sources are likely to be stakeholders in a program - participants, other researchers, program staff, other community members, and so on.
Then we put all data in single framework & apply various statistical tools to find out the dynamic on the market.
During the analysis stage, feedback from the stakeholder groups would be compared to determine areas of agreement as well as areas of divergence