

Key Insights
The global video equipment market is experiencing robust growth, driven by the increasing demand for high-quality video content across various applications. From the proliferation of streaming services and the rise of professional-grade video creation for social media to the continued adoption of advanced technologies like 8K resolution and HDR, the market shows significant potential. The market's expansion is fueled by several key factors, including technological advancements leading to smaller, more powerful devices; falling prices making high-quality video equipment more accessible to consumers and professionals alike; and a growing preference for immersive viewing experiences. Key players such as Samsung, LG, Sony, Panasonic, and Toshiba are actively involved in product innovation and market expansion, constantly striving to meet evolving consumer demands and professional requirements.
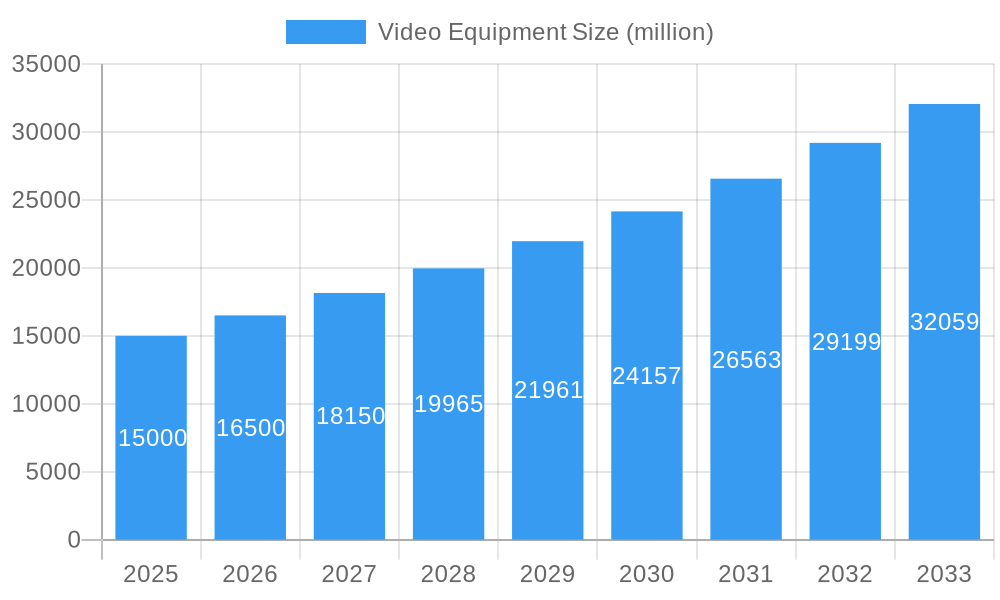
Video Equipment Market Size (In Billion)
Despite significant growth, certain restraints exist, including the cyclical nature of consumer electronics demand and the potential for supply chain disruptions. However, the ongoing technological advancements and the increasing integration of video equipment into diverse sectors like healthcare, education, and corporate communications are likely to offset these challenges. The market is segmented by product type (e.g., cameras, displays, projectors, recording devices) and application (e.g., consumer, professional, commercial), with the consumer segment currently dominating market share. This analysis projects continued growth across all segments, driven by innovation and increased affordability, particularly in emerging markets. We anticipate a sustained period of growth throughout the forecast period.
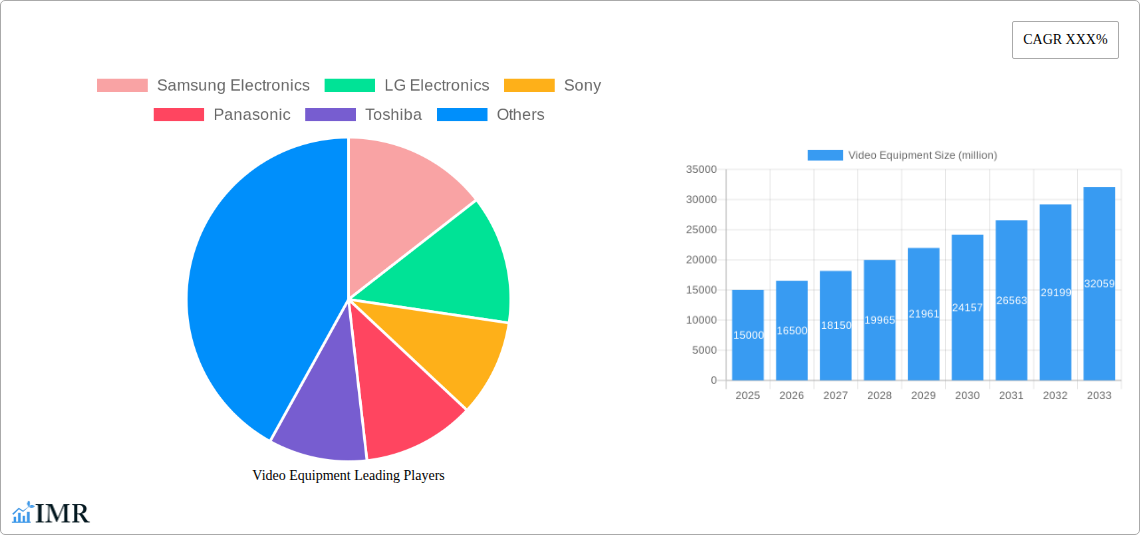
Video Equipment Company Market Share
Video Equipment Market Report: 2019-2033
Unlocking Growth in the Thriving Global Video Equipment Market: A Comprehensive Analysis
This comprehensive report provides an in-depth analysis of the global video equipment market, encompassing historical data (2019-2024), current estimates (2025), and future forecasts (2025-2033). We delve into market dynamics, growth trends, regional dominance, product landscapes, and key player strategies to provide a holistic understanding of this dynamic sector. The report is crucial for industry professionals, investors, and strategic decision-makers seeking actionable insights into the video equipment landscape. The market is segmented by type and application and is expected to reach xx million units by 2033.
Video Equipment Market Dynamics & Structure
The video equipment market is characterized by a moderate level of concentration, with key players like Samsung Electronics, LG Electronics, Sony, Panasonic, and Toshiba holding significant market share. The market is driven by technological innovation, particularly in areas like 4K/8K resolution, HDR, and AI-powered features. Regulatory frameworks surrounding broadcasting standards and data privacy influence market developments. Competition from substitute products, such as streaming services, presents a challenge, while mergers and acquisitions (M&A) activity reshape the competitive landscape. The end-user demographic is broadening, encompassing professional videographers, content creators, and home consumers.
- Market Concentration: Moderately concentrated, with top 5 players holding approximately xx% market share in 2025.
- Technological Innovation: Key drivers include advancements in image sensors, processing chips, and display technologies.
- Regulatory Frameworks: Compliance with broadcasting standards and data privacy regulations impact product development and market access.
- Competitive Substitutes: Streaming services and mobile devices pose a challenge to traditional video equipment.
- M&A Activity: xx M&A deals were recorded in the period 2019-2024, with a projected xx deals for 2025-2033.
- End-User Demographics: Expanding to include both professional and consumer segments, driven by increasing demand for high-quality video content creation and consumption.
Video Equipment Growth Trends & Insights
The global video equipment market experienced significant growth between 2019 and 2024, driven by increasing adoption rates of high-resolution displays and advanced video recording technologies. The market size expanded from xx million units in 2019 to xx million units in 2024, exhibiting a CAGR of xx%. The forecast period (2025-2033) projects continued expansion, reaching xx million units by 2033, fueled by technological advancements such as 8K resolution and the increasing demand for professional-grade video equipment in various sectors. Consumer behavior shifts towards high-quality video content consumption and creation further contribute to market growth. Technological disruptions, such as the rise of VR/AR technologies, are expected to further enhance market growth and create new opportunities. Market penetration is expected to reach xx% by 2033.
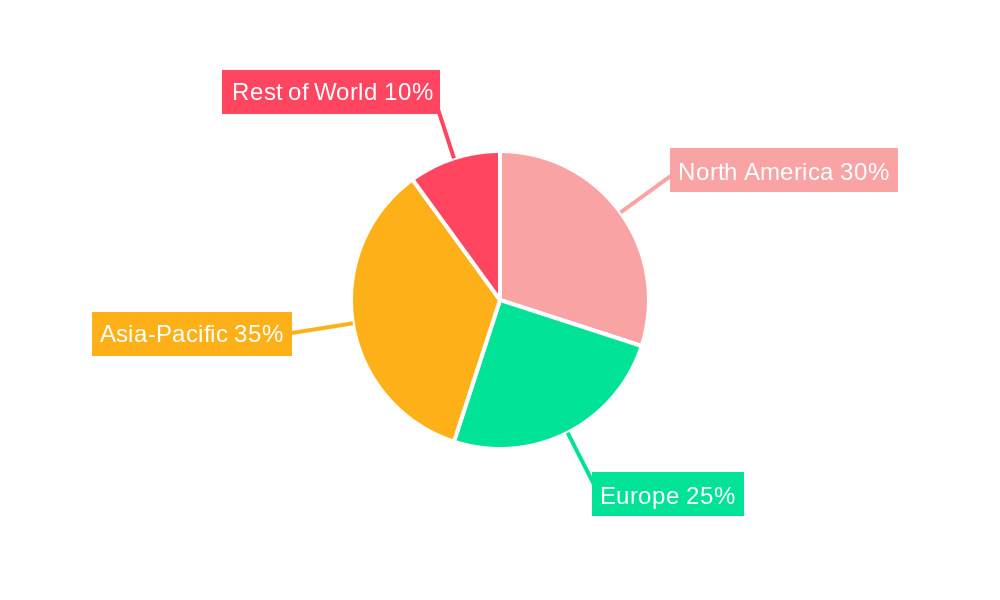
Dominant Regions, Countries, or Segments in Video Equipment
North America and Asia-Pacific currently dominate the video equipment market, driven by strong consumer demand, robust technological infrastructure, and favorable economic conditions. Within Asia-Pacific, China and Japan are leading markets due to significant investments in advanced technologies and expanding media production industries. The professional segment is the fastest-growing segment within the market, fueled by expanding sectors such as broadcasting and film production.
- North America: Strong consumer demand, well-established technology infrastructure, and high disposable incomes drive market dominance.
- Asia-Pacific: Rapid economic growth, expanding media and entertainment industry, and technological advancements fuel market growth.
- Europe: Steady growth, driven by rising adoption of high-quality video equipment in professional and consumer segments.
- Key Drivers: Favorable economic policies, robust infrastructure, and increasing demand for high-quality video content.
Video Equipment Product Landscape
The video equipment market offers a wide range of products, including cameras, camcorders, monitors, projectors, and related accessories. Recent innovations focus on improving image quality, enhancing functionality, and streamlining workflows. Features like 8K resolution, HDR (High Dynamic Range), and AI-powered image stabilization are becoming increasingly prevalent. The unique selling propositions of products are often centered around superior image quality, user-friendly interfaces, and advanced features catering to specific needs (e.g., professional vs. consumer).
Key Drivers, Barriers & Challenges in Video Equipment
Key Drivers: Technological advancements, rising demand for high-quality video content, expanding applications in various industries (e.g., healthcare, education, entertainment), and supportive government policies in specific regions. The increase in online video streaming and content creation has driven significant demand for professional-grade equipment.
Key Challenges & Restraints: Supply chain disruptions, rising component costs, intense competition, and regulatory hurdles impacting product development and market access. The cost of high-resolution displays and advanced processing chips affects overall product prices, limiting market penetration in certain regions.
Emerging Opportunities in Video Equipment
Emerging opportunities include the integration of AI and machine learning in video equipment, expanding applications in virtual and augmented reality (VR/AR), growth in the live streaming market and increasing demand for professional-grade equipment in niche markets (e.g., medical imaging, surveillance). The development of compact and portable high-quality video equipment also presents significant opportunities.
Growth Accelerators in the Video Equipment Industry
Technological breakthroughs, particularly in areas like AI-powered features, 8K resolution, and advanced image processing, are key catalysts. Strategic partnerships between equipment manufacturers and content creators accelerate market adoption. Market expansion strategies focused on untapped markets (e.g., developing economies) and the introduction of innovative product offerings further contribute to long-term growth.
Key Players Shaping the Video Equipment Market
Notable Milestones in Video Equipment Sector
- 2020: Sony releases its first 8K professional camcorder.
- 2021: Samsung introduces a new line of AI-powered video cameras.
- 2022: LG partners with a major streaming platform to develop specialized video equipment.
- 2023: Panasonic launches a new range of compact professional cameras with advanced features.
- 2024: Toshiba invests in R&D for next-generation display technologies.
In-Depth Video Equipment Market Outlook
The future of the video equipment market is bright, driven by continued technological innovation and the growing demand for high-quality video content across various sectors. Strategic opportunities exist for companies that can effectively leverage technological advancements, cater to evolving consumer preferences, and expand into untapped markets. The projected market growth indicates significant potential for investment and expansion in the video equipment sector.
Video Equipment Segmentation
-
1. Application
- 1.1. Online
- 1.2. Offline
-
2. Type
- 2.1. Televisions
- 2.2. Home Theatre Systems
- 2.3. DVD Players
- 2.4. Others
Video Equipment Segmentation By Geography
-
1. North America
- 1.1. United States
- 1.2. Canada
- 1.3. Mexico
-
2. South America
- 2.1. Brazil
- 2.2. Argentina
- 2.3. Rest of South America
-
3. Europe
- 3.1. United Kingdom
- 3.2. Germany
- 3.3. France
- 3.4. Italy
- 3.5. Spain
- 3.6. Russia
- 3.7. Benelux
- 3.8. Nordics
- 3.9. Rest of Europe
-
4. Middle East & Africa
- 4.1. Turkey
- 4.2. Israel
- 4.3. GCC
- 4.4. North Africa
- 4.5. South Africa
- 4.6. Rest of Middle East & Africa
-
5. Asia Pacific
- 5.1. China
- 5.2. India
- 5.3. Japan
- 5.4. South Korea
- 5.5. ASEAN
- 5.6. Oceania
- 5.7. Rest of Asia Pacific
Video Equipment Regional Market Share
Geographic Coverage of Video Equipment
Video Equipment REPORT HIGHLIGHTS
| Aspects | Details |
|---|---|
| Study Period | 2020-2034 |
| Base Year | 2025 |
| Estimated Year | 2026 |
| Forecast Period | 2026-2034 |
| Historical Period | 2020-2025 |
| Growth Rate | CAGR of 3.4% from 2020-2034 |
| Segmentation |
|
Table of Contents
- 1. Introduction
- 1.1. Research Scope
- 1.2. Market Segmentation
- 1.3. Research Objective
- 1.4. Definitions and Assumptions
- 2. Executive Summary
- 2.1. Market Snapshot
- 3. Market Dynamics
- 3.1. Market Drivers
- 3.2. Market Restrains
- 3.3. Market Trends
- 3.4. Market Opportunities
- 4. Market Factor Analysis
- 4.1. Porters Five Forces
- 4.1.1. Bargaining Power of Suppliers
- 4.1.2. Bargaining Power of Buyers
- 4.1.3. Threat of New Entrants
- 4.1.4. Threat of Substitutes
- 4.1.5. Competitive Rivalry
- 4.2. PESTEL analysis
- 4.3. BCG Analysis
- 4.3.1. Stars (High Growth, High Market Share)
- 4.3.2. Cash Cows (Low Growth, High Market Share)
- 4.3.3. Question Mark (High Growth, Low Market Share)
- 4.3.4. Dogs (Low Growth, Low Market Share)
- 4.4. Ansoff Matrix Analysis
- 4.5. Supply Chain Analysis
- 4.6. Regulatory Landscape
- 4.7. Current Market Potential and Opportunity Assessment (TAM–SAM–SOM Framework)
- 4.8. IMR Analyst Note
- 4.1. Porters Five Forces
- 5. Market Analysis, Insights and Forecast 2021-2033
- 5.1. Market Analysis, Insights and Forecast - by Application
- 5.1.1. Online
- 5.1.2. Offline
- 5.2. Market Analysis, Insights and Forecast - by Type
- 5.2.1. Televisions
- 5.2.2. Home Theatre Systems
- 5.2.3. DVD Players
- 5.2.4. Others
- 5.3. Market Analysis, Insights and Forecast - by Region
- 5.3.1. North America
- 5.3.2. South America
- 5.3.3. Europe
- 5.3.4. Middle East & Africa
- 5.3.5. Asia Pacific
- 5.1. Market Analysis, Insights and Forecast - by Application
- 6. Global Video Equipment Analysis, Insights and Forecast, 2021-2033
- 6.1. Market Analysis, Insights and Forecast - by Application
- 6.1.1. Online
- 6.1.2. Offline
- 6.2. Market Analysis, Insights and Forecast - by Type
- 6.2.1. Televisions
- 6.2.2. Home Theatre Systems
- 6.2.3. DVD Players
- 6.2.4. Others
- 6.1. Market Analysis, Insights and Forecast - by Application
- 7. North America Video Equipment Analysis, Insights and Forecast, 2020-2032
- 7.1. Market Analysis, Insights and Forecast - by Application
- 7.1.1. Online
- 7.1.2. Offline
- 7.2. Market Analysis, Insights and Forecast - by Type
- 7.2.1. Televisions
- 7.2.2. Home Theatre Systems
- 7.2.3. DVD Players
- 7.2.4. Others
- 7.1. Market Analysis, Insights and Forecast - by Application
- 8. South America Video Equipment Analysis, Insights and Forecast, 2020-2032
- 8.1. Market Analysis, Insights and Forecast - by Application
- 8.1.1. Online
- 8.1.2. Offline
- 8.2. Market Analysis, Insights and Forecast - by Type
- 8.2.1. Televisions
- 8.2.2. Home Theatre Systems
- 8.2.3. DVD Players
- 8.2.4. Others
- 8.1. Market Analysis, Insights and Forecast - by Application
- 9. Europe Video Equipment Analysis, Insights and Forecast, 2020-2032
- 9.1. Market Analysis, Insights and Forecast - by Application
- 9.1.1. Online
- 9.1.2. Offline
- 9.2. Market Analysis, Insights and Forecast - by Type
- 9.2.1. Televisions
- 9.2.2. Home Theatre Systems
- 9.2.3. DVD Players
- 9.2.4. Others
- 9.1. Market Analysis, Insights and Forecast - by Application
- 10. Middle East & Africa Video Equipment Analysis, Insights and Forecast, 2020-2032
- 10.1. Market Analysis, Insights and Forecast - by Application
- 10.1.1. Online
- 10.1.2. Offline
- 10.2. Market Analysis, Insights and Forecast - by Type
- 10.2.1. Televisions
- 10.2.2. Home Theatre Systems
- 10.2.3. DVD Players
- 10.2.4. Others
- 10.1. Market Analysis, Insights and Forecast - by Application
- 11. Asia Pacific Video Equipment Analysis, Insights and Forecast, 2020-2032
- 11.1. Market Analysis, Insights and Forecast - by Application
- 11.1.1. Online
- 11.1.2. Offline
- 11.2. Market Analysis, Insights and Forecast - by Type
- 11.2.1. Televisions
- 11.2.2. Home Theatre Systems
- 11.2.3. DVD Players
- 11.2.4. Others
- 11.1. Market Analysis, Insights and Forecast - by Application
- 12. Competitive Analysis
- 12.1. Company Profiles
- 12.1.1 Samsung Electronics
- 12.1.1.1. Company Overview
- 12.1.1.2. Products
- 12.1.1.3. Company Financials
- 12.1.1.4. SWOT Analysis
- 12.1.2 LG Electronics
- 12.1.2.1. Company Overview
- 12.1.2.2. Products
- 12.1.2.3. Company Financials
- 12.1.2.4. SWOT Analysis
- 12.1.3 Sony
- 12.1.3.1. Company Overview
- 12.1.3.2. Products
- 12.1.3.3. Company Financials
- 12.1.3.4. SWOT Analysis
- 12.1.4 Panasonic
- 12.1.4.1. Company Overview
- 12.1.4.2. Products
- 12.1.4.3. Company Financials
- 12.1.4.4. SWOT Analysis
- 12.1.5 Toshiba
- 12.1.5.1. Company Overview
- 12.1.5.2. Products
- 12.1.5.3. Company Financials
- 12.1.5.4. SWOT Analysis
- 12.1.1 Samsung Electronics
- 12.2. Market Entropy
- 12.2.1 Company's Key Areas Served
- 12.2.2 Recent Developments
- 12.3. Company Market Share Analysis 2025
- 12.3.1 Top 5 Companies Market Share Analysis
- 12.3.2 Top 3 Companies Market Share Analysis
- 12.4. List of Potential Customers
- 13. Research Methodology
List of Figures
- Figure 1: Global Video Equipment Revenue Breakdown (undefined, %) by Region 2025 & 2033
- Figure 2: North America Video Equipment Revenue (undefined), by Application 2025 & 2033
- Figure 3: North America Video Equipment Revenue Share (%), by Application 2025 & 2033
- Figure 4: North America Video Equipment Revenue (undefined), by Type 2025 & 2033
- Figure 5: North America Video Equipment Revenue Share (%), by Type 2025 & 2033
- Figure 6: North America Video Equipment Revenue (undefined), by Country 2025 & 2033
- Figure 7: North America Video Equipment Revenue Share (%), by Country 2025 & 2033
- Figure 8: South America Video Equipment Revenue (undefined), by Application 2025 & 2033
- Figure 9: South America Video Equipment Revenue Share (%), by Application 2025 & 2033
- Figure 10: South America Video Equipment Revenue (undefined), by Type 2025 & 2033
- Figure 11: South America Video Equipment Revenue Share (%), by Type 2025 & 2033
- Figure 12: South America Video Equipment Revenue (undefined), by Country 2025 & 2033
- Figure 13: South America Video Equipment Revenue Share (%), by Country 2025 & 2033
- Figure 14: Europe Video Equipment Revenue (undefined), by Application 2025 & 2033
- Figure 15: Europe Video Equipment Revenue Share (%), by Application 2025 & 2033
- Figure 16: Europe Video Equipment Revenue (undefined), by Type 2025 & 2033
- Figure 17: Europe Video Equipment Revenue Share (%), by Type 2025 & 2033
- Figure 18: Europe Video Equipment Revenue (undefined), by Country 2025 & 2033
- Figure 19: Europe Video Equipment Revenue Share (%), by Country 2025 & 2033
- Figure 20: Middle East & Africa Video Equipment Revenue (undefined), by Application 2025 & 2033
- Figure 21: Middle East & Africa Video Equipment Revenue Share (%), by Application 2025 & 2033
- Figure 22: Middle East & Africa Video Equipment Revenue (undefined), by Type 2025 & 2033
- Figure 23: Middle East & Africa Video Equipment Revenue Share (%), by Type 2025 & 2033
- Figure 24: Middle East & Africa Video Equipment Revenue (undefined), by Country 2025 & 2033
- Figure 25: Middle East & Africa Video Equipment Revenue Share (%), by Country 2025 & 2033
- Figure 26: Asia Pacific Video Equipment Revenue (undefined), by Application 2025 & 2033
- Figure 27: Asia Pacific Video Equipment Revenue Share (%), by Application 2025 & 2033
- Figure 28: Asia Pacific Video Equipment Revenue (undefined), by Type 2025 & 2033
- Figure 29: Asia Pacific Video Equipment Revenue Share (%), by Type 2025 & 2033
- Figure 30: Asia Pacific Video Equipment Revenue (undefined), by Country 2025 & 2033
- Figure 31: Asia Pacific Video Equipment Revenue Share (%), by Country 2025 & 2033
List of Tables
- Table 1: Global Video Equipment Revenue undefined Forecast, by Application 2020 & 2033
- Table 2: Global Video Equipment Revenue undefined Forecast, by Type 2020 & 2033
- Table 3: Global Video Equipment Revenue undefined Forecast, by Region 2020 & 2033
- Table 4: Global Video Equipment Revenue undefined Forecast, by Application 2020 & 2033
- Table 5: Global Video Equipment Revenue undefined Forecast, by Type 2020 & 2033
- Table 6: Global Video Equipment Revenue undefined Forecast, by Country 2020 & 2033
- Table 7: United States Video Equipment Revenue (undefined) Forecast, by Application 2020 & 2033
- Table 8: Canada Video Equipment Revenue (undefined) Forecast, by Application 2020 & 2033
- Table 9: Mexico Video Equipment Revenue (undefined) Forecast, by Application 2020 & 2033
- Table 10: Global Video Equipment Revenue undefined Forecast, by Application 2020 & 2033
- Table 11: Global Video Equipment Revenue undefined Forecast, by Type 2020 & 2033
- Table 12: Global Video Equipment Revenue undefined Forecast, by Country 2020 & 2033
- Table 13: Brazil Video Equipment Revenue (undefined) Forecast, by Application 2020 & 2033
- Table 14: Argentina Video Equipment Revenue (undefined) Forecast, by Application 2020 & 2033
- Table 15: Rest of South America Video Equipment Revenue (undefined) Forecast, by Application 2020 & 2033
- Table 16: Global Video Equipment Revenue undefined Forecast, by Application 2020 & 2033
- Table 17: Global Video Equipment Revenue undefined Forecast, by Type 2020 & 2033
- Table 18: Global Video Equipment Revenue undefined Forecast, by Country 2020 & 2033
- Table 19: United Kingdom Video Equipment Revenue (undefined) Forecast, by Application 2020 & 2033
- Table 20: Germany Video Equipment Revenue (undefined) Forecast, by Application 2020 & 2033
- Table 21: France Video Equipment Revenue (undefined) Forecast, by Application 2020 & 2033
- Table 22: Italy Video Equipment Revenue (undefined) Forecast, by Application 2020 & 2033
- Table 23: Spain Video Equipment Revenue (undefined) Forecast, by Application 2020 & 2033
- Table 24: Russia Video Equipment Revenue (undefined) Forecast, by Application 2020 & 2033
- Table 25: Benelux Video Equipment Revenue (undefined) Forecast, by Application 2020 & 2033
- Table 26: Nordics Video Equipment Revenue (undefined) Forecast, by Application 2020 & 2033
- Table 27: Rest of Europe Video Equipment Revenue (undefined) Forecast, by Application 2020 & 2033
- Table 28: Global Video Equipment Revenue undefined Forecast, by Application 2020 & 2033
- Table 29: Global Video Equipment Revenue undefined Forecast, by Type 2020 & 2033
- Table 30: Global Video Equipment Revenue undefined Forecast, by Country 2020 & 2033
- Table 31: Turkey Video Equipment Revenue (undefined) Forecast, by Application 2020 & 2033
- Table 32: Israel Video Equipment Revenue (undefined) Forecast, by Application 2020 & 2033
- Table 33: GCC Video Equipment Revenue (undefined) Forecast, by Application 2020 & 2033
- Table 34: North Africa Video Equipment Revenue (undefined) Forecast, by Application 2020 & 2033
- Table 35: South Africa Video Equipment Revenue (undefined) Forecast, by Application 2020 & 2033
- Table 36: Rest of Middle East & Africa Video Equipment Revenue (undefined) Forecast, by Application 2020 & 2033
- Table 37: Global Video Equipment Revenue undefined Forecast, by Application 2020 & 2033
- Table 38: Global Video Equipment Revenue undefined Forecast, by Type 2020 & 2033
- Table 39: Global Video Equipment Revenue undefined Forecast, by Country 2020 & 2033
- Table 40: China Video Equipment Revenue (undefined) Forecast, by Application 2020 & 2033
- Table 41: India Video Equipment Revenue (undefined) Forecast, by Application 2020 & 2033
- Table 42: Japan Video Equipment Revenue (undefined) Forecast, by Application 2020 & 2033
- Table 43: South Korea Video Equipment Revenue (undefined) Forecast, by Application 2020 & 2033
- Table 44: ASEAN Video Equipment Revenue (undefined) Forecast, by Application 2020 & 2033
- Table 45: Oceania Video Equipment Revenue (undefined) Forecast, by Application 2020 & 2033
- Table 46: Rest of Asia Pacific Video Equipment Revenue (undefined) Forecast, by Application 2020 & 2033
Frequently Asked Questions
1. What is the projected Compound Annual Growth Rate (CAGR) of the Video Equipment?
The projected CAGR is approximately 3.4%.
2. Which companies are prominent players in the Video Equipment?
Key companies in the market include Samsung Electronics, LG Electronics, Sony, Panasonic, Toshiba.
3. What are the main segments of the Video Equipment?
The market segments include Application, Type.
4. Can you provide details about the market size?
The market size is estimated to be USD XXX N/A as of 2022.
5. What are some drivers contributing to market growth?
N/A
6. What are the notable trends driving market growth?
N/A
7. Are there any restraints impacting market growth?
N/A
8. Can you provide examples of recent developments in the market?
N/A
9. What pricing options are available for accessing the report?
Pricing options include single-user, multi-user, and enterprise licenses priced at USD 2900.00, USD 4350.00, and USD 5800.00 respectively.
10. Is the market size provided in terms of value or volume?
The market size is provided in terms of value, measured in N/A.
11. Are there any specific market keywords associated with the report?
Yes, the market keyword associated with the report is "Video Equipment," which aids in identifying and referencing the specific market segment covered.
12. How do I determine which pricing option suits my needs best?
The pricing options vary based on user requirements and access needs. Individual users may opt for single-user licenses, while businesses requiring broader access may choose multi-user or enterprise licenses for cost-effective access to the report.
13. Are there any additional resources or data provided in the Video Equipment report?
While the report offers comprehensive insights, it's advisable to review the specific contents or supplementary materials provided to ascertain if additional resources or data are available.
14. How can I stay updated on further developments or reports in the Video Equipment?
To stay informed about further developments, trends, and reports in the Video Equipment, consider subscribing to industry newsletters, following relevant companies and organizations, or regularly checking reputable industry news sources and publications.
Methodology
Step 1 - Identification of Relevant Samples Size from Population Database


Step 2 - Approaches for Defining Global Market Size (Value, Volume* & Price*)

Note*: In applicable scenarios
Step 3 - Data Sources
Primary Research
- Web Analytics
- Survey Reports
- Research Institute
- Latest Research Reports
- Opinion Leaders
Secondary Research
- Annual Reports
- White Paper
- Latest Press Release
- Industry Association
- Paid Database
- Investor Presentations

Step 4 - Data Triangulation
Involves using different sources of information in order to increase the validity of a study
These sources are likely to be stakeholders in a program - participants, other researchers, program staff, other community members, and so on.
Then we put all data in single framework & apply various statistical tools to find out the dynamic on the market.
During the analysis stage, feedback from the stakeholder groups would be compared to determine areas of agreement as well as areas of divergence