

Key Insights
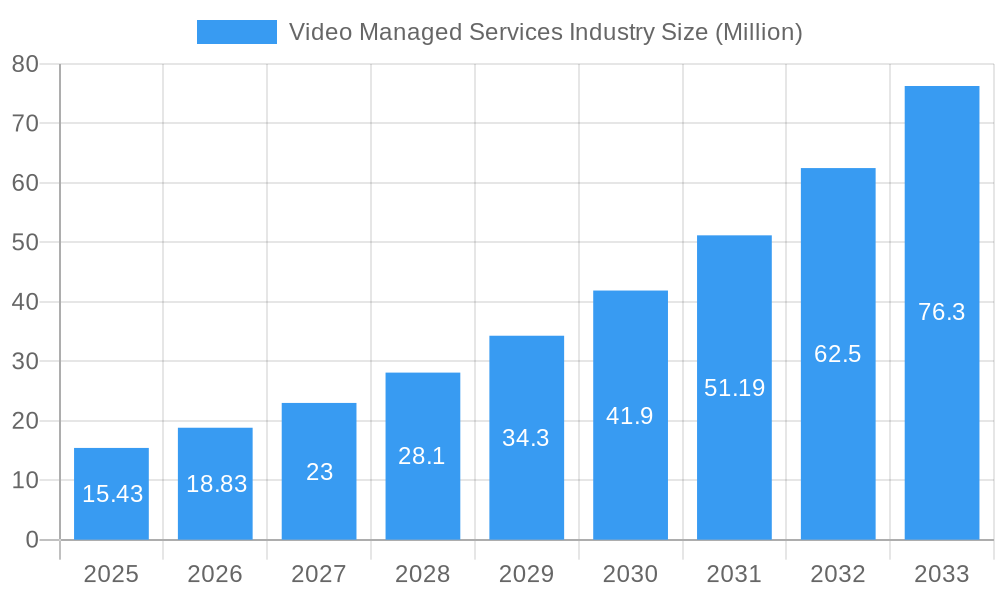
The Video Managed Services market is poised for substantial growth, projected to reach $15.43 million with an impressive Compound Annual Growth Rate (CAGR) of 22.25% from 2019 to 2033. This robust expansion is primarily driven by the increasing adoption of cloud-based communication solutions, the escalating demand for seamless collaboration across dispersed workforces, and the critical need for reliable video conferencing infrastructure in today's interconnected business environment. Organizations are increasingly recognizing the strategic advantage of outsourcing their video infrastructure management to specialized service providers, allowing them to focus on core competencies while benefiting from advanced technology, enhanced security, and cost efficiencies. The shift towards remote and hybrid work models, further accelerated by global events, has cemented the indispensable role of video managed services in maintaining business continuity and fostering effective communication.
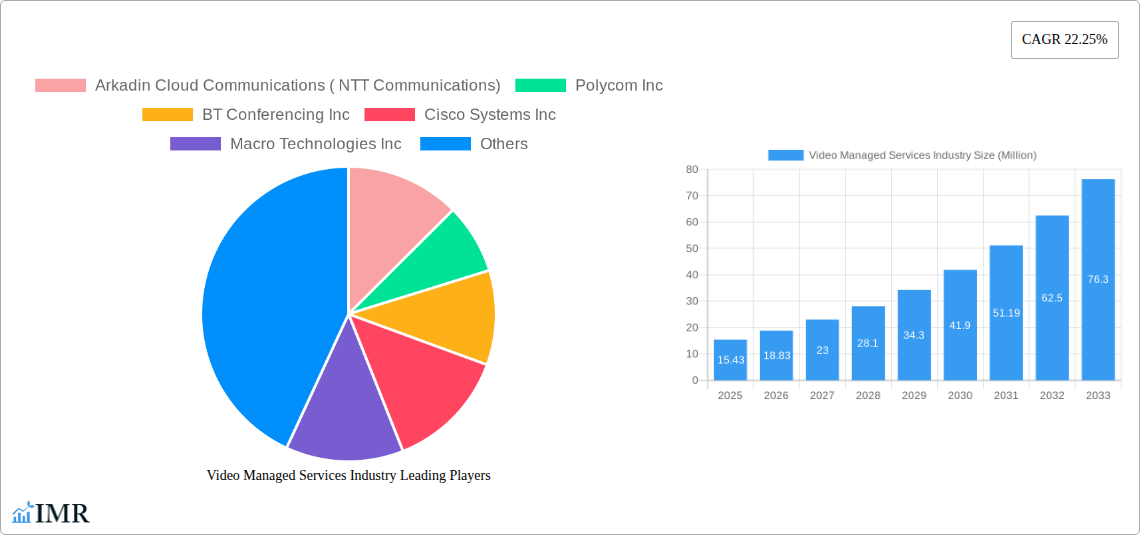
Video Managed Services Industry Market Size (In Million)
The market is further segmented by type, with both software and hardware components playing crucial roles in delivering comprehensive video managed solutions. Enterprise size also presents a significant differentiator, with large enterprises leading the adoption due to their complex communication needs and smaller and medium-sized enterprises (SMEs) increasingly leveraging these services for competitive advantage and scalability. Applications span both Business-to-Business (B2B) and Business-to-Consumer (B2C) interactions, highlighting the pervasive influence of video managed services across diverse operational landscapes. While the market shows strong upward momentum, potential restraints may include initial implementation costs, concerns around data security and privacy, and the availability of skilled IT professionals to manage advanced video systems. However, the overwhelming benefits of improved productivity, reduced operational overhead, and enhanced stakeholder engagement are expected to outweigh these challenges, propelling the Video Managed Services industry to new heights.
Video Managed Services Industry Company Market Share
Unveiling the Future of Seamless Communication: Video Managed Services Industry Report (2019-2033)
This comprehensive report offers an in-depth analysis of the Video Managed Services Industry, a rapidly evolving sector crucial for modern business operations and consumer engagement. Delving into market dynamics, growth trends, regional dominance, and product landscapes, this research equips industry professionals with actionable insights for strategic decision-making. Covering the period from 2019 to 2033, with a base year of 2025, this report presents a robust outlook on the future of video communication solutions.
Video Managed Services Industry Market Dynamics & Structure
The Video Managed Services Industry is characterized by a moderately concentrated market, with key players like Cisco Systems Inc., Arkadin Cloud Communications (NTT Communications), and Polycom Inc. holding significant influence. Technological innovation, particularly in cloud-based solutions, AI integration, and enhanced security protocols, acts as a primary driver. Emerging technologies such as 5G connectivity and advanced codec developments are continuously reshaping the service offerings. Regulatory frameworks, while generally supportive of digital transformation, focus on data privacy and security, influencing service provider compliance. Competitive product substitutes, including traditional teleconferencing and pure software-as-a-service (SaaS) solutions, exist but often lack the comprehensive integration and support offered by managed service providers. End-user demographics are increasingly diverse, with a growing demand from both Large Enterprise clients seeking sophisticated, scalable solutions and Small & Medium Enterprise (SME) segments looking for cost-effective, user-friendly platforms. Merger and acquisition (M&A) trends are active, with larger entities acquiring innovative startups to expand their service portfolios and market reach. For instance, recent M&A activities within the broader IT services sector hint at consolidation opportunities within video managed services. Barriers to innovation include the high cost of developing and implementing cutting-edge technologies and the need for continuous talent acquisition and upskilling in specialized technical areas.
- Market Concentration: Moderate, with a few dominant players and a growing number of specialized niche providers.
- Technological Innovation Drivers: Cloud adoption, AI for analytics and automation, 5G, advanced video compression, and enhanced user experience features.
- Regulatory Frameworks: Focus on data security, privacy (e.g., GDPR, CCPA), and telecommunications compliance.
- Competitive Product Substitutes: Standalone video conferencing software, web conferencing tools, and traditional telephony services.
- End-User Demographics: Broad, spanning various industries and business sizes, with a significant shift towards hybrid work models.
- M&A Trends: Ongoing, driven by the need for market consolidation, technology acquisition, and service diversification. Estimated M&A deal volume in related IT services sectors shows an upward trend.
Video Managed Services Industry Growth Trends & Insights
The Video Managed Services Industry is poised for substantial growth, projected to expand significantly over the forecast period (2025-2033). The market size evolution is being propelled by the escalating adoption of remote and hybrid work models, which have normalized the use of advanced video communication tools across all business functions. Market penetration is rapidly increasing, as organizations of all sizes recognize the imperative for seamless, reliable, and secure video conferencing and collaboration solutions. Technological disruptions, including the integration of artificial intelligence for enhanced meeting analytics, automated transcription, and virtual backgrounds, are transforming the user experience and driving adoption. Consumer behavior shifts are evident, with a growing preference for integrated platforms that offer video, audio, and content sharing capabilities in a unified interface. The demand for Business to Business (B2B) applications remains dominant, fueled by enterprises seeking to improve internal collaboration, client engagement, and remote team management. However, the Business to Consumer (B2C) segment is also witnessing growth, particularly in areas like remote education, telehealth, and social virtual interactions. The Compound Annual Growth Rate (CAGR) for the Video Managed Services Industry is robust, reflecting the sustained demand for these essential communication tools. Factors such as the increasing global workforce mobility and the need for real-time collaboration across geographically dispersed teams are key contributors to this upward trajectory. The increasing reliance on cloud infrastructure for scalability and accessibility further bolsters market expansion. The industry is moving beyond basic video calls to encompass a broader range of managed services, including content creation and distribution, virtual event management, and interactive collaboration suites.
Dominant Regions, Countries, or Segments in Video Managed Services Industry
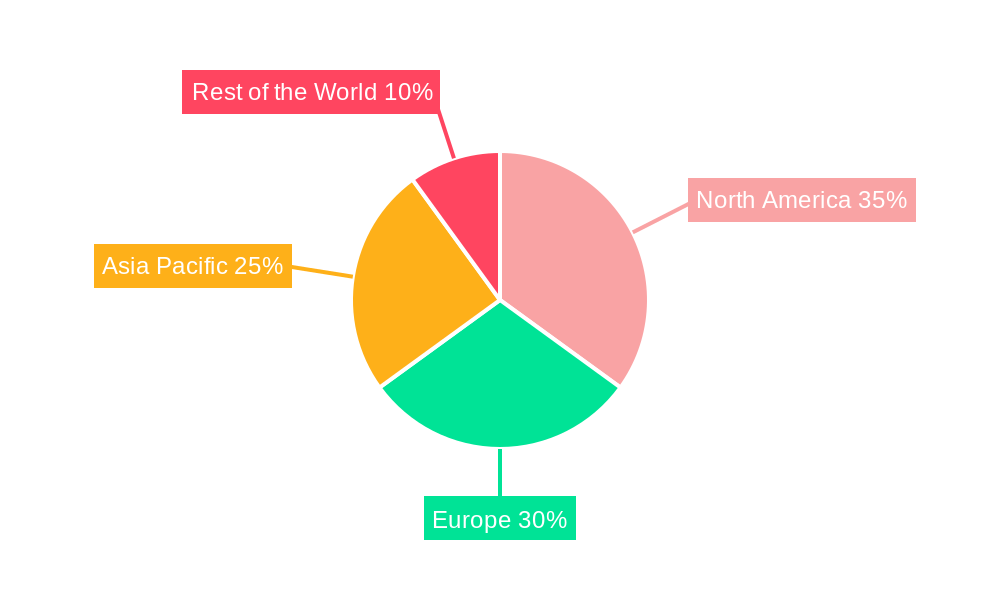
North America, particularly the United States, is projected to be the dominant region in the Video Managed Services Industry. This dominance is attributed to several interconnected factors: a strong existing technological infrastructure, a high concentration of Large Enterprise businesses with significant IT spending, and an early and widespread adoption of remote and hybrid work policies. The region's robust economy and a culture that embraces innovation further contribute to its leading position. From a segmentation perspective, Software-based video managed services are experiencing unparalleled growth, driven by the shift towards cloud-native solutions offering scalability, flexibility, and ease of deployment. This segment's market share is expected to continue its upward trajectory as organizations prioritize subscription-based models and advanced functionalities. Within enterprise size, Large Enterprise remains the primary driver of demand, leveraging managed services for complex, global communication needs, including secure video conferencing, virtual event hosting, and integrated collaboration platforms. However, the Small & Medium Enterprise (SME) segment is demonstrating significant growth potential, as more affordable and user-friendly managed video solutions become available, empowering smaller businesses to compete effectively. The Business to Business (B2B) application segment overwhelmingly dominates the market. Enterprises utilize video managed services for a wide array of critical functions, from daily team meetings and client presentations to large-scale virtual conferences and training sessions. The need for secure, reliable, and feature-rich platforms to facilitate seamless communication in a dispersed workforce is paramount. Economic policies that support digital transformation and investment in advanced communication technologies further strengthen the market position of leading regions and segments. The availability of skilled IT professionals and service providers capable of delivering and managing these complex solutions also plays a crucial role.
- Dominant Region: North America, with the United States at the forefront.
- Key Drivers in North America: High IT spending, early remote/hybrid work adoption, robust infrastructure, and innovation culture.
- Dominant Segment (Type): Software, driven by cloud adoption and SaaS models.
- Dominant Segment (Enterprise Size): Large Enterprise, with significant growth in the Small & Medium Enterprise (SME) sector.
- Dominant Segment (Applications): Business to Business (B2B), encompassing internal collaboration, client engagement, and virtual events.
- Growth Potential in SMEs: Increasing due to affordability and accessibility of managed video solutions.
Video Managed Services Industry Product Landscape
The product landscape of the Video Managed Services Industry is characterized by continuous innovation focused on enhancing user experience, security, and integration. Key product innovations include AI-powered features for automated meeting summaries, real-time transcription, and intelligent participant engagement tracking. Advanced hardware solutions, such as high-definition cameras with intelligent framing and noise-cancellation microphones, are becoming standard. Cloud-based platforms offer seamless integration with other business productivity tools, enabling unified communication and collaboration. Performance metrics are driven by low latency, high video and audio quality, robust security protocols, and scalable infrastructure. Unique selling propositions often revolve around end-to-end service management, offering clients a hassle-free experience from deployment to ongoing support and maintenance.
Key Drivers, Barriers & Challenges in Video Managed Services Industry
The Video Managed Services Industry is propelled by several key drivers. The widespread adoption of remote and hybrid work models is the most significant catalyst, necessitating reliable video communication. Increasing demand for enhanced collaboration and productivity tools fuels market growth. Technological advancements, including AI integration and cloud scalability, offer compelling solutions. The need for secure and compliant communication channels for sensitive business operations also drives adoption.
- Key Drivers: Remote/hybrid work, demand for collaboration, technological advancements (AI, cloud), security requirements.
Key challenges and restraints include the substantial initial investment required for advanced infrastructure and software development. Intense competition from both established players and emerging startups can lead to price pressures. Cybersecurity threats and data privacy concerns necessitate robust security measures, adding to operational costs. The complexity of integrating diverse systems and ensuring seamless interoperability across different platforms can also pose challenges. Supply chain disruptions for hardware components can impact service delivery timelines.
- Key Challenges: High initial investment, intense competition, cybersecurity threats, integration complexities, supply chain issues.
Emerging Opportunities in Video Managed Services Industry
Emerging opportunities in the Video Managed Services Industry lie in the expansion of immersive collaboration experiences, including virtual reality (VR) and augmented reality (AR) integrations for more engaging virtual meetings. The growing demand for specialized managed services for specific industries, such as healthcare (telehealth) and education (remote learning), presents a significant untapped market. The increasing focus on sustainability and reduced business travel also creates opportunities for sophisticated virtual event management solutions.
Growth Accelerators in the Video Managed Services Industry Industry
Growth accelerators for the Video Managed Services Industry include strategic partnerships between technology providers and managed service organizations to offer bundled solutions. The continuous development and adoption of AI and machine learning within video platforms to enhance functionality and user experience will be a major catalyst. Market expansion into emerging economies with growing digital infrastructure and increasing enterprise adoption of remote work policies will also drive long-term growth.
Key Players Shaping the Video Managed Services Industry Market
- Arkadin Cloud Communications (NTT Communications)
- Polycom Inc.
- BT Conferencing Inc.
- Cisco Systems Inc.
- Macro Technologies Inc.
- Applied Global Technologies
- Dimension Data
- AVI-SPL Inc.
- ZTE Enterprise
- AT&T Business
- Telus Communications
- Vega Global
Notable Milestones in Video Managed Services Industry Sector
- August 2023: Quantum Corporation partnered with Tiger Surveillance to deliver end-to-end solutions for long-term retention and archiving of video surveillance data. This strategic move enhances capabilities in data management for video-intensive industries.
- June 2023: Check Point Software Technologies Ltd. partnered with TELUS to launch the TELUS Cloud Security Posture Management (CSPM) service in Canada. This collaboration strengthens cloud security offerings, a critical component for managed video services.
In-Depth Video Managed Services Industry Market Outlook
The Video Managed Services Industry is on a trajectory of robust future growth, driven by an ever-increasing reliance on digital communication and collaboration. The market outlook is bright, with continued innovation in AI, immersive technologies, and security protocols expected to shape service offerings. Strategic opportunities abound in catering to specific industry verticals and expanding service portfolios to encompass comprehensive digital interaction management. The industry's ability to adapt to evolving work paradigms and technological advancements will be crucial for sustained success and capturing future market potential.
Video Managed Services Industry Segmentation
-
1. Type
- 1.1. Software
- 1.2. Hardware
-
2. Enterprise Size
- 2.1. Large Enterprise
- 2.2. Small & Medium Enterprise
-
3. Applications
- 3.1. Business to Business
- 3.2. Business to Consumer
Video Managed Services Industry Segmentation By Geography
- 1. North America
- 2. Europe
- 3. Asia Pacific
- 4. Rest of the World
Video Managed Services Industry Regional Market Share
Geographic Coverage of Video Managed Services Industry
Video Managed Services Industry REPORT HIGHLIGHTS
| Aspects | Details |
|---|---|
| Study Period | 2020-2034 |
| Base Year | 2025 |
| Estimated Year | 2026 |
| Forecast Period | 2026-2034 |
| Historical Period | 2020-2025 |
| Growth Rate | CAGR of 22.25% from 2020-2034 |
| Segmentation |
|
Table of Contents
- 1. Introduction
- 1.1. Research Scope
- 1.2. Market Segmentation
- 1.3. Research Objective
- 1.4. Definitions and Assumptions
- 2. Executive Summary
- 2.1. Market Snapshot
- 3. Market Dynamics
- 3.1. Market Drivers
- 3.2. Market Restrains
- 3.3. Market Trends
- 3.4. Market Opportunities
- 4. Market Factor Analysis
- 4.1. Porters Five Forces
- 4.1.1. Bargaining Power of Suppliers
- 4.1.2. Bargaining Power of Buyers
- 4.1.3. Threat of New Entrants
- 4.1.4. Threat of Substitutes
- 4.1.5. Competitive Rivalry
- 4.2. PESTEL analysis
- 4.3. BCG Analysis
- 4.3.1. Stars (High Growth, High Market Share)
- 4.3.2. Cash Cows (Low Growth, High Market Share)
- 4.3.3. Question Mark (High Growth, Low Market Share)
- 4.3.4. Dogs (Low Growth, Low Market Share)
- 4.4. Ansoff Matrix Analysis
- 4.5. Supply Chain Analysis
- 4.6. Regulatory Landscape
- 4.7. Current Market Potential and Opportunity Assessment (TAM–SAM–SOM Framework)
- 4.8. IMR Analyst Note
- 4.1. Porters Five Forces
- 5. Market Analysis, Insights and Forecast 2021-2033
- 5.1. Market Analysis, Insights and Forecast - by Type
- 5.1.1. Software
- 5.1.2. Hardware
- 5.2. Market Analysis, Insights and Forecast - by Enterprise Size
- 5.2.1. Large Enterprise
- 5.2.2. Small & Medium Enterprise
- 5.3. Market Analysis, Insights and Forecast - by Applications
- 5.3.1. Business to Business
- 5.3.2. Business to Consumer
- 5.4. Market Analysis, Insights and Forecast - by Region
- 5.4.1. North America
- 5.4.2. Europe
- 5.4.3. Asia Pacific
- 5.4.4. Rest of the World
- 5.1. Market Analysis, Insights and Forecast - by Type
- 6. Global Video Managed Services Industry Analysis, Insights and Forecast, 2021-2033
- 6.1. Market Analysis, Insights and Forecast - by Type
- 6.1.1. Software
- 6.1.2. Hardware
- 6.2. Market Analysis, Insights and Forecast - by Enterprise Size
- 6.2.1. Large Enterprise
- 6.2.2. Small & Medium Enterprise
- 6.3. Market Analysis, Insights and Forecast - by Applications
- 6.3.1. Business to Business
- 6.3.2. Business to Consumer
- 6.1. Market Analysis, Insights and Forecast - by Type
- 7. North America Video Managed Services Industry Analysis, Insights and Forecast, 2020-2032
- 7.1. Market Analysis, Insights and Forecast - by Type
- 7.1.1. Software
- 7.1.2. Hardware
- 7.2. Market Analysis, Insights and Forecast - by Enterprise Size
- 7.2.1. Large Enterprise
- 7.2.2. Small & Medium Enterprise
- 7.3. Market Analysis, Insights and Forecast - by Applications
- 7.3.1. Business to Business
- 7.3.2. Business to Consumer
- 7.1. Market Analysis, Insights and Forecast - by Type
- 8. Europe Video Managed Services Industry Analysis, Insights and Forecast, 2020-2032
- 8.1. Market Analysis, Insights and Forecast - by Type
- 8.1.1. Software
- 8.1.2. Hardware
- 8.2. Market Analysis, Insights and Forecast - by Enterprise Size
- 8.2.1. Large Enterprise
- 8.2.2. Small & Medium Enterprise
- 8.3. Market Analysis, Insights and Forecast - by Applications
- 8.3.1. Business to Business
- 8.3.2. Business to Consumer
- 8.1. Market Analysis, Insights and Forecast - by Type
- 9. Asia Pacific Video Managed Services Industry Analysis, Insights and Forecast, 2020-2032
- 9.1. Market Analysis, Insights and Forecast - by Type
- 9.1.1. Software
- 9.1.2. Hardware
- 9.2. Market Analysis, Insights and Forecast - by Enterprise Size
- 9.2.1. Large Enterprise
- 9.2.2. Small & Medium Enterprise
- 9.3. Market Analysis, Insights and Forecast - by Applications
- 9.3.1. Business to Business
- 9.3.2. Business to Consumer
- 9.1. Market Analysis, Insights and Forecast - by Type
- 10. Rest of the World Video Managed Services Industry Analysis, Insights and Forecast, 2020-2032
- 10.1. Market Analysis, Insights and Forecast - by Type
- 10.1.1. Software
- 10.1.2. Hardware
- 10.2. Market Analysis, Insights and Forecast - by Enterprise Size
- 10.2.1. Large Enterprise
- 10.2.2. Small & Medium Enterprise
- 10.3. Market Analysis, Insights and Forecast - by Applications
- 10.3.1. Business to Business
- 10.3.2. Business to Consumer
- 10.1. Market Analysis, Insights and Forecast - by Type
- 11. Competitive Analysis
- 11.1. Company Profiles
- 11.1.1 Arkadin Cloud Communications ( NTT Communications)
- 11.1.1.1. Company Overview
- 11.1.1.2. Products
- 11.1.1.3. Company Financials
- 11.1.1.4. SWOT Analysis
- 11.1.2 Polycom Inc
- 11.1.2.1. Company Overview
- 11.1.2.2. Products
- 11.1.2.3. Company Financials
- 11.1.2.4. SWOT Analysis
- 11.1.3 BT Conferencing Inc
- 11.1.3.1. Company Overview
- 11.1.3.2. Products
- 11.1.3.3. Company Financials
- 11.1.3.4. SWOT Analysis
- 11.1.4 Cisco Systems Inc
- 11.1.4.1. Company Overview
- 11.1.4.2. Products
- 11.1.4.3. Company Financials
- 11.1.4.4. SWOT Analysis
- 11.1.5 Macro Technologies Inc
- 11.1.5.1. Company Overview
- 11.1.5.2. Products
- 11.1.5.3. Company Financials
- 11.1.5.4. SWOT Analysis
- 11.1.6 Applied Global Technologies
- 11.1.6.1. Company Overview
- 11.1.6.2. Products
- 11.1.6.3. Company Financials
- 11.1.6.4. SWOT Analysis
- 11.1.7 Dimension Data
- 11.1.7.1. Company Overview
- 11.1.7.2. Products
- 11.1.7.3. Company Financials
- 11.1.7.4. SWOT Analysis
- 11.1.8 AVI-SPL Inc
- 11.1.8.1. Company Overview
- 11.1.8.2. Products
- 11.1.8.3. Company Financials
- 11.1.8.4. SWOT Analysis
- 11.1.9 ZTE Enterprise
- 11.1.9.1. Company Overview
- 11.1.9.2. Products
- 11.1.9.3. Company Financials
- 11.1.9.4. SWOT Analysis
- 11.1.10 AT&T Business
- 11.1.10.1. Company Overview
- 11.1.10.2. Products
- 11.1.10.3. Company Financials
- 11.1.10.4. SWOT Analysis
- 11.1.11 Telus Communications
- 11.1.11.1. Company Overview
- 11.1.11.2. Products
- 11.1.11.3. Company Financials
- 11.1.11.4. SWOT Analysis
- 11.1.12 Vega Global
- 11.1.12.1. Company Overview
- 11.1.12.2. Products
- 11.1.12.3. Company Financials
- 11.1.12.4. SWOT Analysis
- 11.1.1 Arkadin Cloud Communications ( NTT Communications)
- 11.2. Market Entropy
- 11.2.1 Company's Key Areas Served
- 11.2.2 Recent Developments
- 11.3. Company Market Share Analysis 2025
- 11.3.1 Top 5 Companies Market Share Analysis
- 11.3.2 Top 3 Companies Market Share Analysis
- 11.4. List of Potential Customers
- 12. Research Methodology
List of Figures
- Figure 1: Global Video Managed Services Industry Revenue Breakdown (Million, %) by Region 2025 & 2033
- Figure 2: Global Video Managed Services Industry Volume Breakdown (K Unit, %) by Region 2025 & 2033
- Figure 3: North America Video Managed Services Industry Revenue (Million), by Type 2025 & 2033
- Figure 4: North America Video Managed Services Industry Volume (K Unit), by Type 2025 & 2033
- Figure 5: North America Video Managed Services Industry Revenue Share (%), by Type 2025 & 2033
- Figure 6: North America Video Managed Services Industry Volume Share (%), by Type 2025 & 2033
- Figure 7: North America Video Managed Services Industry Revenue (Million), by Enterprise Size 2025 & 2033
- Figure 8: North America Video Managed Services Industry Volume (K Unit), by Enterprise Size 2025 & 2033
- Figure 9: North America Video Managed Services Industry Revenue Share (%), by Enterprise Size 2025 & 2033
- Figure 10: North America Video Managed Services Industry Volume Share (%), by Enterprise Size 2025 & 2033
- Figure 11: North America Video Managed Services Industry Revenue (Million), by Applications 2025 & 2033
- Figure 12: North America Video Managed Services Industry Volume (K Unit), by Applications 2025 & 2033
- Figure 13: North America Video Managed Services Industry Revenue Share (%), by Applications 2025 & 2033
- Figure 14: North America Video Managed Services Industry Volume Share (%), by Applications 2025 & 2033
- Figure 15: North America Video Managed Services Industry Revenue (Million), by Country 2025 & 2033
- Figure 16: North America Video Managed Services Industry Volume (K Unit), by Country 2025 & 2033
- Figure 17: North America Video Managed Services Industry Revenue Share (%), by Country 2025 & 2033
- Figure 18: North America Video Managed Services Industry Volume Share (%), by Country 2025 & 2033
- Figure 19: Europe Video Managed Services Industry Revenue (Million), by Type 2025 & 2033
- Figure 20: Europe Video Managed Services Industry Volume (K Unit), by Type 2025 & 2033
- Figure 21: Europe Video Managed Services Industry Revenue Share (%), by Type 2025 & 2033
- Figure 22: Europe Video Managed Services Industry Volume Share (%), by Type 2025 & 2033
- Figure 23: Europe Video Managed Services Industry Revenue (Million), by Enterprise Size 2025 & 2033
- Figure 24: Europe Video Managed Services Industry Volume (K Unit), by Enterprise Size 2025 & 2033
- Figure 25: Europe Video Managed Services Industry Revenue Share (%), by Enterprise Size 2025 & 2033
- Figure 26: Europe Video Managed Services Industry Volume Share (%), by Enterprise Size 2025 & 2033
- Figure 27: Europe Video Managed Services Industry Revenue (Million), by Applications 2025 & 2033
- Figure 28: Europe Video Managed Services Industry Volume (K Unit), by Applications 2025 & 2033
- Figure 29: Europe Video Managed Services Industry Revenue Share (%), by Applications 2025 & 2033
- Figure 30: Europe Video Managed Services Industry Volume Share (%), by Applications 2025 & 2033
- Figure 31: Europe Video Managed Services Industry Revenue (Million), by Country 2025 & 2033
- Figure 32: Europe Video Managed Services Industry Volume (K Unit), by Country 2025 & 2033
- Figure 33: Europe Video Managed Services Industry Revenue Share (%), by Country 2025 & 2033
- Figure 34: Europe Video Managed Services Industry Volume Share (%), by Country 2025 & 2033
- Figure 35: Asia Pacific Video Managed Services Industry Revenue (Million), by Type 2025 & 2033
- Figure 36: Asia Pacific Video Managed Services Industry Volume (K Unit), by Type 2025 & 2033
- Figure 37: Asia Pacific Video Managed Services Industry Revenue Share (%), by Type 2025 & 2033
- Figure 38: Asia Pacific Video Managed Services Industry Volume Share (%), by Type 2025 & 2033
- Figure 39: Asia Pacific Video Managed Services Industry Revenue (Million), by Enterprise Size 2025 & 2033
- Figure 40: Asia Pacific Video Managed Services Industry Volume (K Unit), by Enterprise Size 2025 & 2033
- Figure 41: Asia Pacific Video Managed Services Industry Revenue Share (%), by Enterprise Size 2025 & 2033
- Figure 42: Asia Pacific Video Managed Services Industry Volume Share (%), by Enterprise Size 2025 & 2033
- Figure 43: Asia Pacific Video Managed Services Industry Revenue (Million), by Applications 2025 & 2033
- Figure 44: Asia Pacific Video Managed Services Industry Volume (K Unit), by Applications 2025 & 2033
- Figure 45: Asia Pacific Video Managed Services Industry Revenue Share (%), by Applications 2025 & 2033
- Figure 46: Asia Pacific Video Managed Services Industry Volume Share (%), by Applications 2025 & 2033
- Figure 47: Asia Pacific Video Managed Services Industry Revenue (Million), by Country 2025 & 2033
- Figure 48: Asia Pacific Video Managed Services Industry Volume (K Unit), by Country 2025 & 2033
- Figure 49: Asia Pacific Video Managed Services Industry Revenue Share (%), by Country 2025 & 2033
- Figure 50: Asia Pacific Video Managed Services Industry Volume Share (%), by Country 2025 & 2033
- Figure 51: Rest of the World Video Managed Services Industry Revenue (Million), by Type 2025 & 2033
- Figure 52: Rest of the World Video Managed Services Industry Volume (K Unit), by Type 2025 & 2033
- Figure 53: Rest of the World Video Managed Services Industry Revenue Share (%), by Type 2025 & 2033
- Figure 54: Rest of the World Video Managed Services Industry Volume Share (%), by Type 2025 & 2033
- Figure 55: Rest of the World Video Managed Services Industry Revenue (Million), by Enterprise Size 2025 & 2033
- Figure 56: Rest of the World Video Managed Services Industry Volume (K Unit), by Enterprise Size 2025 & 2033
- Figure 57: Rest of the World Video Managed Services Industry Revenue Share (%), by Enterprise Size 2025 & 2033
- Figure 58: Rest of the World Video Managed Services Industry Volume Share (%), by Enterprise Size 2025 & 2033
- Figure 59: Rest of the World Video Managed Services Industry Revenue (Million), by Applications 2025 & 2033
- Figure 60: Rest of the World Video Managed Services Industry Volume (K Unit), by Applications 2025 & 2033
- Figure 61: Rest of the World Video Managed Services Industry Revenue Share (%), by Applications 2025 & 2033
- Figure 62: Rest of the World Video Managed Services Industry Volume Share (%), by Applications 2025 & 2033
- Figure 63: Rest of the World Video Managed Services Industry Revenue (Million), by Country 2025 & 2033
- Figure 64: Rest of the World Video Managed Services Industry Volume (K Unit), by Country 2025 & 2033
- Figure 65: Rest of the World Video Managed Services Industry Revenue Share (%), by Country 2025 & 2033
- Figure 66: Rest of the World Video Managed Services Industry Volume Share (%), by Country 2025 & 2033
List of Tables
- Table 1: Global Video Managed Services Industry Revenue Million Forecast, by Type 2020 & 2033
- Table 2: Global Video Managed Services Industry Volume K Unit Forecast, by Type 2020 & 2033
- Table 3: Global Video Managed Services Industry Revenue Million Forecast, by Enterprise Size 2020 & 2033
- Table 4: Global Video Managed Services Industry Volume K Unit Forecast, by Enterprise Size 2020 & 2033
- Table 5: Global Video Managed Services Industry Revenue Million Forecast, by Applications 2020 & 2033
- Table 6: Global Video Managed Services Industry Volume K Unit Forecast, by Applications 2020 & 2033
- Table 7: Global Video Managed Services Industry Revenue Million Forecast, by Region 2020 & 2033
- Table 8: Global Video Managed Services Industry Volume K Unit Forecast, by Region 2020 & 2033
- Table 9: Global Video Managed Services Industry Revenue Million Forecast, by Type 2020 & 2033
- Table 10: Global Video Managed Services Industry Volume K Unit Forecast, by Type 2020 & 2033
- Table 11: Global Video Managed Services Industry Revenue Million Forecast, by Enterprise Size 2020 & 2033
- Table 12: Global Video Managed Services Industry Volume K Unit Forecast, by Enterprise Size 2020 & 2033
- Table 13: Global Video Managed Services Industry Revenue Million Forecast, by Applications 2020 & 2033
- Table 14: Global Video Managed Services Industry Volume K Unit Forecast, by Applications 2020 & 2033
- Table 15: Global Video Managed Services Industry Revenue Million Forecast, by Country 2020 & 2033
- Table 16: Global Video Managed Services Industry Volume K Unit Forecast, by Country 2020 & 2033
- Table 17: Global Video Managed Services Industry Revenue Million Forecast, by Type 2020 & 2033
- Table 18: Global Video Managed Services Industry Volume K Unit Forecast, by Type 2020 & 2033
- Table 19: Global Video Managed Services Industry Revenue Million Forecast, by Enterprise Size 2020 & 2033
- Table 20: Global Video Managed Services Industry Volume K Unit Forecast, by Enterprise Size 2020 & 2033
- Table 21: Global Video Managed Services Industry Revenue Million Forecast, by Applications 2020 & 2033
- Table 22: Global Video Managed Services Industry Volume K Unit Forecast, by Applications 2020 & 2033
- Table 23: Global Video Managed Services Industry Revenue Million Forecast, by Country 2020 & 2033
- Table 24: Global Video Managed Services Industry Volume K Unit Forecast, by Country 2020 & 2033
- Table 25: Global Video Managed Services Industry Revenue Million Forecast, by Type 2020 & 2033
- Table 26: Global Video Managed Services Industry Volume K Unit Forecast, by Type 2020 & 2033
- Table 27: Global Video Managed Services Industry Revenue Million Forecast, by Enterprise Size 2020 & 2033
- Table 28: Global Video Managed Services Industry Volume K Unit Forecast, by Enterprise Size 2020 & 2033
- Table 29: Global Video Managed Services Industry Revenue Million Forecast, by Applications 2020 & 2033
- Table 30: Global Video Managed Services Industry Volume K Unit Forecast, by Applications 2020 & 2033
- Table 31: Global Video Managed Services Industry Revenue Million Forecast, by Country 2020 & 2033
- Table 32: Global Video Managed Services Industry Volume K Unit Forecast, by Country 2020 & 2033
- Table 33: Global Video Managed Services Industry Revenue Million Forecast, by Type 2020 & 2033
- Table 34: Global Video Managed Services Industry Volume K Unit Forecast, by Type 2020 & 2033
- Table 35: Global Video Managed Services Industry Revenue Million Forecast, by Enterprise Size 2020 & 2033
- Table 36: Global Video Managed Services Industry Volume K Unit Forecast, by Enterprise Size 2020 & 2033
- Table 37: Global Video Managed Services Industry Revenue Million Forecast, by Applications 2020 & 2033
- Table 38: Global Video Managed Services Industry Volume K Unit Forecast, by Applications 2020 & 2033
- Table 39: Global Video Managed Services Industry Revenue Million Forecast, by Country 2020 & 2033
- Table 40: Global Video Managed Services Industry Volume K Unit Forecast, by Country 2020 & 2033
Frequently Asked Questions
1. What is the projected Compound Annual Growth Rate (CAGR) of the Video Managed Services Industry?
The projected CAGR is approximately 22.25%.
2. Which companies are prominent players in the Video Managed Services Industry?
Key companies in the market include Arkadin Cloud Communications ( NTT Communications), Polycom Inc, BT Conferencing Inc, Cisco Systems Inc, Macro Technologies Inc , Applied Global Technologies, Dimension Data, AVI-SPL Inc, ZTE Enterprise, AT&T Business, Telus Communications, Vega Global.
3. What are the main segments of the Video Managed Services Industry?
The market segments include Type, Enterprise Size, Applications.
4. Can you provide details about the market size?
The market size is estimated to be USD 15.43 Million as of 2022.
5. What are some drivers contributing to market growth?
Adoption of BYOD (Bring Your Own Device); Higher Productivity Rate by Reducing Unnecessary Hours.
6. What are the notable trends driving market growth?
Software Segment to Witness the Growth.
7. Are there any restraints impacting market growth?
High Initial Investments and Installation Costs.
8. Can you provide examples of recent developments in the market?
August 2023 - Quantum Corporation, the leader in solutions for video and unstructured data, announced a partnership with Tiger Surveillance, a leading provider of video surveillance data management and protection solutions, to deliver end-to-end solutions for long-term retention and archiving of video surveillance data.
9. What pricing options are available for accessing the report?
Pricing options include single-user, multi-user, and enterprise licenses priced at USD 4750, USD 5250, and USD 8750 respectively.
10. Is the market size provided in terms of value or volume?
The market size is provided in terms of value, measured in Million and volume, measured in K Unit.
11. Are there any specific market keywords associated with the report?
Yes, the market keyword associated with the report is "Video Managed Services Industry," which aids in identifying and referencing the specific market segment covered.
12. How do I determine which pricing option suits my needs best?
The pricing options vary based on user requirements and access needs. Individual users may opt for single-user licenses, while businesses requiring broader access may choose multi-user or enterprise licenses for cost-effective access to the report.
13. Are there any additional resources or data provided in the Video Managed Services Industry report?
While the report offers comprehensive insights, it's advisable to review the specific contents or supplementary materials provided to ascertain if additional resources or data are available.
14. How can I stay updated on further developments or reports in the Video Managed Services Industry?
To stay informed about further developments, trends, and reports in the Video Managed Services Industry, consider subscribing to industry newsletters, following relevant companies and organizations, or regularly checking reputable industry news sources and publications.
Methodology
Step 1 - Identification of Relevant Samples Size from Population Database


Step 2 - Approaches for Defining Global Market Size (Value, Volume* & Price*)

Note*: In applicable scenarios
Step 3 - Data Sources
Primary Research
- Web Analytics
- Survey Reports
- Research Institute
- Latest Research Reports
- Opinion Leaders
Secondary Research
- Annual Reports
- White Paper
- Latest Press Release
- Industry Association
- Paid Database
- Investor Presentations

Step 4 - Data Triangulation
Involves using different sources of information in order to increase the validity of a study
These sources are likely to be stakeholders in a program - participants, other researchers, program staff, other community members, and so on.
Then we put all data in single framework & apply various statistical tools to find out the dynamic on the market.
During the analysis stage, feedback from the stakeholder groups would be compared to determine areas of agreement as well as areas of divergence