

Key Insights
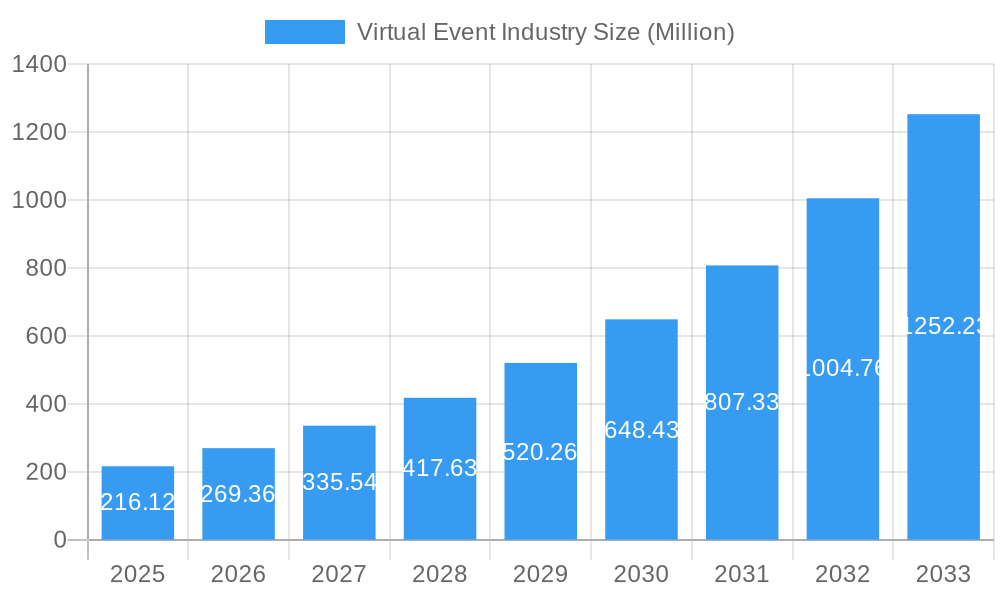
The virtual event industry is experiencing robust growth, projected to reach a market size of $216.12 million in 2025, expanding at a remarkable Compound Annual Growth Rate (CAGR) of 24.92%. This expansion is fueled by several key drivers. The increasing adoption of digital technologies across various sectors, coupled with the cost-effectiveness and wider reach of virtual events compared to traditional in-person events, are significant factors. Furthermore, the growing demand for flexible and engaging learning and training solutions, particularly in the corporate and educational sectors, is bolstering market growth. The rising popularity of hybrid event models, combining both virtual and in-person elements, further contributes to the industry's expansion. This versatility allows organizations to cater to diverse audience preferences and geographical limitations. Segmentation analysis reveals strong demand across service types, including communication, recruitment, sales & marketing, and training, as well as diverse applications such as conferences, exhibitions, summits, and other specialized virtual gatherings. Major end-user industries driving this market include educational institutions, enterprises, and various organizations. While challenges remain, including the need for robust internet infrastructure and addressing potential technical glitches, the overall market outlook for the virtual event industry remains exceptionally positive.
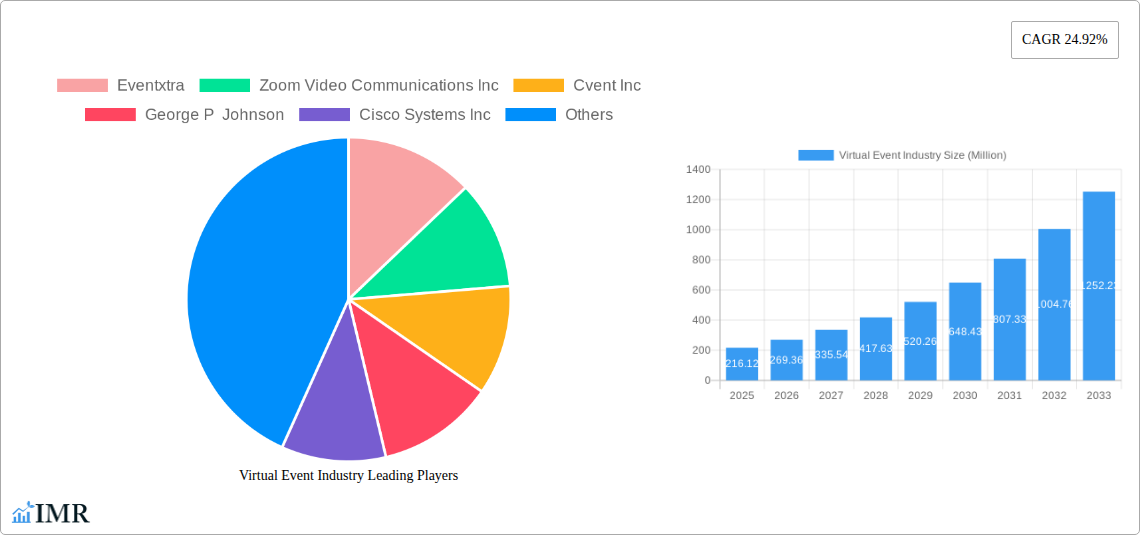
Virtual Event Industry Market Size (In Million)
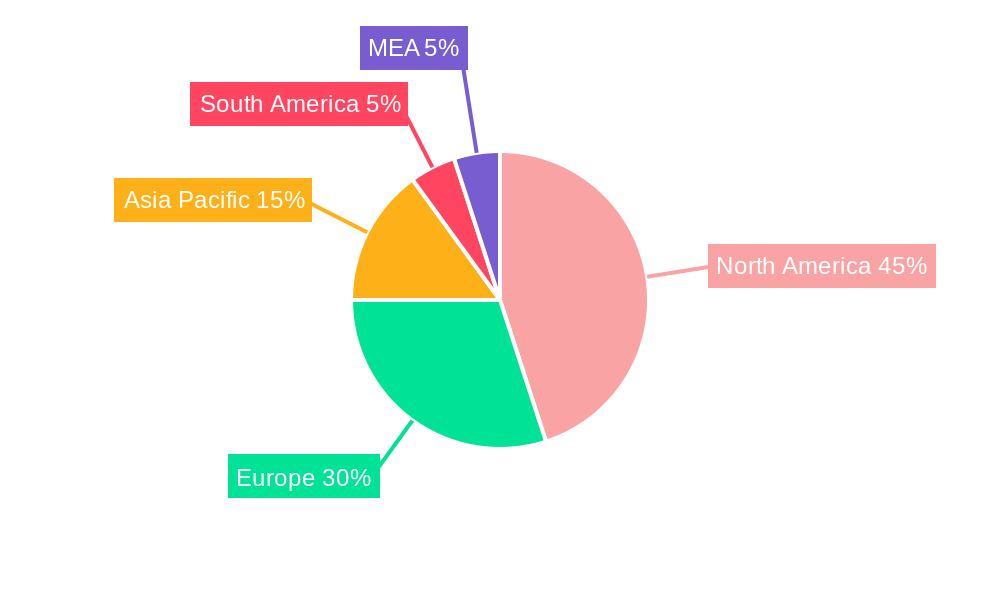
The competitive landscape is dynamic, with established players like Zoom Video Communications, Cvent, and Cisco Systems, alongside specialized virtual event platforms like Eventxtra and 6Connex, vying for market share. The geographical distribution of market share is expected to be heavily weighted towards North America and Europe initially, reflecting existing technological infrastructure and adoption rates. However, rapid growth is anticipated in the Asia-Pacific region, driven by increasing internet penetration and a burgeoning demand for efficient and accessible event solutions. South America and the MEA regions also present significant growth opportunities as digital infrastructure improves and businesses adopt virtual event strategies. The forecast period (2025-2033) suggests continued, albeit potentially moderating, growth as the market matures and technological advancements further refine the virtual event experience. Continuous innovation in areas such as interactive elements, AI-powered engagement tools, and immersive technologies will be critical for sustained market expansion.
Virtual Event Industry Company Market Share
Virtual Event Industry Market Report: 2019-2033
This comprehensive report provides a detailed analysis of the Virtual Event Industry, encompassing market dynamics, growth trends, key players, and future outlook. The study period covers 2019-2033, with 2025 as the base and estimated year. The report segments the market by service type (Communication, Recruitment, Sales & Marketing, Training), application (Conferences, Exhibitions/Trade Shows, Summits, Others), and end-user industry (Educational Institutions, Enterprise, Organizations, Other End-User Industries). Key players analyzed include Eventxtra, Zoom Video Communications Inc, Cvent Inc, George P Johnson, Cisco Systems Inc, 6Connex International sp z o o, GES, Alive Events Agency, Avaya LLC, Arkadin Cloud Communications, and ALE International. The report offers valuable insights for industry professionals, investors, and strategic decision-makers.
Virtual Event Industry Market Dynamics & Structure
The virtual event industry is experiencing rapid growth, driven by technological advancements and a shift towards digital engagement. Market concentration is moderate, with several key players dominating specific segments. Technological innovation, particularly in areas like AI-powered engagement tools and immersive experiences, is a crucial driver. Regulatory frameworks concerning data privacy and accessibility play a significant role. Competitive substitutes include traditional in-person events and other digital communication platforms. End-user demographics are expanding to encompass a wider range of industries and age groups. M&A activity is significant, with xx million in deals recorded between 2019-2024, indicating consolidation within the sector.
- Market Concentration: Moderate, with top 5 players holding approximately xx% market share in 2024.
- Technological Innovation: Focus on AI-driven personalization, VR/AR integration, and enhanced analytics.
- Regulatory Landscape: Growing emphasis on data privacy (GDPR, CCPA) and accessibility standards.
- Competitive Substitutes: Traditional events, webinars, online video conferencing tools.
- M&A Activity: xx million in deal value between 2019 and 2024, with a projected xx million for 2025-2033.
- Innovation Barriers: High initial investment costs, integration complexities, and skills gap in specialized technologies.
Virtual Event Industry Growth Trends & Insights
The global virtual event market is experiencing robust growth, with a CAGR of xx% from 2019 to 2024 and a projected CAGR of xx% during 2025-2033. The market size reached xx million in 2024 and is expected to reach xx million by 2033. This growth is fueled by increasing adoption rates across various industries, technological disruptions, and evolving consumer preferences. The market penetration rate is currently at xx% and is projected to increase to xx% by 2033. The shift towards hybrid and fully virtual events has accelerated significantly, particularly in the post-pandemic era. Consumer behavior now prioritizes convenience, cost-effectiveness, and accessibility.
Dominant Regions, Countries, or Segments in Virtual Event Industry
North America currently holds the largest market share, driven by high technological adoption and a robust enterprise sector. Within service types, the communication and training segments exhibit strong growth. Conferences and summits represent major application areas.
- Key Drivers: Strong internet infrastructure, high digital literacy, favorable regulatory environment, and significant investments in technology.
- Dominance Factors: Early adoption of virtual event technologies, high concentration of major players, and a large number of enterprises and educational institutions.
- Growth Potential: Significant opportunities in emerging markets (Asia-Pacific, Latin America) driven by increasing internet penetration and smartphone usage. The Sales & Marketing segment shows high potential due to increased demand for efficient lead generation strategies.
Virtual Event Industry Product Landscape
The virtual event industry showcases a diverse product landscape, ranging from basic video conferencing tools to sophisticated platforms incorporating AI-driven features like personalized engagement and real-time analytics. Products increasingly focus on seamless user experiences, interactive features, and advanced networking capabilities. Unique selling propositions often center around ease of use, scalability, and the ability to deliver immersive experiences. Technological advancements include the integration of virtual reality (VR), augmented reality (AR), and 3D environments.
Key Drivers, Barriers & Challenges in Virtual Event Industry
Key Drivers:
- Increasing demand for cost-effective and scalable event solutions.
- Technological advancements enabling immersive and interactive experiences.
- Growing adoption of hybrid event models.
Challenges & Restraints:
- Competition from established players and new entrants.
- Concerns about technological glitches and cybersecurity.
- Ensuring audience engagement and preventing participant drop-off.
Emerging Opportunities in Virtual Event Industry
- Growth in the metaverse and immersive virtual event experiences.
- Integration of AI and machine learning for personalized engagement and event optimization.
- Expansion into new geographic markets with emerging digital economies.
Growth Accelerators in the Virtual Event Industry
Technological innovations in VR/AR, AI-powered analytics, and improved accessibility are accelerating the market's growth. Strategic partnerships between event management companies and technology providers are creating seamless, user-friendly platforms. Expansion into untapped market segments, like niche industries and specific geographical regions, promises further growth.
Key Players Shaping the Virtual Event Industry Market
- Eventxtra
- Zoom Video Communications Inc
- Cvent Inc
- George P Johnson
- Cisco Systems Inc
- 6Connex International sp z o o
- GES
- Alive Events Agency
- Avaya LLC
- Arkadin Cloud Communications
- ALE International
Notable Milestones in Virtual Event Industry Sector
- October 2022: Zoom launches 'Zoom Events' in India, focusing on immersive virtual events and custom branding.
- May 2023: VOSMOS launches VOSMOS.Events, a platform for user-created virtual events, offering scalability for events of various sizes.
In-Depth Virtual Event Industry Market Outlook
The virtual event industry is poised for sustained growth, driven by ongoing technological advancements and a shift towards flexible and accessible event formats. Strategic partnerships, expansion into emerging markets, and the development of innovative engagement strategies will be key to unlocking the market's full potential. The focus on immersive experiences, personalized interactions, and robust data analytics will shape the future of the industry.
Virtual Event Industry Segmentation
-
1. Service Type
- 1.1. Communication
- 1.2. Recruitment
- 1.3. Sales and Marketing
- 1.4. Training
-
2. Application
- 2.1. Conferences
- 2.2. Exhibitions/Trade Shows
- 2.3. Summits
- 2.4. Other Applications
-
3. End-User Industry
- 3.1. Educational Institutions
- 3.2. Enterprise
- 3.3. Organizations
- 3.4. Other End-User Industries
Virtual Event Industry Segmentation By Geography
- 1. North America
- 2. Europe
- 3. Asia
- 4. Australia and New Zealand
- 5. Latin America
- 6. Middle East and Africa
Virtual Event Industry Regional Market Share
Geographic Coverage of Virtual Event Industry
Virtual Event Industry REPORT HIGHLIGHTS
| Aspects | Details |
|---|---|
| Study Period | 2020-2034 |
| Base Year | 2025 |
| Estimated Year | 2026 |
| Forecast Period | 2026-2034 |
| Historical Period | 2020-2025 |
| Growth Rate | CAGR of 24.92% from 2020-2034 |
| Segmentation |
|
Table of Contents
- 1. Introduction
- 1.1. Research Scope
- 1.2. Market Segmentation
- 1.3. Research Objective
- 1.4. Definitions and Assumptions
- 2. Executive Summary
- 2.1. Market Snapshot
- 3. Market Dynamics
- 3.1. Market Drivers
- 3.2. Market Restrains
- 3.3. Market Trends
- 3.4. Market Opportunities
- 4. Market Factor Analysis
- 4.1. Porters Five Forces
- 4.1.1. Bargaining Power of Suppliers
- 4.1.2. Bargaining Power of Buyers
- 4.1.3. Threat of New Entrants
- 4.1.4. Threat of Substitutes
- 4.1.5. Competitive Rivalry
- 4.2. PESTEL analysis
- 4.3. BCG Analysis
- 4.3.1. Stars (High Growth, High Market Share)
- 4.3.2. Cash Cows (Low Growth, High Market Share)
- 4.3.3. Question Mark (High Growth, Low Market Share)
- 4.3.4. Dogs (Low Growth, Low Market Share)
- 4.4. Ansoff Matrix Analysis
- 4.5. Supply Chain Analysis
- 4.6. Regulatory Landscape
- 4.7. Current Market Potential and Opportunity Assessment (TAM–SAM–SOM Framework)
- 4.8. IMR Analyst Note
- 4.1. Porters Five Forces
- 5. Market Analysis, Insights and Forecast 2021-2033
- 5.1. Market Analysis, Insights and Forecast - by Service Type
- 5.1.1. Communication
- 5.1.2. Recruitment
- 5.1.3. Sales and Marketing
- 5.1.4. Training
- 5.2. Market Analysis, Insights and Forecast - by Application
- 5.2.1. Conferences
- 5.2.2. Exhibitions/Trade Shows
- 5.2.3. Summits
- 5.2.4. Other Applications
- 5.3. Market Analysis, Insights and Forecast - by End-User Industry
- 5.3.1. Educational Institutions
- 5.3.2. Enterprise
- 5.3.3. Organizations
- 5.3.4. Other End-User Industries
- 5.4. Market Analysis, Insights and Forecast - by Region
- 5.4.1. North America
- 5.4.2. Europe
- 5.4.3. Asia
- 5.4.4. Australia and New Zealand
- 5.4.5. Latin America
- 5.4.6. Middle East and Africa
- 5.1. Market Analysis, Insights and Forecast - by Service Type
- 6. Global Virtual Event Industry Analysis, Insights and Forecast, 2021-2033
- 6.1. Market Analysis, Insights and Forecast - by Service Type
- 6.1.1. Communication
- 6.1.2. Recruitment
- 6.1.3. Sales and Marketing
- 6.1.4. Training
- 6.2. Market Analysis, Insights and Forecast - by Application
- 6.2.1. Conferences
- 6.2.2. Exhibitions/Trade Shows
- 6.2.3. Summits
- 6.2.4. Other Applications
- 6.3. Market Analysis, Insights and Forecast - by End-User Industry
- 6.3.1. Educational Institutions
- 6.3.2. Enterprise
- 6.3.3. Organizations
- 6.3.4. Other End-User Industries
- 6.1. Market Analysis, Insights and Forecast - by Service Type
- 7. North America Virtual Event Industry Analysis, Insights and Forecast, 2020-2032
- 7.1. Market Analysis, Insights and Forecast - by Service Type
- 7.1.1. Communication
- 7.1.2. Recruitment
- 7.1.3. Sales and Marketing
- 7.1.4. Training
- 7.2. Market Analysis, Insights and Forecast - by Application
- 7.2.1. Conferences
- 7.2.2. Exhibitions/Trade Shows
- 7.2.3. Summits
- 7.2.4. Other Applications
- 7.3. Market Analysis, Insights and Forecast - by End-User Industry
- 7.3.1. Educational Institutions
- 7.3.2. Enterprise
- 7.3.3. Organizations
- 7.3.4. Other End-User Industries
- 7.1. Market Analysis, Insights and Forecast - by Service Type
- 8. Europe Virtual Event Industry Analysis, Insights and Forecast, 2020-2032
- 8.1. Market Analysis, Insights and Forecast - by Service Type
- 8.1.1. Communication
- 8.1.2. Recruitment
- 8.1.3. Sales and Marketing
- 8.1.4. Training
- 8.2. Market Analysis, Insights and Forecast - by Application
- 8.2.1. Conferences
- 8.2.2. Exhibitions/Trade Shows
- 8.2.3. Summits
- 8.2.4. Other Applications
- 8.3. Market Analysis, Insights and Forecast - by End-User Industry
- 8.3.1. Educational Institutions
- 8.3.2. Enterprise
- 8.3.3. Organizations
- 8.3.4. Other End-User Industries
- 8.1. Market Analysis, Insights and Forecast - by Service Type
- 9. Asia Virtual Event Industry Analysis, Insights and Forecast, 2020-2032
- 9.1. Market Analysis, Insights and Forecast - by Service Type
- 9.1.1. Communication
- 9.1.2. Recruitment
- 9.1.3. Sales and Marketing
- 9.1.4. Training
- 9.2. Market Analysis, Insights and Forecast - by Application
- 9.2.1. Conferences
- 9.2.2. Exhibitions/Trade Shows
- 9.2.3. Summits
- 9.2.4. Other Applications
- 9.3. Market Analysis, Insights and Forecast - by End-User Industry
- 9.3.1. Educational Institutions
- 9.3.2. Enterprise
- 9.3.3. Organizations
- 9.3.4. Other End-User Industries
- 9.1. Market Analysis, Insights and Forecast - by Service Type
- 10. Australia and New Zealand Virtual Event Industry Analysis, Insights and Forecast, 2020-2032
- 10.1. Market Analysis, Insights and Forecast - by Service Type
- 10.1.1. Communication
- 10.1.2. Recruitment
- 10.1.3. Sales and Marketing
- 10.1.4. Training
- 10.2. Market Analysis, Insights and Forecast - by Application
- 10.2.1. Conferences
- 10.2.2. Exhibitions/Trade Shows
- 10.2.3. Summits
- 10.2.4. Other Applications
- 10.3. Market Analysis, Insights and Forecast - by End-User Industry
- 10.3.1. Educational Institutions
- 10.3.2. Enterprise
- 10.3.3. Organizations
- 10.3.4. Other End-User Industries
- 10.1. Market Analysis, Insights and Forecast - by Service Type
- 11. Latin America Virtual Event Industry Analysis, Insights and Forecast, 2020-2032
- 11.1. Market Analysis, Insights and Forecast - by Service Type
- 11.1.1. Communication
- 11.1.2. Recruitment
- 11.1.3. Sales and Marketing
- 11.1.4. Training
- 11.2. Market Analysis, Insights and Forecast - by Application
- 11.2.1. Conferences
- 11.2.2. Exhibitions/Trade Shows
- 11.2.3. Summits
- 11.2.4. Other Applications
- 11.3. Market Analysis, Insights and Forecast - by End-User Industry
- 11.3.1. Educational Institutions
- 11.3.2. Enterprise
- 11.3.3. Organizations
- 11.3.4. Other End-User Industries
- 11.1. Market Analysis, Insights and Forecast - by Service Type
- 12. Middle East and Africa Virtual Event Industry Analysis, Insights and Forecast, 2020-2032
- 12.1. Market Analysis, Insights and Forecast - by Service Type
- 12.1.1. Communication
- 12.1.2. Recruitment
- 12.1.3. Sales and Marketing
- 12.1.4. Training
- 12.2. Market Analysis, Insights and Forecast - by Application
- 12.2.1. Conferences
- 12.2.2. Exhibitions/Trade Shows
- 12.2.3. Summits
- 12.2.4. Other Applications
- 12.3. Market Analysis, Insights and Forecast - by End-User Industry
- 12.3.1. Educational Institutions
- 12.3.2. Enterprise
- 12.3.3. Organizations
- 12.3.4. Other End-User Industries
- 12.1. Market Analysis, Insights and Forecast - by Service Type
- 13. Competitive Analysis
- 13.1. Company Profiles
- 13.1.1 Eventxtra
- 13.1.1.1. Company Overview
- 13.1.1.2. Products
- 13.1.1.3. Company Financials
- 13.1.1.4. SWOT Analysis
- 13.1.2 Zoom Video Communications Inc
- 13.1.2.1. Company Overview
- 13.1.2.2. Products
- 13.1.2.3. Company Financials
- 13.1.2.4. SWOT Analysis
- 13.1.3 Cvent Inc
- 13.1.3.1. Company Overview
- 13.1.3.2. Products
- 13.1.3.3. Company Financials
- 13.1.3.4. SWOT Analysis
- 13.1.4 George P Johnson
- 13.1.4.1. Company Overview
- 13.1.4.2. Products
- 13.1.4.3. Company Financials
- 13.1.4.4. SWOT Analysis
- 13.1.5 Cisco Systems Inc
- 13.1.5.1. Company Overview
- 13.1.5.2. Products
- 13.1.5.3. Company Financials
- 13.1.5.4. SWOT Analysis
- 13.1.6 6Connex International sp z o o
- 13.1.6.1. Company Overview
- 13.1.6.2. Products
- 13.1.6.3. Company Financials
- 13.1.6.4. SWOT Analysis
- 13.1.7 GES*List Not Exhaustive
- 13.1.7.1. Company Overview
- 13.1.7.2. Products
- 13.1.7.3. Company Financials
- 13.1.7.4. SWOT Analysis
- 13.1.8 Alive Events Agency
- 13.1.8.1. Company Overview
- 13.1.8.2. Products
- 13.1.8.3. Company Financials
- 13.1.8.4. SWOT Analysis
- 13.1.9 Avaya LLC
- 13.1.9.1. Company Overview
- 13.1.9.2. Products
- 13.1.9.3. Company Financials
- 13.1.9.4. SWOT Analysis
- 13.1.10 Arkadin Cloud Communications
- 13.1.10.1. Company Overview
- 13.1.10.2. Products
- 13.1.10.3. Company Financials
- 13.1.10.4. SWOT Analysis
- 13.1.11 ALE International
- 13.1.11.1. Company Overview
- 13.1.11.2. Products
- 13.1.11.3. Company Financials
- 13.1.11.4. SWOT Analysis
- 13.1.1 Eventxtra
- 13.2. Market Entropy
- 13.2.1 Company's Key Areas Served
- 13.2.2 Recent Developments
- 13.3. Company Market Share Analysis 2025
- 13.3.1 Top 5 Companies Market Share Analysis
- 13.3.2 Top 3 Companies Market Share Analysis
- 13.4. List of Potential Customers
- 14. Research Methodology
List of Figures
- Figure 1: Global Virtual Event Industry Revenue Breakdown (Million, %) by Region 2025 & 2033
- Figure 2: North America Virtual Event Industry Revenue (Million), by Service Type 2025 & 2033
- Figure 3: North America Virtual Event Industry Revenue Share (%), by Service Type 2025 & 2033
- Figure 4: North America Virtual Event Industry Revenue (Million), by Application 2025 & 2033
- Figure 5: North America Virtual Event Industry Revenue Share (%), by Application 2025 & 2033
- Figure 6: North America Virtual Event Industry Revenue (Million), by End-User Industry 2025 & 2033
- Figure 7: North America Virtual Event Industry Revenue Share (%), by End-User Industry 2025 & 2033
- Figure 8: North America Virtual Event Industry Revenue (Million), by Country 2025 & 2033
- Figure 9: North America Virtual Event Industry Revenue Share (%), by Country 2025 & 2033
- Figure 10: Europe Virtual Event Industry Revenue (Million), by Service Type 2025 & 2033
- Figure 11: Europe Virtual Event Industry Revenue Share (%), by Service Type 2025 & 2033
- Figure 12: Europe Virtual Event Industry Revenue (Million), by Application 2025 & 2033
- Figure 13: Europe Virtual Event Industry Revenue Share (%), by Application 2025 & 2033
- Figure 14: Europe Virtual Event Industry Revenue (Million), by End-User Industry 2025 & 2033
- Figure 15: Europe Virtual Event Industry Revenue Share (%), by End-User Industry 2025 & 2033
- Figure 16: Europe Virtual Event Industry Revenue (Million), by Country 2025 & 2033
- Figure 17: Europe Virtual Event Industry Revenue Share (%), by Country 2025 & 2033
- Figure 18: Asia Virtual Event Industry Revenue (Million), by Service Type 2025 & 2033
- Figure 19: Asia Virtual Event Industry Revenue Share (%), by Service Type 2025 & 2033
- Figure 20: Asia Virtual Event Industry Revenue (Million), by Application 2025 & 2033
- Figure 21: Asia Virtual Event Industry Revenue Share (%), by Application 2025 & 2033
- Figure 22: Asia Virtual Event Industry Revenue (Million), by End-User Industry 2025 & 2033
- Figure 23: Asia Virtual Event Industry Revenue Share (%), by End-User Industry 2025 & 2033
- Figure 24: Asia Virtual Event Industry Revenue (Million), by Country 2025 & 2033
- Figure 25: Asia Virtual Event Industry Revenue Share (%), by Country 2025 & 2033
- Figure 26: Australia and New Zealand Virtual Event Industry Revenue (Million), by Service Type 2025 & 2033
- Figure 27: Australia and New Zealand Virtual Event Industry Revenue Share (%), by Service Type 2025 & 2033
- Figure 28: Australia and New Zealand Virtual Event Industry Revenue (Million), by Application 2025 & 2033
- Figure 29: Australia and New Zealand Virtual Event Industry Revenue Share (%), by Application 2025 & 2033
- Figure 30: Australia and New Zealand Virtual Event Industry Revenue (Million), by End-User Industry 2025 & 2033
- Figure 31: Australia and New Zealand Virtual Event Industry Revenue Share (%), by End-User Industry 2025 & 2033
- Figure 32: Australia and New Zealand Virtual Event Industry Revenue (Million), by Country 2025 & 2033
- Figure 33: Australia and New Zealand Virtual Event Industry Revenue Share (%), by Country 2025 & 2033
- Figure 34: Latin America Virtual Event Industry Revenue (Million), by Service Type 2025 & 2033
- Figure 35: Latin America Virtual Event Industry Revenue Share (%), by Service Type 2025 & 2033
- Figure 36: Latin America Virtual Event Industry Revenue (Million), by Application 2025 & 2033
- Figure 37: Latin America Virtual Event Industry Revenue Share (%), by Application 2025 & 2033
- Figure 38: Latin America Virtual Event Industry Revenue (Million), by End-User Industry 2025 & 2033
- Figure 39: Latin America Virtual Event Industry Revenue Share (%), by End-User Industry 2025 & 2033
- Figure 40: Latin America Virtual Event Industry Revenue (Million), by Country 2025 & 2033
- Figure 41: Latin America Virtual Event Industry Revenue Share (%), by Country 2025 & 2033
- Figure 42: Middle East and Africa Virtual Event Industry Revenue (Million), by Service Type 2025 & 2033
- Figure 43: Middle East and Africa Virtual Event Industry Revenue Share (%), by Service Type 2025 & 2033
- Figure 44: Middle East and Africa Virtual Event Industry Revenue (Million), by Application 2025 & 2033
- Figure 45: Middle East and Africa Virtual Event Industry Revenue Share (%), by Application 2025 & 2033
- Figure 46: Middle East and Africa Virtual Event Industry Revenue (Million), by End-User Industry 2025 & 2033
- Figure 47: Middle East and Africa Virtual Event Industry Revenue Share (%), by End-User Industry 2025 & 2033
- Figure 48: Middle East and Africa Virtual Event Industry Revenue (Million), by Country 2025 & 2033
- Figure 49: Middle East and Africa Virtual Event Industry Revenue Share (%), by Country 2025 & 2033
List of Tables
- Table 1: Global Virtual Event Industry Revenue Million Forecast, by Service Type 2020 & 2033
- Table 2: Global Virtual Event Industry Revenue Million Forecast, by Application 2020 & 2033
- Table 3: Global Virtual Event Industry Revenue Million Forecast, by End-User Industry 2020 & 2033
- Table 4: Global Virtual Event Industry Revenue Million Forecast, by Region 2020 & 2033
- Table 5: Global Virtual Event Industry Revenue Million Forecast, by Service Type 2020 & 2033
- Table 6: Global Virtual Event Industry Revenue Million Forecast, by Application 2020 & 2033
- Table 7: Global Virtual Event Industry Revenue Million Forecast, by End-User Industry 2020 & 2033
- Table 8: Global Virtual Event Industry Revenue Million Forecast, by Country 2020 & 2033
- Table 9: Global Virtual Event Industry Revenue Million Forecast, by Service Type 2020 & 2033
- Table 10: Global Virtual Event Industry Revenue Million Forecast, by Application 2020 & 2033
- Table 11: Global Virtual Event Industry Revenue Million Forecast, by End-User Industry 2020 & 2033
- Table 12: Global Virtual Event Industry Revenue Million Forecast, by Country 2020 & 2033
- Table 13: Global Virtual Event Industry Revenue Million Forecast, by Service Type 2020 & 2033
- Table 14: Global Virtual Event Industry Revenue Million Forecast, by Application 2020 & 2033
- Table 15: Global Virtual Event Industry Revenue Million Forecast, by End-User Industry 2020 & 2033
- Table 16: Global Virtual Event Industry Revenue Million Forecast, by Country 2020 & 2033
- Table 17: Global Virtual Event Industry Revenue Million Forecast, by Service Type 2020 & 2033
- Table 18: Global Virtual Event Industry Revenue Million Forecast, by Application 2020 & 2033
- Table 19: Global Virtual Event Industry Revenue Million Forecast, by End-User Industry 2020 & 2033
- Table 20: Global Virtual Event Industry Revenue Million Forecast, by Country 2020 & 2033
- Table 21: Global Virtual Event Industry Revenue Million Forecast, by Service Type 2020 & 2033
- Table 22: Global Virtual Event Industry Revenue Million Forecast, by Application 2020 & 2033
- Table 23: Global Virtual Event Industry Revenue Million Forecast, by End-User Industry 2020 & 2033
- Table 24: Global Virtual Event Industry Revenue Million Forecast, by Country 2020 & 2033
- Table 25: Global Virtual Event Industry Revenue Million Forecast, by Service Type 2020 & 2033
- Table 26: Global Virtual Event Industry Revenue Million Forecast, by Application 2020 & 2033
- Table 27: Global Virtual Event Industry Revenue Million Forecast, by End-User Industry 2020 & 2033
- Table 28: Global Virtual Event Industry Revenue Million Forecast, by Country 2020 & 2033
Frequently Asked Questions
1. What is the projected Compound Annual Growth Rate (CAGR) of the Virtual Event Industry?
The projected CAGR is approximately 24.92%.
2. Which companies are prominent players in the Virtual Event Industry?
Key companies in the market include Eventxtra, Zoom Video Communications Inc, Cvent Inc, George P Johnson, Cisco Systems Inc, 6Connex International sp z o o, GES*List Not Exhaustive, Alive Events Agency, Avaya LLC, Arkadin Cloud Communications, ALE International.
3. What are the main segments of the Virtual Event Industry?
The market segments include Service Type, Application, End-User Industry.
4. Can you provide details about the market size?
The market size is estimated to be USD 216.12 Million as of 2022.
5. What are some drivers contributing to market growth?
Technology Advancements such as Growing Acceptance of Unified Communication as a Service (UCAAS). VR. etc.; Increased Frequency of Business Events; Global Reach. Accessibility. and Cost Efficiency.
6. What are the notable trends driving market growth?
Increased Frequency of Business Events may Drive the Market Growth.
7. Are there any restraints impacting market growth?
Data Security and Privacy Issues; Technology Constraints and Experiential Limitations.
8. Can you provide examples of recent developments in the market?
May 2023: Tech startup VOSMOS, which focuses on the metaverse and virtual experiences, has introduced VOSMOS. Events, a platform for user-created virtual events Individuals and organizations may organize dynamic, secure virtual events of any size with the help of VOSMOS.Events. The offering, created by the Indian company VOSMOS, provides a subscription-based business model and allows customers to conduct virtual events with anywhere between 100 and more than 1 lakh participants.
9. What pricing options are available for accessing the report?
Pricing options include single-user, multi-user, and enterprise licenses priced at USD 4750, USD 5250, and USD 8750 respectively.
10. Is the market size provided in terms of value or volume?
The market size is provided in terms of value, measured in Million.
11. Are there any specific market keywords associated with the report?
Yes, the market keyword associated with the report is "Virtual Event Industry," which aids in identifying and referencing the specific market segment covered.
12. How do I determine which pricing option suits my needs best?
The pricing options vary based on user requirements and access needs. Individual users may opt for single-user licenses, while businesses requiring broader access may choose multi-user or enterprise licenses for cost-effective access to the report.
13. Are there any additional resources or data provided in the Virtual Event Industry report?
While the report offers comprehensive insights, it's advisable to review the specific contents or supplementary materials provided to ascertain if additional resources or data are available.
14. How can I stay updated on further developments or reports in the Virtual Event Industry?
To stay informed about further developments, trends, and reports in the Virtual Event Industry, consider subscribing to industry newsletters, following relevant companies and organizations, or regularly checking reputable industry news sources and publications.
Methodology
Step 1 - Identification of Relevant Samples Size from Population Database


Step 2 - Approaches for Defining Global Market Size (Value, Volume* & Price*)

Note*: In applicable scenarios
Step 3 - Data Sources
Primary Research
- Web Analytics
- Survey Reports
- Research Institute
- Latest Research Reports
- Opinion Leaders
Secondary Research
- Annual Reports
- White Paper
- Latest Press Release
- Industry Association
- Paid Database
- Investor Presentations

Step 4 - Data Triangulation
Involves using different sources of information in order to increase the validity of a study
These sources are likely to be stakeholders in a program - participants, other researchers, program staff, other community members, and so on.
Then we put all data in single framework & apply various statistical tools to find out the dynamic on the market.
During the analysis stage, feedback from the stakeholder groups would be compared to determine areas of agreement as well as areas of divergence