

Key Insights
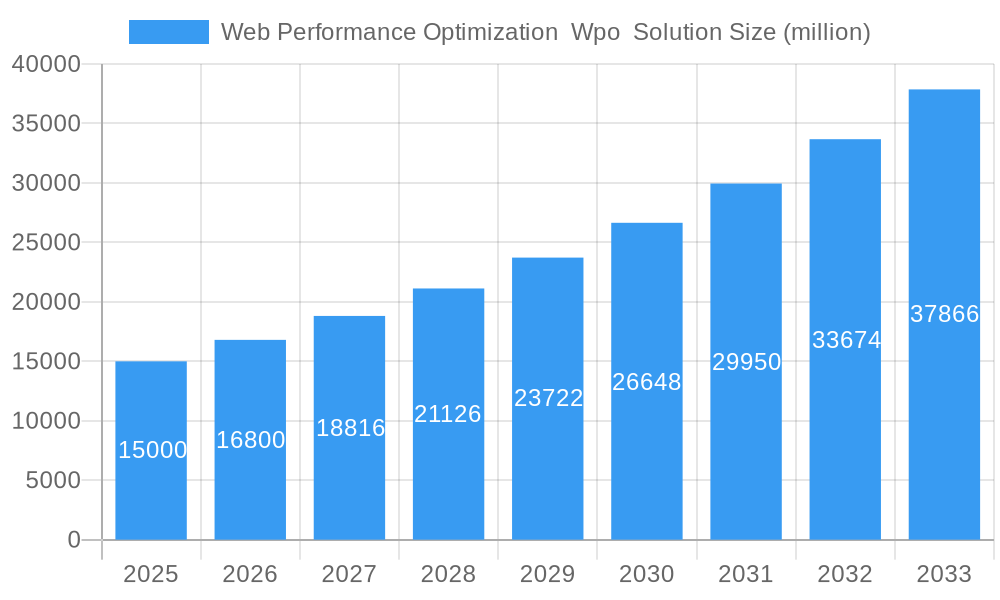
The Web Performance Optimization (WPO) solution market is experiencing robust growth, driven by the increasing reliance on digital experiences and the escalating demand for faster, more reliable online services. The market, estimated at $15 billion in 2025, is projected to witness a Compound Annual Growth Rate (CAGR) of 12% from 2025 to 2033, reaching approximately $45 billion by 2033. This expansion is fueled by several key factors, including the proliferation of mobile devices, the rising adoption of cloud-based applications, and the growing need for improved user experience to enhance customer satisfaction and conversion rates. Businesses across various sectors, from e-commerce and finance to media and entertainment, are prioritizing WPO to reduce bounce rates, improve search engine rankings, and gain a competitive advantage in today's fast-paced digital landscape. The market is segmented by solution type (e.g., content delivery networks, website optimization tools, performance monitoring), deployment model (cloud, on-premise), and industry vertical. Key players like IBM, Akamai, Cloudflare, and Dynatrace are constantly innovating and expanding their offerings to cater to the evolving needs of this dynamic market.
Web Performance Optimization Wpo Solution Market Size (In Billion)
The competitive landscape is characterized by both established players and emerging startups, leading to ongoing innovation and a diverse range of solutions. The adoption of advanced technologies such as artificial intelligence (AI) and machine learning (ML) for performance optimization is gaining traction. Furthermore, increasing focus on security and compliance requirements in the digital space is driving demand for robust and secure WPO solutions. Geographic expansion and strategic partnerships are prominent strategies employed by companies to enhance their market presence. Restraints include the complexity of implementation, the need for skilled professionals, and potential high initial investment costs for some solutions. However, the long-term benefits of improved performance and enhanced customer experience outweigh these challenges, ensuring the continued growth of the WPO market.
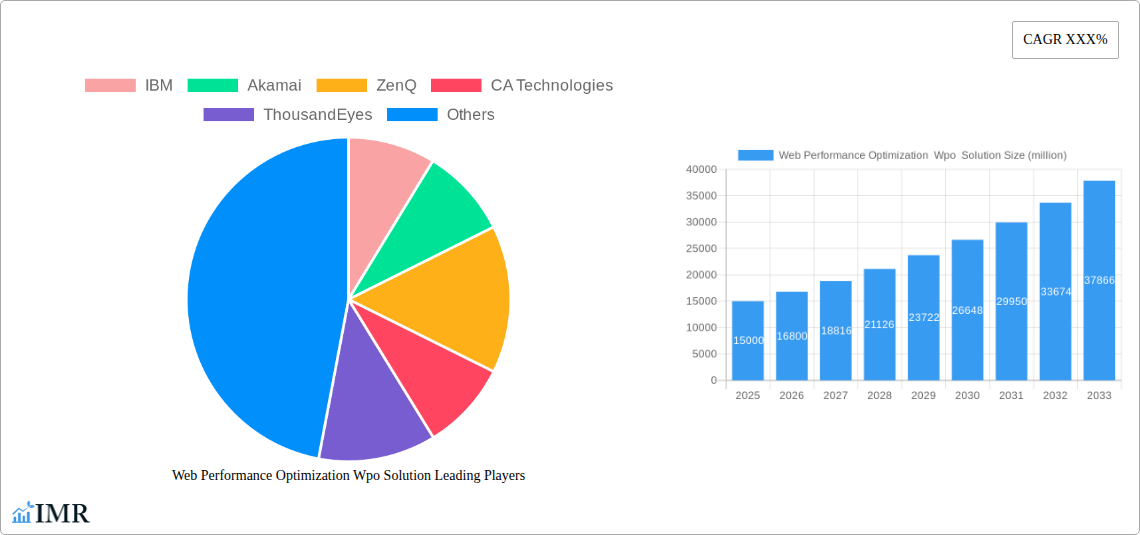
Web Performance Optimization Wpo Solution Company Market Share
Web Performance Optimization (WPO) Solution Market Report: 2019-2033
This comprehensive report provides an in-depth analysis of the Web Performance Optimization (WPO) solution market, encompassing market dynamics, growth trends, regional analysis, competitive landscape, and future outlook. The study period covers 2019-2033, with 2025 as the base and estimated year. The forecast period is 2025-2033, and the historical period is 2019-2024. The report caters to industry professionals, investors, and businesses seeking to understand and capitalize on the growth opportunities within this dynamic market segment. The total market size is projected to reach $XX billion by 2033.
Web Performance Optimization WPO Solution Market Dynamics & Structure
The Web Performance Optimization (WPO) solution market is characterized by a moderately concentrated landscape with several major players vying for market share. Technological innovation, particularly in areas like AI-powered optimization and serverless architectures, is a key driver. Regulatory frameworks concerning data privacy and security significantly impact WPO solution adoption. Competitive product substitutes, such as content delivery networks (CDNs) with integrated WPO features, exert pressure on standalone WPO vendors. The end-user demographics are diverse, encompassing enterprises across various industries and sizes, with a growing emphasis on smaller businesses seeking cost-effective solutions. M&A activity has been moderate in recent years, with larger players strategically acquiring smaller companies to expand their product portfolios and capabilities. The market is projected to experience a CAGR of XX% during the forecast period.
- Market Concentration: The top 5 players hold approximately XX% of the market share in 2025.
- Technological Innovation: AI-powered optimization, serverless computing, and edge computing are key innovation drivers.
- Regulatory Framework: GDPR, CCPA, and other data privacy regulations influence WPO solution development and deployment.
- Competitive Substitutes: CDNs increasingly incorporate WPO features, creating competition for standalone solutions.
- M&A Activity: An estimated XX M&A deals occurred between 2019 and 2024, with an average deal value of $XX million.
- Innovation Barriers: High initial investment costs and the need for specialized expertise can hinder innovation and adoption.
Web Performance Optimization WPO Solution Growth Trends & Insights
The WPO solution market has experienced substantial growth over the past few years, driven by the increasing demand for faster and more reliable web experiences. The market size expanded from $XX billion in 2019 to an estimated $XX billion in 2025. This growth is fueled by the rising adoption of mobile devices, the growing importance of user experience (UX), and the increasing reliance on cloud-based applications. Technological disruptions, such as the rise of 5G and edge computing, are further accelerating market expansion. Consumer behavior shifts, including increased expectations for instant loading times and seamless online experiences, are also significantly impacting the market. The market is expected to maintain a robust CAGR of XX% from 2025 to 2033, driven by continued technological advancements and increasing digital transformation across industries. Market penetration is currently at approximately XX% in developed economies and is expected to grow significantly in developing markets.
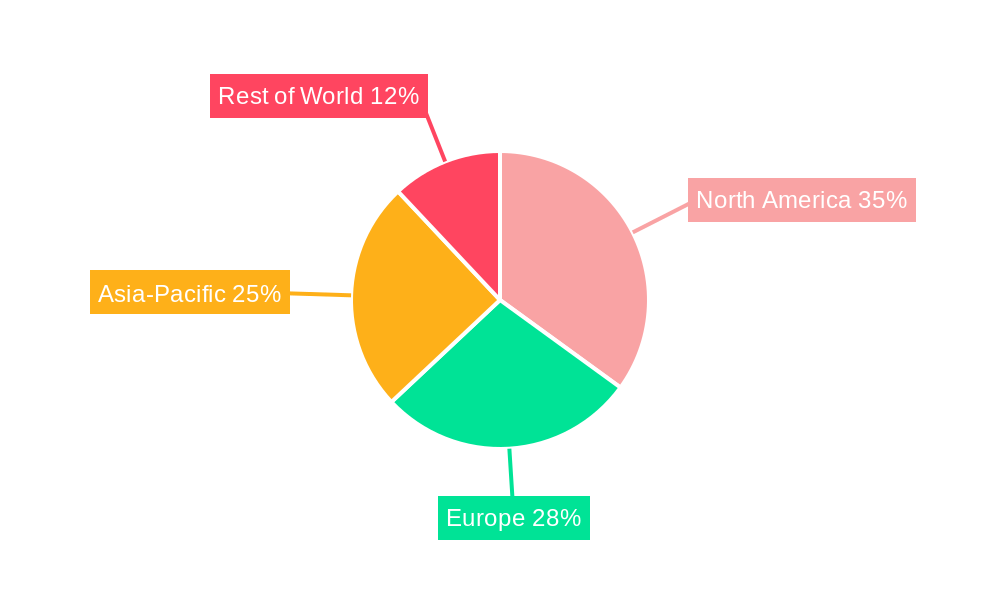
Dominant Regions, Countries, or Segments in Web Performance Optimization WPO Solution
North America currently dominates the WPO solution market, driven by high technological adoption rates, strong digital infrastructure, and the presence of major technology companies. Europe follows closely, with significant growth anticipated in the coming years. Asia-Pacific presents a high-growth potential, driven by the rapid expansion of internet usage and the increasing adoption of e-commerce. The enterprise segment currently accounts for the largest market share, followed by the small and medium-sized business (SMB) segment.
- North America: Strong digital infrastructure, high technology adoption, and presence of major players.
- Europe: Growing adoption of cloud-based services and increasing focus on digital transformation.
- Asia-Pacific: Rapid internet penetration, increasing e-commerce adoption, and cost-effective solutions driving market growth.
- Enterprise Segment: High demand for advanced WPO solutions to optimize complex web applications.
- SMB Segment: Growing adoption of affordable and user-friendly WPO tools.
Web Performance Optimization WPO Solution Product Landscape
The WPO solution market offers a diverse range of products, including website performance monitoring tools, content delivery networks (CDNs), caching solutions, image optimization tools, and code minification tools. These solutions leverage various technologies, such as AI, machine learning, and serverless computing, to optimize website performance. Unique selling propositions include ease of use, integration with other tools, advanced analytics, and customizable features. Recent technological advancements include the incorporation of artificial intelligence for automated optimization and the use of edge computing to deliver content faster.
Key Drivers, Barriers & Challenges in Web Performance Optimization Wpo Solution
Key Drivers: The increasing demand for improved user experience, the rising adoption of mobile devices, and the growing importance of search engine optimization (SEO) are primary drivers of market growth. Furthermore, the proliferation of cloud-based applications and the emergence of new technologies, such as 5G and edge computing, are creating opportunities for WPO solutions.
Challenges: High implementation costs, lack of skilled professionals, integration complexities with existing systems, and security concerns pose significant challenges. Competitive pressure from established players and the emergence of new competitors also impact the market. Supply chain disruptions can lead to delays in product delivery and increased costs, affecting profitability. Regulatory hurdles related to data privacy and security can impose constraints on solution development and deployment.
Emerging Opportunities in Web Performance Optimization Wpo Solution
Emerging opportunities lie in the untapped potential of the small and medium-sized business (SMB) segment, which is increasingly adopting cloud-based solutions. Innovative applications, such as AI-powered performance testing and personalized website optimization, are expected to drive growth. The increasing focus on the Internet of Things (IoT) and the development of new technologies, such as WebAssembly, present further growth opportunities.
Growth Accelerators in the Web Performance Optimization Wpo Solution Industry
Technological breakthroughs, such as AI-powered optimization and serverless computing, are accelerating market growth. Strategic partnerships between WPO solution providers and other technology companies are enhancing market reach and expanding product capabilities. Market expansion strategies, including geographic expansion and the development of new product offerings, are further driving market growth.
Key Players Shaping the Web Performance Optimization Wpo Solution Market
- IBM
- Akamai
- ZenQ
- CA Technologies
- ThousandEyes
- Cavisson
- New Relic
- CDNetworks
- Neustar
- Cloudflare
- Netmagic
- F5 Networks
- Dynatrace
- Micro Focus
Notable Milestones in Web Performance Optimization Wpo Solution Sector
- 2020: Cloudflare launches its Workers platform, enabling serverless functions for improved web performance.
- 2021: Akamai acquires Linode, expanding its cloud infrastructure and WPO capabilities.
- 2022: Several major players release AI-powered website optimization tools.
- 2023: Increased focus on edge computing solutions for enhanced WPO capabilities.
- 2024: New regulations on data privacy further impact WPO solution development.
In-Depth Web Performance Optimization Wpo Solution Market Outlook
The WPO solution market is poised for continued growth, driven by the increasing demand for high-performance websites and applications. Technological advancements and strategic partnerships will play a vital role in shaping the market's future. New opportunities exist in emerging markets and in the development of innovative WPO solutions, particularly those leveraging AI and machine learning. The market presents attractive investment prospects for companies that can effectively address the evolving needs of businesses seeking improved web performance and seamless digital experiences.
Web Performance Optimization Wpo Solution Segmentation
-
1. Application
- 1.1. BFSI
- 1.2. IT and Telecom
- 1.3. Retail
- 1.4. Automotive
- 1.5. Government
- 1.6. Healthcare
-
2. Type
- 2.1. On-premises
- 2.2. Cloud-based
Web Performance Optimization Wpo Solution Segmentation By Geography
-
1. North America
- 1.1. United States
- 1.2. Canada
- 1.3. Mexico
-
2. South America
- 2.1. Brazil
- 2.2. Argentina
- 2.3. Rest of South America
-
3. Europe
- 3.1. United Kingdom
- 3.2. Germany
- 3.3. France
- 3.4. Italy
- 3.5. Spain
- 3.6. Russia
- 3.7. Benelux
- 3.8. Nordics
- 3.9. Rest of Europe
-
4. Middle East & Africa
- 4.1. Turkey
- 4.2. Israel
- 4.3. GCC
- 4.4. North Africa
- 4.5. South Africa
- 4.6. Rest of Middle East & Africa
-
5. Asia Pacific
- 5.1. China
- 5.2. India
- 5.3. Japan
- 5.4. South Korea
- 5.5. ASEAN
- 5.6. Oceania
- 5.7. Rest of Asia Pacific
Web Performance Optimization Wpo Solution Regional Market Share
Geographic Coverage of Web Performance Optimization Wpo Solution
Web Performance Optimization Wpo Solution REPORT HIGHLIGHTS
| Aspects | Details |
|---|---|
| Study Period | 2020-2034 |
| Base Year | 2025 |
| Estimated Year | 2026 |
| Forecast Period | 2026-2034 |
| Historical Period | 2020-2025 |
| Growth Rate | CAGR of 10.31% from 2020-2034 |
| Segmentation |
|
Table of Contents
- 1. Introduction
- 1.1. Research Scope
- 1.2. Market Segmentation
- 1.3. Research Objective
- 1.4. Definitions and Assumptions
- 2. Executive Summary
- 2.1. Market Snapshot
- 3. Market Dynamics
- 3.1. Market Drivers
- 3.2. Market Restrains
- 3.3. Market Trends
- 3.4. Market Opportunities
- 4. Market Factor Analysis
- 4.1. Porters Five Forces
- 4.1.1. Bargaining Power of Suppliers
- 4.1.2. Bargaining Power of Buyers
- 4.1.3. Threat of New Entrants
- 4.1.4. Threat of Substitutes
- 4.1.5. Competitive Rivalry
- 4.2. PESTEL analysis
- 4.3. BCG Analysis
- 4.3.1. Stars (High Growth, High Market Share)
- 4.3.2. Cash Cows (Low Growth, High Market Share)
- 4.3.3. Question Mark (High Growth, Low Market Share)
- 4.3.4. Dogs (Low Growth, Low Market Share)
- 4.4. Ansoff Matrix Analysis
- 4.5. Supply Chain Analysis
- 4.6. Regulatory Landscape
- 4.7. Current Market Potential and Opportunity Assessment (TAM–SAM–SOM Framework)
- 4.8. IMR Analyst Note
- 4.1. Porters Five Forces
- 5. Market Analysis, Insights and Forecast 2021-2033
- 5.1. Market Analysis, Insights and Forecast - by Application
- 5.1.1. BFSI
- 5.1.2. IT and Telecom
- 5.1.3. Retail
- 5.1.4. Automotive
- 5.1.5. Government
- 5.1.6. Healthcare
- 5.2. Market Analysis, Insights and Forecast - by Type
- 5.2.1. On-premises
- 5.2.2. Cloud-based
- 5.3. Market Analysis, Insights and Forecast - by Region
- 5.3.1. North America
- 5.3.2. South America
- 5.3.3. Europe
- 5.3.4. Middle East & Africa
- 5.3.5. Asia Pacific
- 5.1. Market Analysis, Insights and Forecast - by Application
- 6. Global Web Performance Optimization Wpo Solution Analysis, Insights and Forecast, 2021-2033
- 6.1. Market Analysis, Insights and Forecast - by Application
- 6.1.1. BFSI
- 6.1.2. IT and Telecom
- 6.1.3. Retail
- 6.1.4. Automotive
- 6.1.5. Government
- 6.1.6. Healthcare
- 6.2. Market Analysis, Insights and Forecast - by Type
- 6.2.1. On-premises
- 6.2.2. Cloud-based
- 6.1. Market Analysis, Insights and Forecast - by Application
- 7. North America Web Performance Optimization Wpo Solution Analysis, Insights and Forecast, 2020-2032
- 7.1. Market Analysis, Insights and Forecast - by Application
- 7.1.1. BFSI
- 7.1.2. IT and Telecom
- 7.1.3. Retail
- 7.1.4. Automotive
- 7.1.5. Government
- 7.1.6. Healthcare
- 7.2. Market Analysis, Insights and Forecast - by Type
- 7.2.1. On-premises
- 7.2.2. Cloud-based
- 7.1. Market Analysis, Insights and Forecast - by Application
- 8. South America Web Performance Optimization Wpo Solution Analysis, Insights and Forecast, 2020-2032
- 8.1. Market Analysis, Insights and Forecast - by Application
- 8.1.1. BFSI
- 8.1.2. IT and Telecom
- 8.1.3. Retail
- 8.1.4. Automotive
- 8.1.5. Government
- 8.1.6. Healthcare
- 8.2. Market Analysis, Insights and Forecast - by Type
- 8.2.1. On-premises
- 8.2.2. Cloud-based
- 8.1. Market Analysis, Insights and Forecast - by Application
- 9. Europe Web Performance Optimization Wpo Solution Analysis, Insights and Forecast, 2020-2032
- 9.1. Market Analysis, Insights and Forecast - by Application
- 9.1.1. BFSI
- 9.1.2. IT and Telecom
- 9.1.3. Retail
- 9.1.4. Automotive
- 9.1.5. Government
- 9.1.6. Healthcare
- 9.2. Market Analysis, Insights and Forecast - by Type
- 9.2.1. On-premises
- 9.2.2. Cloud-based
- 9.1. Market Analysis, Insights and Forecast - by Application
- 10. Middle East & Africa Web Performance Optimization Wpo Solution Analysis, Insights and Forecast, 2020-2032
- 10.1. Market Analysis, Insights and Forecast - by Application
- 10.1.1. BFSI
- 10.1.2. IT and Telecom
- 10.1.3. Retail
- 10.1.4. Automotive
- 10.1.5. Government
- 10.1.6. Healthcare
- 10.2. Market Analysis, Insights and Forecast - by Type
- 10.2.1. On-premises
- 10.2.2. Cloud-based
- 10.1. Market Analysis, Insights and Forecast - by Application
- 11. Asia Pacific Web Performance Optimization Wpo Solution Analysis, Insights and Forecast, 2020-2032
- 11.1. Market Analysis, Insights and Forecast - by Application
- 11.1.1. BFSI
- 11.1.2. IT and Telecom
- 11.1.3. Retail
- 11.1.4. Automotive
- 11.1.5. Government
- 11.1.6. Healthcare
- 11.2. Market Analysis, Insights and Forecast - by Type
- 11.2.1. On-premises
- 11.2.2. Cloud-based
- 11.1. Market Analysis, Insights and Forecast - by Application
- 12. Competitive Analysis
- 12.1. Company Profiles
- 12.1.1 IBM
- 12.1.1.1. Company Overview
- 12.1.1.2. Products
- 12.1.1.3. Company Financials
- 12.1.1.4. SWOT Analysis
- 12.1.2 Akamai
- 12.1.2.1. Company Overview
- 12.1.2.2. Products
- 12.1.2.3. Company Financials
- 12.1.2.4. SWOT Analysis
- 12.1.3 ZenQ
- 12.1.3.1. Company Overview
- 12.1.3.2. Products
- 12.1.3.3. Company Financials
- 12.1.3.4. SWOT Analysis
- 12.1.4 CA Technologies
- 12.1.4.1. Company Overview
- 12.1.4.2. Products
- 12.1.4.3. Company Financials
- 12.1.4.4. SWOT Analysis
- 12.1.5 ThousandEyes
- 12.1.5.1. Company Overview
- 12.1.5.2. Products
- 12.1.5.3. Company Financials
- 12.1.5.4. SWOT Analysis
- 12.1.6 Cavisson
- 12.1.6.1. Company Overview
- 12.1.6.2. Products
- 12.1.6.3. Company Financials
- 12.1.6.4. SWOT Analysis
- 12.1.7 New Relic
- 12.1.7.1. Company Overview
- 12.1.7.2. Products
- 12.1.7.3. Company Financials
- 12.1.7.4. SWOT Analysis
- 12.1.8 CDNetworks
- 12.1.8.1. Company Overview
- 12.1.8.2. Products
- 12.1.8.3. Company Financials
- 12.1.8.4. SWOT Analysis
- 12.1.9 Neustar
- 12.1.9.1. Company Overview
- 12.1.9.2. Products
- 12.1.9.3. Company Financials
- 12.1.9.4. SWOT Analysis
- 12.1.10 Cloudflare
- 12.1.10.1. Company Overview
- 12.1.10.2. Products
- 12.1.10.3. Company Financials
- 12.1.10.4. SWOT Analysis
- 12.1.11 Netmagic
- 12.1.11.1. Company Overview
- 12.1.11.2. Products
- 12.1.11.3. Company Financials
- 12.1.11.4. SWOT Analysis
- 12.1.12 F5 Networks
- 12.1.12.1. Company Overview
- 12.1.12.2. Products
- 12.1.12.3. Company Financials
- 12.1.12.4. SWOT Analysis
- 12.1.13 Dynatrace
- 12.1.13.1. Company Overview
- 12.1.13.2. Products
- 12.1.13.3. Company Financials
- 12.1.13.4. SWOT Analysis
- 12.1.14 Micro Focus
- 12.1.14.1. Company Overview
- 12.1.14.2. Products
- 12.1.14.3. Company Financials
- 12.1.14.4. SWOT Analysis
- 12.1.1 IBM
- 12.2. Market Entropy
- 12.2.1 Company's Key Areas Served
- 12.2.2 Recent Developments
- 12.3. Company Market Share Analysis 2025
- 12.3.1 Top 5 Companies Market Share Analysis
- 12.3.2 Top 3 Companies Market Share Analysis
- 12.4. List of Potential Customers
- 13. Research Methodology
List of Figures
- Figure 1: Global Web Performance Optimization Wpo Solution Revenue Breakdown (undefined, %) by Region 2025 & 2033
- Figure 2: North America Web Performance Optimization Wpo Solution Revenue (undefined), by Application 2025 & 2033
- Figure 3: North America Web Performance Optimization Wpo Solution Revenue Share (%), by Application 2025 & 2033
- Figure 4: North America Web Performance Optimization Wpo Solution Revenue (undefined), by Type 2025 & 2033
- Figure 5: North America Web Performance Optimization Wpo Solution Revenue Share (%), by Type 2025 & 2033
- Figure 6: North America Web Performance Optimization Wpo Solution Revenue (undefined), by Country 2025 & 2033
- Figure 7: North America Web Performance Optimization Wpo Solution Revenue Share (%), by Country 2025 & 2033
- Figure 8: South America Web Performance Optimization Wpo Solution Revenue (undefined), by Application 2025 & 2033
- Figure 9: South America Web Performance Optimization Wpo Solution Revenue Share (%), by Application 2025 & 2033
- Figure 10: South America Web Performance Optimization Wpo Solution Revenue (undefined), by Type 2025 & 2033
- Figure 11: South America Web Performance Optimization Wpo Solution Revenue Share (%), by Type 2025 & 2033
- Figure 12: South America Web Performance Optimization Wpo Solution Revenue (undefined), by Country 2025 & 2033
- Figure 13: South America Web Performance Optimization Wpo Solution Revenue Share (%), by Country 2025 & 2033
- Figure 14: Europe Web Performance Optimization Wpo Solution Revenue (undefined), by Application 2025 & 2033
- Figure 15: Europe Web Performance Optimization Wpo Solution Revenue Share (%), by Application 2025 & 2033
- Figure 16: Europe Web Performance Optimization Wpo Solution Revenue (undefined), by Type 2025 & 2033
- Figure 17: Europe Web Performance Optimization Wpo Solution Revenue Share (%), by Type 2025 & 2033
- Figure 18: Europe Web Performance Optimization Wpo Solution Revenue (undefined), by Country 2025 & 2033
- Figure 19: Europe Web Performance Optimization Wpo Solution Revenue Share (%), by Country 2025 & 2033
- Figure 20: Middle East & Africa Web Performance Optimization Wpo Solution Revenue (undefined), by Application 2025 & 2033
- Figure 21: Middle East & Africa Web Performance Optimization Wpo Solution Revenue Share (%), by Application 2025 & 2033
- Figure 22: Middle East & Africa Web Performance Optimization Wpo Solution Revenue (undefined), by Type 2025 & 2033
- Figure 23: Middle East & Africa Web Performance Optimization Wpo Solution Revenue Share (%), by Type 2025 & 2033
- Figure 24: Middle East & Africa Web Performance Optimization Wpo Solution Revenue (undefined), by Country 2025 & 2033
- Figure 25: Middle East & Africa Web Performance Optimization Wpo Solution Revenue Share (%), by Country 2025 & 2033
- Figure 26: Asia Pacific Web Performance Optimization Wpo Solution Revenue (undefined), by Application 2025 & 2033
- Figure 27: Asia Pacific Web Performance Optimization Wpo Solution Revenue Share (%), by Application 2025 & 2033
- Figure 28: Asia Pacific Web Performance Optimization Wpo Solution Revenue (undefined), by Type 2025 & 2033
- Figure 29: Asia Pacific Web Performance Optimization Wpo Solution Revenue Share (%), by Type 2025 & 2033
- Figure 30: Asia Pacific Web Performance Optimization Wpo Solution Revenue (undefined), by Country 2025 & 2033
- Figure 31: Asia Pacific Web Performance Optimization Wpo Solution Revenue Share (%), by Country 2025 & 2033
List of Tables
- Table 1: Global Web Performance Optimization Wpo Solution Revenue undefined Forecast, by Application 2020 & 2033
- Table 2: Global Web Performance Optimization Wpo Solution Revenue undefined Forecast, by Type 2020 & 2033
- Table 3: Global Web Performance Optimization Wpo Solution Revenue undefined Forecast, by Region 2020 & 2033
- Table 4: Global Web Performance Optimization Wpo Solution Revenue undefined Forecast, by Application 2020 & 2033
- Table 5: Global Web Performance Optimization Wpo Solution Revenue undefined Forecast, by Type 2020 & 2033
- Table 6: Global Web Performance Optimization Wpo Solution Revenue undefined Forecast, by Country 2020 & 2033
- Table 7: United States Web Performance Optimization Wpo Solution Revenue (undefined) Forecast, by Application 2020 & 2033
- Table 8: Canada Web Performance Optimization Wpo Solution Revenue (undefined) Forecast, by Application 2020 & 2033
- Table 9: Mexico Web Performance Optimization Wpo Solution Revenue (undefined) Forecast, by Application 2020 & 2033
- Table 10: Global Web Performance Optimization Wpo Solution Revenue undefined Forecast, by Application 2020 & 2033
- Table 11: Global Web Performance Optimization Wpo Solution Revenue undefined Forecast, by Type 2020 & 2033
- Table 12: Global Web Performance Optimization Wpo Solution Revenue undefined Forecast, by Country 2020 & 2033
- Table 13: Brazil Web Performance Optimization Wpo Solution Revenue (undefined) Forecast, by Application 2020 & 2033
- Table 14: Argentina Web Performance Optimization Wpo Solution Revenue (undefined) Forecast, by Application 2020 & 2033
- Table 15: Rest of South America Web Performance Optimization Wpo Solution Revenue (undefined) Forecast, by Application 2020 & 2033
- Table 16: Global Web Performance Optimization Wpo Solution Revenue undefined Forecast, by Application 2020 & 2033
- Table 17: Global Web Performance Optimization Wpo Solution Revenue undefined Forecast, by Type 2020 & 2033
- Table 18: Global Web Performance Optimization Wpo Solution Revenue undefined Forecast, by Country 2020 & 2033
- Table 19: United Kingdom Web Performance Optimization Wpo Solution Revenue (undefined) Forecast, by Application 2020 & 2033
- Table 20: Germany Web Performance Optimization Wpo Solution Revenue (undefined) Forecast, by Application 2020 & 2033
- Table 21: France Web Performance Optimization Wpo Solution Revenue (undefined) Forecast, by Application 2020 & 2033
- Table 22: Italy Web Performance Optimization Wpo Solution Revenue (undefined) Forecast, by Application 2020 & 2033
- Table 23: Spain Web Performance Optimization Wpo Solution Revenue (undefined) Forecast, by Application 2020 & 2033
- Table 24: Russia Web Performance Optimization Wpo Solution Revenue (undefined) Forecast, by Application 2020 & 2033
- Table 25: Benelux Web Performance Optimization Wpo Solution Revenue (undefined) Forecast, by Application 2020 & 2033
- Table 26: Nordics Web Performance Optimization Wpo Solution Revenue (undefined) Forecast, by Application 2020 & 2033
- Table 27: Rest of Europe Web Performance Optimization Wpo Solution Revenue (undefined) Forecast, by Application 2020 & 2033
- Table 28: Global Web Performance Optimization Wpo Solution Revenue undefined Forecast, by Application 2020 & 2033
- Table 29: Global Web Performance Optimization Wpo Solution Revenue undefined Forecast, by Type 2020 & 2033
- Table 30: Global Web Performance Optimization Wpo Solution Revenue undefined Forecast, by Country 2020 & 2033
- Table 31: Turkey Web Performance Optimization Wpo Solution Revenue (undefined) Forecast, by Application 2020 & 2033
- Table 32: Israel Web Performance Optimization Wpo Solution Revenue (undefined) Forecast, by Application 2020 & 2033
- Table 33: GCC Web Performance Optimization Wpo Solution Revenue (undefined) Forecast, by Application 2020 & 2033
- Table 34: North Africa Web Performance Optimization Wpo Solution Revenue (undefined) Forecast, by Application 2020 & 2033
- Table 35: South Africa Web Performance Optimization Wpo Solution Revenue (undefined) Forecast, by Application 2020 & 2033
- Table 36: Rest of Middle East & Africa Web Performance Optimization Wpo Solution Revenue (undefined) Forecast, by Application 2020 & 2033
- Table 37: Global Web Performance Optimization Wpo Solution Revenue undefined Forecast, by Application 2020 & 2033
- Table 38: Global Web Performance Optimization Wpo Solution Revenue undefined Forecast, by Type 2020 & 2033
- Table 39: Global Web Performance Optimization Wpo Solution Revenue undefined Forecast, by Country 2020 & 2033
- Table 40: China Web Performance Optimization Wpo Solution Revenue (undefined) Forecast, by Application 2020 & 2033
- Table 41: India Web Performance Optimization Wpo Solution Revenue (undefined) Forecast, by Application 2020 & 2033
- Table 42: Japan Web Performance Optimization Wpo Solution Revenue (undefined) Forecast, by Application 2020 & 2033
- Table 43: South Korea Web Performance Optimization Wpo Solution Revenue (undefined) Forecast, by Application 2020 & 2033
- Table 44: ASEAN Web Performance Optimization Wpo Solution Revenue (undefined) Forecast, by Application 2020 & 2033
- Table 45: Oceania Web Performance Optimization Wpo Solution Revenue (undefined) Forecast, by Application 2020 & 2033
- Table 46: Rest of Asia Pacific Web Performance Optimization Wpo Solution Revenue (undefined) Forecast, by Application 2020 & 2033
Frequently Asked Questions
1. What is the projected Compound Annual Growth Rate (CAGR) of the Web Performance Optimization Wpo Solution?
The projected CAGR is approximately 10.31%.
2. Which companies are prominent players in the Web Performance Optimization Wpo Solution?
Key companies in the market include IBM, Akamai, ZenQ, CA Technologies, ThousandEyes, Cavisson, New Relic, CDNetworks, Neustar, Cloudflare, Netmagic, F5 Networks, Dynatrace, Micro Focus.
3. What are the main segments of the Web Performance Optimization Wpo Solution?
The market segments include Application, Type.
4. Can you provide details about the market size?
The market size is estimated to be USD XXX N/A as of 2022.
5. What are some drivers contributing to market growth?
N/A
6. What are the notable trends driving market growth?
N/A
7. Are there any restraints impacting market growth?
N/A
8. Can you provide examples of recent developments in the market?
N/A
9. What pricing options are available for accessing the report?
Pricing options include single-user, multi-user, and enterprise licenses priced at USD 2900.00, USD 4350.00, and USD 5800.00 respectively.
10. Is the market size provided in terms of value or volume?
The market size is provided in terms of value, measured in N/A.
11. Are there any specific market keywords associated with the report?
Yes, the market keyword associated with the report is "Web Performance Optimization Wpo Solution," which aids in identifying and referencing the specific market segment covered.
12. How do I determine which pricing option suits my needs best?
The pricing options vary based on user requirements and access needs. Individual users may opt for single-user licenses, while businesses requiring broader access may choose multi-user or enterprise licenses for cost-effective access to the report.
13. Are there any additional resources or data provided in the Web Performance Optimization Wpo Solution report?
While the report offers comprehensive insights, it's advisable to review the specific contents or supplementary materials provided to ascertain if additional resources or data are available.
14. How can I stay updated on further developments or reports in the Web Performance Optimization Wpo Solution?
To stay informed about further developments, trends, and reports in the Web Performance Optimization Wpo Solution, consider subscribing to industry newsletters, following relevant companies and organizations, or regularly checking reputable industry news sources and publications.
Methodology
Step 1 - Identification of Relevant Samples Size from Population Database


Step 2 - Approaches for Defining Global Market Size (Value, Volume* & Price*)

Note*: In applicable scenarios
Step 3 - Data Sources
Primary Research
- Web Analytics
- Survey Reports
- Research Institute
- Latest Research Reports
- Opinion Leaders
Secondary Research
- Annual Reports
- White Paper
- Latest Press Release
- Industry Association
- Paid Database
- Investor Presentations

Step 4 - Data Triangulation
Involves using different sources of information in order to increase the validity of a study
These sources are likely to be stakeholders in a program - participants, other researchers, program staff, other community members, and so on.
Then we put all data in single framework & apply various statistical tools to find out the dynamic on the market.
During the analysis stage, feedback from the stakeholder groups would be compared to determine areas of agreement as well as areas of divergence