

Key Insights
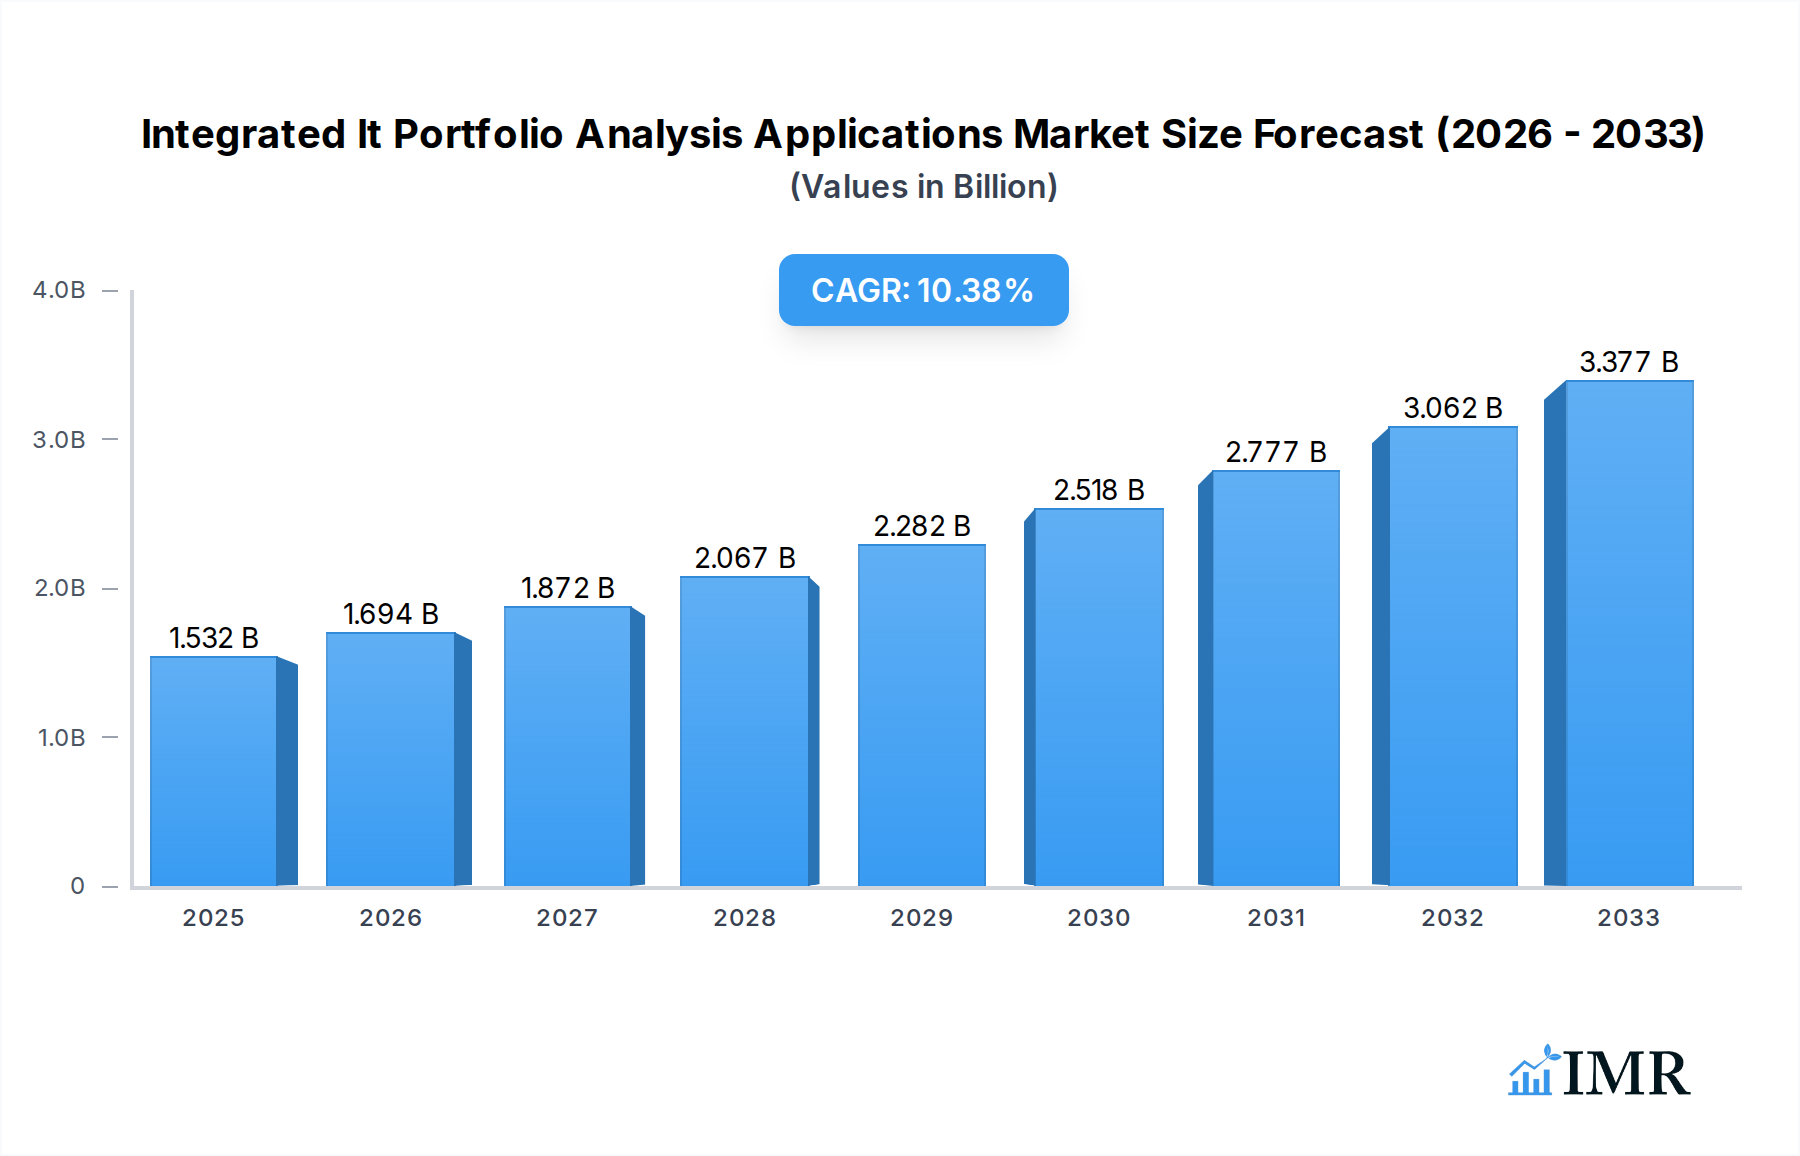
The Integrated IT Portfolio Analysis Applications market is poised for robust expansion, currently valued at $1532 million and projected to grow at a significant CAGR of 10.5% through 2033. This dynamic growth is fueled by the increasing complexity of IT landscapes within organizations and the pressing need for effective resource allocation and strategic decision-making. As businesses grapple with digital transformation initiatives, the demand for tools that offer comprehensive visibility into their IT assets, projects, and investments is escalating. Large enterprises, in particular, are significant adopters, leveraging these applications to optimize spending, mitigate risks, and align IT initiatives with overarching business objectives. The shift towards cloud-based solutions is a prominent driver, offering scalability, flexibility, and cost-efficiency that appeals to a broad spectrum of businesses, including Small and Medium-sized Enterprises (SMEs). These applications are instrumental in identifying redundant systems, optimizing application rationalization, and ensuring that IT investments deliver tangible business value, thereby becoming indispensable for modern IT governance and strategic planning.

Integrated It Portfolio Analysis Applications Market Size (In Billion)
The market is characterized by several key trends, including the integration of advanced analytics, artificial intelligence, and machine learning capabilities to provide deeper insights into IT portfolio performance. These technologies enable predictive analysis, anomaly detection, and automated recommendations for optimization. While the market exhibits strong growth, certain restraints exist, such as the high initial implementation costs for some advanced solutions and the need for specialized skills to manage and interpret the data effectively. However, the continuous innovation by leading companies like EOS Software, Changepoint, Software AG, Broadcom, UMT360, Planview, Micro Focus, and Innotas is addressing these challenges by offering more intuitive interfaces and comprehensive support. The increasing emphasis on cybersecurity and compliance further amplifies the need for robust IT portfolio analysis, ensuring that all IT assets are secure, compliant, and strategically aligned. North America and Europe currently lead the market due to early adoption and strong digital transformation initiatives, but the Asia Pacific region is expected to witness the fastest growth driven by rapid digitalization and increasing IT investments.
Integrated It Portfolio Analysis Applications Company Market Share
Integrated IT Portfolio Analysis Applications Market: Comprehensive Report Description
This in-depth report provides a definitive analysis of the Integrated IT Portfolio Analysis Applications market, a critical domain for organizations seeking to optimize IT investments, manage application lifecycles, and align technology strategies with business objectives. Explore market dynamics, growth trajectories, regional dominance, product innovations, and the strategic landscape shaped by key players. Discover emerging opportunities and growth accelerators within this essential software segment. This report is invaluable for IT leaders, strategists, portfolio managers, software vendors, and investors navigating the complexities of modern IT management.
Integrated IT Portfolio Analysis Applications Market Dynamics & Structure
The Integrated IT Portfolio Analysis Applications market exhibits a moderately concentrated structure, with a few leading players dominating market share. Technological innovation is a primary driver, fueled by the increasing demand for data-driven decision-making in IT resource allocation, risk management, and digital transformation initiatives. The development of advanced analytics, AI-driven insights, and integration capabilities with other enterprise systems are key areas of innovation.
- Technological Innovation Drivers:
- AI and Machine Learning for predictive analytics and automated portfolio optimization.
- Integration with DevOps, Agile, and Cloud Management Platforms.
- Enhanced visualization and reporting for better stakeholder communication.
- Focus on cybersecurity risk assessment within the IT portfolio.
Regulatory frameworks, particularly around data privacy and compliance (e.g., GDPR, CCPA), indirectly influence the market by requiring organizations to have robust oversight of their IT assets and their associated risks. Competitive product substitutes include generic project portfolio management (PPM) tools, enterprise architecture (EA) tools, and custom-built solutions, though dedicated integrated IT portfolio analysis applications offer a more comprehensive and specialized approach.
- Competitive Product Substitutes:
- Generic Project Portfolio Management (PPM) solutions.
- Enterprise Architecture (EA) tools lacking deep financial and risk analysis.
- Spreadsheet-based solutions (often inadequate for complex portfolios).
- Point solutions for specific aspects like application rationalization.
End-user demographics span across Large Enterprises and Small and Medium-sized Enterprises (SMEs), with larger organizations typically driving higher adoption rates due to more complex IT portfolios and greater budgetary allocations for IT management tools. Mergers and acquisitions (M&A) are a notable trend, as larger vendors acquire specialized capabilities or smaller players seek scale and market access. The market is expected to see continued consolidation as the demand for end-to-end IT portfolio visibility grows. For instance, the Integrated IT Portfolio Analysis Applications market size is projected to reach approximately $6,500 million by the Base Year 2025, with M&A activities contributing to shifts in market share.
Integrated IT Portfolio Analysis Applications Growth Trends & Insights
The Integrated IT Portfolio Analysis Applications market is experiencing robust growth, driven by the imperative for organizations to achieve greater efficiency, agility, and strategic alignment in their IT investments. The market size for Integrated IT Portfolio Analysis Applications is anticipated to grow from an estimated $5,900 million in 2024 to reach approximately $12,800 million by 2033, exhibiting a Compound Annual Growth Rate (CAGR) of 8.7% during the forecast period of 2025–2033. This expansion is underpinned by a significant shift in how businesses perceive and manage their IT landscapes.
Historically, from 2019–2024, the market witnessed steady adoption as organizations moved beyond basic IT asset inventory to more sophisticated analysis of application portfolios. This period laid the groundwork for understanding the financial implications, risks, and strategic value of each IT component. The Base Year 2025 marks a critical juncture where adoption accelerates, propelled by the increasing complexity of IT environments, the proliferation of cloud services, and the demand for comprehensive digital transformation roadmaps.
Technological disruptions are profoundly shaping this market. The integration of Artificial Intelligence (AI) and Machine Learning (ML) is revolutionizing how IT portfolios are analyzed, offering predictive capabilities for future IT needs, identifying potential risks before they materialize, and automating optimization recommendations. This enhances the effectiveness of applications within both Cloud-based and Web-based delivery models. Consumer behavior shifts are also evident, with IT decision-makers increasingly expecting seamless integration between their portfolio analysis tools and other critical business systems, such as ERP, CRM, and project management platforms. The demand for real-time data, intuitive dashboards, and actionable insights is paramount, pushing vendors to continuously innovate.
Market penetration is deepening, particularly within Large Enterprises that manage extensive and diverse IT portfolios. However, the adoption rate among SMEs is also on an upward trajectory, as the cost-effectiveness and scalability of cloud-based solutions make them more accessible. The growing emphasis on Total Cost of Ownership (TCO) and Return on Investment (ROI) for IT assets further fuels the demand for these analytical applications. Key insights reveal that organizations utilizing integrated IT portfolio analysis tools report an average reduction of 15% in redundant IT spending and an improvement of 20% in project success rates. The ability to forecast resource requirements with higher accuracy, a direct benefit of these applications, is also becoming a crucial differentiator for competitive advantage.
Dominant Regions, Countries, or Segments in Integrated IT Portfolio Analysis Applications
The North America region currently stands as the dominant force in the Integrated IT Portfolio Analysis Applications market, largely driven by its mature technological infrastructure, substantial IT spending by Large Enterprises, and a strong emphasis on digital transformation initiatives. The United States, in particular, contributes significantly to this dominance, with a high concentration of Fortune 500 companies actively seeking to optimize their complex IT portfolios. The market for Integrated IT Portfolio Analysis Applications in North America is estimated to be around $2,500 million in the Base Year 2025.
Key drivers behind North America's leadership include:
- Economic Policies and Investment: Strong government support for technological innovation and significant private sector investment in IT modernization.
- Technological Adoption: Early and rapid adoption of advanced IT solutions, including cloud computing and sophisticated analytical tools.
- Regulatory Landscape: While not always a direct driver, regulations around data security and compliance necessitate robust IT portfolio oversight.
- Presence of Key Players: Headquarters and major operational centers of leading IT software vendors are located in this region, fostering innovation and market development.
Within this dominant region, the Large Enterprises segment is the primary growth engine. These organizations typically manage vast and intricate IT portfolios, encompassing legacy systems, cloud deployments, and numerous applications. The sheer scale of their IT investments and the associated complexities in managing costs, risks, and strategic alignment make integrated IT portfolio analysis applications indispensable. The market share for Large Enterprises in North America is estimated to be around 70% of the regional market, projected to reach approximately $1,750 million by 2025.
The Cloud-based delivery model is also a significant contributor to market growth across all regions, and North America is no exception. Cloud solutions offer scalability, flexibility, and often a lower upfront cost compared to on-premises deployments, making them attractive to a wider range of organizations. The ease of integration and accessibility of cloud-based applications aligns well with the dynamic needs of modern businesses. The market share for Cloud-based Integrated IT Portfolio Analysis Applications in North America is estimated at 65%, projected to reach $1,625 million by 2025.
Conversely, while SMEs represent a smaller portion of the current market value, their adoption rates are growing at a faster pace. As the benefits of IT portfolio analysis become more widely understood and as cloud solutions become more affordable, SMEs are increasingly investing in these tools to gain a competitive edge. The Web-based delivery model also plays a crucial role, offering broad accessibility without requiring extensive IT infrastructure on the client’s end. These segments, though not currently dominant in absolute market value, represent significant future growth potential. The projected growth in the Application segment for SMEs is estimated at a CAGR of 9.5% during the forecast period.
Integrated IT Portfolio Analysis Applications Product Landscape
The product landscape for Integrated IT Portfolio Analysis Applications is characterized by a relentless focus on enhancing analytical capabilities, improving user experience, and ensuring seamless integration with the broader IT ecosystem. Vendors are increasingly embedding AI and machine learning algorithms to provide predictive insights, automate routine tasks like data aggregation and risk assessment, and offer intelligent recommendations for portfolio optimization. Key innovations include advanced scenario planning tools that allow organizations to model the impact of various IT investment decisions, and robust application rationalization modules that identify redundancies and opportunities for cost savings. Performance metrics are being refined to include granular data on application performance, user satisfaction, and alignment with business outcomes. Unique selling propositions often revolve around the depth of financial analysis, the clarity of risk visualization, and the ease with which these platforms can be customized to meet specific organizational needs. For instance, recent product releases have focused on enabling real-time carbon footprint analysis of IT assets, a growing concern for sustainability-conscious enterprises.
Key Drivers, Barriers & Challenges in Integrated IT Portfolio Analysis Applications
The Integrated IT Portfolio Analysis Applications market is propelled by several key drivers. The increasing complexity of IT environments, driven by cloud adoption, hybrid IT models, and a growing number of applications, necessitates sophisticated tools for effective management. The constant pressure to optimize IT spending and demonstrate the ROI of technology investments is a significant accelerator. Furthermore, the demand for digital transformation and the need to align IT strategy with business objectives fuel the adoption of these analytical solutions. Technological advancements, particularly in AI and data analytics, are making these applications more powerful and insightful.
- Key Drivers:
- IT Cost Optimization: Reducing redundant spending and maximizing value from IT investments.
- Digital Transformation Enablement: Aligning IT with strategic business goals.
- Risk Management: Identifying and mitigating IT-related risks (security, compliance, obsolescence).
- Improved Decision-Making: Providing data-driven insights for IT strategy.
- Technological Advancements: AI, ML, and advanced analytics.
However, several barriers and challenges exist. The initial cost of implementation and the ongoing subscription fees can be prohibitive for smaller organizations. Resistance to change within IT departments and a lack of skilled personnel to effectively utilize complex analytical tools can also hinder adoption. Data integration from disparate IT systems can be a significant technical hurdle, often requiring substantial effort. Furthermore, the perceived complexity of these solutions and a lack of awareness about their full capabilities can limit market penetration.
- Key Challenges and Restraints:
- Implementation Costs: High initial investment and subscription fees.
- Data Integration Complexity: Challenges in aggregating data from diverse IT sources.
- Skill Gaps: Lack of in-house expertise to operate and leverage advanced tools.
- Organizational Resistance to Change: Inertia and reluctance to adopt new management paradigms.
- Market Awareness: Limited understanding of the full scope of benefits offered.
Quantifiable impacts of these challenges include extended implementation timelines, estimated at 10-20% longer than anticipated, and a potential 5-10% decrease in anticipated ROI if adoption and utilization are suboptimal.
Emerging Opportunities in Integrated IT Portfolio Analysis Applications
Emerging opportunities in the Integrated IT Portfolio Analysis Applications sector are closely tied to the evolving technological landscape and shifting business priorities. The increasing focus on ESG (Environmental, Social, and Governance) factors presents a significant avenue for growth, with the development of modules that track the environmental impact of IT infrastructure and applications. The integration of IT portfolio analysis with cybersecurity risk management is another burgeoning area, enabling organizations to proactively identify vulnerabilities and assess the security posture of their entire IT landscape. Furthermore, the expansion of AI-driven automation for IT operations, often referred to as AIOps, provides an opportunity to embed portfolio analysis directly into operational workflows, offering real-time insights and automated remediation. The growing demand for specialized analytics within specific industries, such as healthcare, finance, and manufacturing, also represents untapped market potential for tailored solutions.
Growth Accelerators in the Integrated IT Portfolio Analysis Applications Industry
Several catalysts are accelerating growth within the Integrated IT Portfolio Analysis Applications industry. The ongoing digital transformation initiatives across all sectors are a primary driver, compelling organizations to gain a comprehensive understanding of their technology investments to ensure strategic alignment. The increasing adoption of hybrid and multi-cloud environments necessitates sophisticated tools to manage and optimize the complex IT landscape. Furthermore, the growing emphasis on data-driven decision-making and the need to justify IT budgets with tangible business value are pushing organizations towards integrated portfolio analysis. Strategic partnerships between IT portfolio analysis vendors and providers of complementary solutions, such as cloud management platforms and cybersecurity tools, are also creating new market synergies and expanding reach. The continuous innovation in AI and machine learning, enabling more predictive and prescriptive analytics, is a key technological accelerator, making these applications more valuable and intuitive.
Key Players Shaping the Integrated IT Portfolio Analysis Applications Market
Notable Milestones in Integrated IT Portfolio Analysis Applications Sector
- 2019/03: Software AG acquires a leading enterprise architecture management solution, enhancing its portfolio analysis capabilities.
- 2020/01: Planview announces significant enhancements to its platform, integrating AI for better IT portfolio optimization.
- 2021/07: Broadcom expands its IT asset management portfolio with strategic acquisitions.
- 2022/04: UMT360 launches new features for cloud portfolio cost management.
- 2023/02: Changepoint strengthens its PPM and IT portfolio capabilities through platform upgrades.
- 2023/11: EOS Software introduces advanced analytics for application rationalization.
- 2024/01: Micro Focus enhances its offerings with improved integration for hybrid IT environments.
In-Depth Integrated IT Portfolio Analysis Applications Market Outlook
The future outlook for the Integrated IT Portfolio Analysis Applications market is exceptionally strong, driven by ongoing digital transformation, the proliferation of cloud technologies, and the increasing demand for data-driven IT management. Growth accelerators such as AI-driven automation, advanced analytics for risk assessment, and the integration of sustainability metrics will continue to shape the market. Strategic partnerships and ongoing innovation in product features will further enhance the value proposition for organizations of all sizes. The market is poised for continued expansion as businesses recognize the critical importance of optimizing their IT investments for competitive advantage and operational efficiency. Future market potential lies in deeper integration with cybersecurity and AIOps, creating truly holistic IT management platforms.
Integrated It Portfolio Analysis Applications Segmentation
-
1. Application
- 1.1. Large Enterprises
- 1.2. SMEs
-
2. Type
- 2.1. Cloud-based
- 2.2. Web-based
Integrated It Portfolio Analysis Applications Segmentation By Geography
-
1. North America
- 1.1. United States
- 1.2. Canada
- 1.3. Mexico
-
2. South America
- 2.1. Brazil
- 2.2. Argentina
- 2.3. Rest of South America
-
3. Europe
- 3.1. United Kingdom
- 3.2. Germany
- 3.3. France
- 3.4. Italy
- 3.5. Spain
- 3.6. Russia
- 3.7. Benelux
- 3.8. Nordics
- 3.9. Rest of Europe
-
4. Middle East & Africa
- 4.1. Turkey
- 4.2. Israel
- 4.3. GCC
- 4.4. North Africa
- 4.5. South Africa
- 4.6. Rest of Middle East & Africa
-
5. Asia Pacific
- 5.1. China
- 5.2. India
- 5.3. Japan
- 5.4. South Korea
- 5.5. ASEAN
- 5.6. Oceania
- 5.7. Rest of Asia Pacific

Integrated It Portfolio Analysis Applications Regional Market Share
Geographic Coverage of Integrated It Portfolio Analysis Applications
Integrated It Portfolio Analysis Applications REPORT HIGHLIGHTS
| Aspects | Details |
|---|---|
| Study Period | 2020-2034 |
| Base Year | 2025 |
| Estimated Year | 2026 |
| Forecast Period | 2026-2034 |
| Historical Period | 2020-2025 |
| Growth Rate | CAGR of 10.5% from 2020-2034 |
| Segmentation |
|
Table of Contents
- 1. Introduction
- 1.1. Research Scope
- 1.2. Market Segmentation
- 1.3. Research Methodology
- 1.4. Definitions and Assumptions
- 2. Executive Summary
- 2.1. Introduction
- 3. Market Dynamics
- 3.1. Introduction
- 3.2. Market Drivers
- 3.3. Market Restrains
- 3.4. Market Trends
- 4. Market Factor Analysis
- 4.1. Porters Five Forces
- 4.2. Supply/Value Chain
- 4.3. PESTEL analysis
- 4.4. Market Entropy
- 4.5. Patent/Trademark Analysis
- 5. Global Integrated It Portfolio Analysis Applications Analysis, Insights and Forecast, 2020-2032
- 5.1. Market Analysis, Insights and Forecast - by Application
- 5.1.1. Large Enterprises
- 5.1.2. SMEs
- 5.2. Market Analysis, Insights and Forecast - by Type
- 5.2.1. Cloud-based
- 5.2.2. Web-based
- 5.3. Market Analysis, Insights and Forecast - by Region
- 5.3.1. North America
- 5.3.2. South America
- 5.3.3. Europe
- 5.3.4. Middle East & Africa
- 5.3.5. Asia Pacific
- 5.1. Market Analysis, Insights and Forecast - by Application
- 6. North America Integrated It Portfolio Analysis Applications Analysis, Insights and Forecast, 2020-2032
- 6.1. Market Analysis, Insights and Forecast - by Application
- 6.1.1. Large Enterprises
- 6.1.2. SMEs
- 6.2. Market Analysis, Insights and Forecast - by Type
- 6.2.1. Cloud-based
- 6.2.2. Web-based
- 6.1. Market Analysis, Insights and Forecast - by Application
- 7. South America Integrated It Portfolio Analysis Applications Analysis, Insights and Forecast, 2020-2032
- 7.1. Market Analysis, Insights and Forecast - by Application
- 7.1.1. Large Enterprises
- 7.1.2. SMEs
- 7.2. Market Analysis, Insights and Forecast - by Type
- 7.2.1. Cloud-based
- 7.2.2. Web-based
- 7.1. Market Analysis, Insights and Forecast - by Application
- 8. Europe Integrated It Portfolio Analysis Applications Analysis, Insights and Forecast, 2020-2032
- 8.1. Market Analysis, Insights and Forecast - by Application
- 8.1.1. Large Enterprises
- 8.1.2. SMEs
- 8.2. Market Analysis, Insights and Forecast - by Type
- 8.2.1. Cloud-based
- 8.2.2. Web-based
- 8.1. Market Analysis, Insights and Forecast - by Application
- 9. Middle East & Africa Integrated It Portfolio Analysis Applications Analysis, Insights and Forecast, 2020-2032
- 9.1. Market Analysis, Insights and Forecast - by Application
- 9.1.1. Large Enterprises
- 9.1.2. SMEs
- 9.2. Market Analysis, Insights and Forecast - by Type
- 9.2.1. Cloud-based
- 9.2.2. Web-based
- 9.1. Market Analysis, Insights and Forecast - by Application
- 10. Asia Pacific Integrated It Portfolio Analysis Applications Analysis, Insights and Forecast, 2020-2032
- 10.1. Market Analysis, Insights and Forecast - by Application
- 10.1.1. Large Enterprises
- 10.1.2. SMEs
- 10.2. Market Analysis, Insights and Forecast - by Type
- 10.2.1. Cloud-based
- 10.2.2. Web-based
- 10.1. Market Analysis, Insights and Forecast - by Application
- 11. Competitive Analysis
- 11.1. Global Market Share Analysis 2025
- 11.2. Company Profiles
- 11.2.1 EOS Software
- 11.2.1.1. Overview
- 11.2.1.2. Products
- 11.2.1.3. SWOT Analysis
- 11.2.1.4. Recent Developments
- 11.2.1.5. Financials (Based on Availability)
- 11.2.2 Changepoint
- 11.2.2.1. Overview
- 11.2.2.2. Products
- 11.2.2.3. SWOT Analysis
- 11.2.2.4. Recent Developments
- 11.2.2.5. Financials (Based on Availability)
- 11.2.3 Software AG
- 11.2.3.1. Overview
- 11.2.3.2. Products
- 11.2.3.3. SWOT Analysis
- 11.2.3.4. Recent Developments
- 11.2.3.5. Financials (Based on Availability)
- 11.2.4 Broadcom
- 11.2.4.1. Overview
- 11.2.4.2. Products
- 11.2.4.3. SWOT Analysis
- 11.2.4.4. Recent Developments
- 11.2.4.5. Financials (Based on Availability)
- 11.2.5 UMT360
- 11.2.5.1. Overview
- 11.2.5.2. Products
- 11.2.5.3. SWOT Analysis
- 11.2.5.4. Recent Developments
- 11.2.5.5. Financials (Based on Availability)
- 11.2.6 Planview
- 11.2.6.1. Overview
- 11.2.6.2. Products
- 11.2.6.3. SWOT Analysis
- 11.2.6.4. Recent Developments
- 11.2.6.5. Financials (Based on Availability)
- 11.2.7 Micro Focus
- 11.2.7.1. Overview
- 11.2.7.2. Products
- 11.2.7.3. SWOT Analysis
- 11.2.7.4. Recent Developments
- 11.2.7.5. Financials (Based on Availability)
- 11.2.8 Innotas
- 11.2.8.1. Overview
- 11.2.8.2. Products
- 11.2.8.3. SWOT Analysis
- 11.2.8.4. Recent Developments
- 11.2.8.5. Financials (Based on Availability)
- 11.2.1 EOS Software
List of Figures
- Figure 1: Global Integrated It Portfolio Analysis Applications Revenue Breakdown (million, %) by Region 2025 & 2033
- Figure 2: North America Integrated It Portfolio Analysis Applications Revenue (million), by Application 2025 & 2033
- Figure 3: North America Integrated It Portfolio Analysis Applications Revenue Share (%), by Application 2025 & 2033
- Figure 4: North America Integrated It Portfolio Analysis Applications Revenue (million), by Type 2025 & 2033
- Figure 5: North America Integrated It Portfolio Analysis Applications Revenue Share (%), by Type 2025 & 2033
- Figure 6: North America Integrated It Portfolio Analysis Applications Revenue (million), by Country 2025 & 2033
- Figure 7: North America Integrated It Portfolio Analysis Applications Revenue Share (%), by Country 2025 & 2033
- Figure 8: South America Integrated It Portfolio Analysis Applications Revenue (million), by Application 2025 & 2033
- Figure 9: South America Integrated It Portfolio Analysis Applications Revenue Share (%), by Application 2025 & 2033
- Figure 10: South America Integrated It Portfolio Analysis Applications Revenue (million), by Type 2025 & 2033
- Figure 11: South America Integrated It Portfolio Analysis Applications Revenue Share (%), by Type 2025 & 2033
- Figure 12: South America Integrated It Portfolio Analysis Applications Revenue (million), by Country 2025 & 2033
- Figure 13: South America Integrated It Portfolio Analysis Applications Revenue Share (%), by Country 2025 & 2033
- Figure 14: Europe Integrated It Portfolio Analysis Applications Revenue (million), by Application 2025 & 2033
- Figure 15: Europe Integrated It Portfolio Analysis Applications Revenue Share (%), by Application 2025 & 2033
- Figure 16: Europe Integrated It Portfolio Analysis Applications Revenue (million), by Type 2025 & 2033
- Figure 17: Europe Integrated It Portfolio Analysis Applications Revenue Share (%), by Type 2025 & 2033
- Figure 18: Europe Integrated It Portfolio Analysis Applications Revenue (million), by Country 2025 & 2033
- Figure 19: Europe Integrated It Portfolio Analysis Applications Revenue Share (%), by Country 2025 & 2033
- Figure 20: Middle East & Africa Integrated It Portfolio Analysis Applications Revenue (million), by Application 2025 & 2033
- Figure 21: Middle East & Africa Integrated It Portfolio Analysis Applications Revenue Share (%), by Application 2025 & 2033
- Figure 22: Middle East & Africa Integrated It Portfolio Analysis Applications Revenue (million), by Type 2025 & 2033
- Figure 23: Middle East & Africa Integrated It Portfolio Analysis Applications Revenue Share (%), by Type 2025 & 2033
- Figure 24: Middle East & Africa Integrated It Portfolio Analysis Applications Revenue (million), by Country 2025 & 2033
- Figure 25: Middle East & Africa Integrated It Portfolio Analysis Applications Revenue Share (%), by Country 2025 & 2033
- Figure 26: Asia Pacific Integrated It Portfolio Analysis Applications Revenue (million), by Application 2025 & 2033
- Figure 27: Asia Pacific Integrated It Portfolio Analysis Applications Revenue Share (%), by Application 2025 & 2033
- Figure 28: Asia Pacific Integrated It Portfolio Analysis Applications Revenue (million), by Type 2025 & 2033
- Figure 29: Asia Pacific Integrated It Portfolio Analysis Applications Revenue Share (%), by Type 2025 & 2033
- Figure 30: Asia Pacific Integrated It Portfolio Analysis Applications Revenue (million), by Country 2025 & 2033
- Figure 31: Asia Pacific Integrated It Portfolio Analysis Applications Revenue Share (%), by Country 2025 & 2033
List of Tables
- Table 1: Global Integrated It Portfolio Analysis Applications Revenue million Forecast, by Application 2020 & 2033
- Table 2: Global Integrated It Portfolio Analysis Applications Revenue million Forecast, by Type 2020 & 2033
- Table 3: Global Integrated It Portfolio Analysis Applications Revenue million Forecast, by Region 2020 & 2033
- Table 4: Global Integrated It Portfolio Analysis Applications Revenue million Forecast, by Application 2020 & 2033
- Table 5: Global Integrated It Portfolio Analysis Applications Revenue million Forecast, by Type 2020 & 2033
- Table 6: Global Integrated It Portfolio Analysis Applications Revenue million Forecast, by Country 2020 & 2033
- Table 7: United States Integrated It Portfolio Analysis Applications Revenue (million) Forecast, by Application 2020 & 2033
- Table 8: Canada Integrated It Portfolio Analysis Applications Revenue (million) Forecast, by Application 2020 & 2033
- Table 9: Mexico Integrated It Portfolio Analysis Applications Revenue (million) Forecast, by Application 2020 & 2033
- Table 10: Global Integrated It Portfolio Analysis Applications Revenue million Forecast, by Application 2020 & 2033
- Table 11: Global Integrated It Portfolio Analysis Applications Revenue million Forecast, by Type 2020 & 2033
- Table 12: Global Integrated It Portfolio Analysis Applications Revenue million Forecast, by Country 2020 & 2033
- Table 13: Brazil Integrated It Portfolio Analysis Applications Revenue (million) Forecast, by Application 2020 & 2033
- Table 14: Argentina Integrated It Portfolio Analysis Applications Revenue (million) Forecast, by Application 2020 & 2033
- Table 15: Rest of South America Integrated It Portfolio Analysis Applications Revenue (million) Forecast, by Application 2020 & 2033
- Table 16: Global Integrated It Portfolio Analysis Applications Revenue million Forecast, by Application 2020 & 2033
- Table 17: Global Integrated It Portfolio Analysis Applications Revenue million Forecast, by Type 2020 & 2033
- Table 18: Global Integrated It Portfolio Analysis Applications Revenue million Forecast, by Country 2020 & 2033
- Table 19: United Kingdom Integrated It Portfolio Analysis Applications Revenue (million) Forecast, by Application 2020 & 2033
- Table 20: Germany Integrated It Portfolio Analysis Applications Revenue (million) Forecast, by Application 2020 & 2033
- Table 21: France Integrated It Portfolio Analysis Applications Revenue (million) Forecast, by Application 2020 & 2033
- Table 22: Italy Integrated It Portfolio Analysis Applications Revenue (million) Forecast, by Application 2020 & 2033
- Table 23: Spain Integrated It Portfolio Analysis Applications Revenue (million) Forecast, by Application 2020 & 2033
- Table 24: Russia Integrated It Portfolio Analysis Applications Revenue (million) Forecast, by Application 2020 & 2033
- Table 25: Benelux Integrated It Portfolio Analysis Applications Revenue (million) Forecast, by Application 2020 & 2033
- Table 26: Nordics Integrated It Portfolio Analysis Applications Revenue (million) Forecast, by Application 2020 & 2033
- Table 27: Rest of Europe Integrated It Portfolio Analysis Applications Revenue (million) Forecast, by Application 2020 & 2033
- Table 28: Global Integrated It Portfolio Analysis Applications Revenue million Forecast, by Application 2020 & 2033
- Table 29: Global Integrated It Portfolio Analysis Applications Revenue million Forecast, by Type 2020 & 2033
- Table 30: Global Integrated It Portfolio Analysis Applications Revenue million Forecast, by Country 2020 & 2033
- Table 31: Turkey Integrated It Portfolio Analysis Applications Revenue (million) Forecast, by Application 2020 & 2033
- Table 32: Israel Integrated It Portfolio Analysis Applications Revenue (million) Forecast, by Application 2020 & 2033
- Table 33: GCC Integrated It Portfolio Analysis Applications Revenue (million) Forecast, by Application 2020 & 2033
- Table 34: North Africa Integrated It Portfolio Analysis Applications Revenue (million) Forecast, by Application 2020 & 2033
- Table 35: South Africa Integrated It Portfolio Analysis Applications Revenue (million) Forecast, by Application 2020 & 2033
- Table 36: Rest of Middle East & Africa Integrated It Portfolio Analysis Applications Revenue (million) Forecast, by Application 2020 & 2033
- Table 37: Global Integrated It Portfolio Analysis Applications Revenue million Forecast, by Application 2020 & 2033
- Table 38: Global Integrated It Portfolio Analysis Applications Revenue million Forecast, by Type 2020 & 2033
- Table 39: Global Integrated It Portfolio Analysis Applications Revenue million Forecast, by Country 2020 & 2033
- Table 40: China Integrated It Portfolio Analysis Applications Revenue (million) Forecast, by Application 2020 & 2033
- Table 41: India Integrated It Portfolio Analysis Applications Revenue (million) Forecast, by Application 2020 & 2033
- Table 42: Japan Integrated It Portfolio Analysis Applications Revenue (million) Forecast, by Application 2020 & 2033
- Table 43: South Korea Integrated It Portfolio Analysis Applications Revenue (million) Forecast, by Application 2020 & 2033
- Table 44: ASEAN Integrated It Portfolio Analysis Applications Revenue (million) Forecast, by Application 2020 & 2033
- Table 45: Oceania Integrated It Portfolio Analysis Applications Revenue (million) Forecast, by Application 2020 & 2033
- Table 46: Rest of Asia Pacific Integrated It Portfolio Analysis Applications Revenue (million) Forecast, by Application 2020 & 2033
Frequently Asked Questions
1. What is the projected Compound Annual Growth Rate (CAGR) of the Integrated It Portfolio Analysis Applications?
The projected CAGR is approximately 10.5%.
2. Which companies are prominent players in the Integrated It Portfolio Analysis Applications?
Key companies in the market include EOS Software, Changepoint, Software AG, Broadcom, UMT360, Planview, Micro Focus, Innotas.
3. What are the main segments of the Integrated It Portfolio Analysis Applications?
The market segments include Application, Type.
4. Can you provide details about the market size?
The market size is estimated to be USD 1532 million as of 2022.
5. What are some drivers contributing to market growth?
N/A
6. What are the notable trends driving market growth?
N/A
7. Are there any restraints impacting market growth?
N/A
8. Can you provide examples of recent developments in the market?
N/A
9. What pricing options are available for accessing the report?
Pricing options include single-user, multi-user, and enterprise licenses priced at USD 3950.00, USD 5925.00, and USD 7900.00 respectively.
10. Is the market size provided in terms of value or volume?
The market size is provided in terms of value, measured in million.
11. Are there any specific market keywords associated with the report?
Yes, the market keyword associated with the report is "Integrated It Portfolio Analysis Applications," which aids in identifying and referencing the specific market segment covered.
12. How do I determine which pricing option suits my needs best?
The pricing options vary based on user requirements and access needs. Individual users may opt for single-user licenses, while businesses requiring broader access may choose multi-user or enterprise licenses for cost-effective access to the report.
13. Are there any additional resources or data provided in the Integrated It Portfolio Analysis Applications report?
While the report offers comprehensive insights, it's advisable to review the specific contents or supplementary materials provided to ascertain if additional resources or data are available.
14. How can I stay updated on further developments or reports in the Integrated It Portfolio Analysis Applications?
To stay informed about further developments, trends, and reports in the Integrated It Portfolio Analysis Applications, consider subscribing to industry newsletters, following relevant companies and organizations, or regularly checking reputable industry news sources and publications.
Methodology
Step 1 - Identification of Relevant Samples Size from Population Database


Step 2 - Approaches for Defining Global Market Size (Value, Volume* & Price*)

Note*: In applicable scenarios
Step 3 - Data Sources
Primary Research
- Web Analytics
- Survey Reports
- Research Institute
- Latest Research Reports
- Opinion Leaders
Secondary Research
- Annual Reports
- White Paper
- Latest Press Release
- Industry Association
- Paid Database
- Investor Presentations

Step 4 - Data Triangulation
Involves using different sources of information in order to increase the validity of a study
These sources are likely to be stakeholders in a program - participants, other researchers, program staff, other community members, and so on.
Then we put all data in single framework & apply various statistical tools to find out the dynamic on the market.
During the analysis stage, feedback from the stakeholder groups would be compared to determine areas of agreement as well as areas of divergence