

Key Insights
The North America Performing Arts Companies market is poised for significant expansion, projected to reach $193.38 million by 2025, with a Compound Annual Growth Rate (CAGR) of 5.67%. This growth is propelled by rising disposable incomes, increased consumer demand for live entertainment, and the burgeoning popularity of diverse performing arts genres. Post-pandemic recovery has further bolstered the live events sector. Leading companies like The Walt Disney Company, Live Nation Entertainment, and Cirque du Soleil are key players, leveraging strong brand recognition and extensive distribution. Challenges include ticket price volatility, competition from digital entertainment, and the imperative for ongoing innovation to engage evolving audiences. Market segments typically encompass ticketing, venue management, production, and merchandising, with higher penetration observed in major metropolitan and tourist hubs. Future success hinges on strategic partnerships, technological integration for immersive experiences, and agile adaptation to consumer preferences.
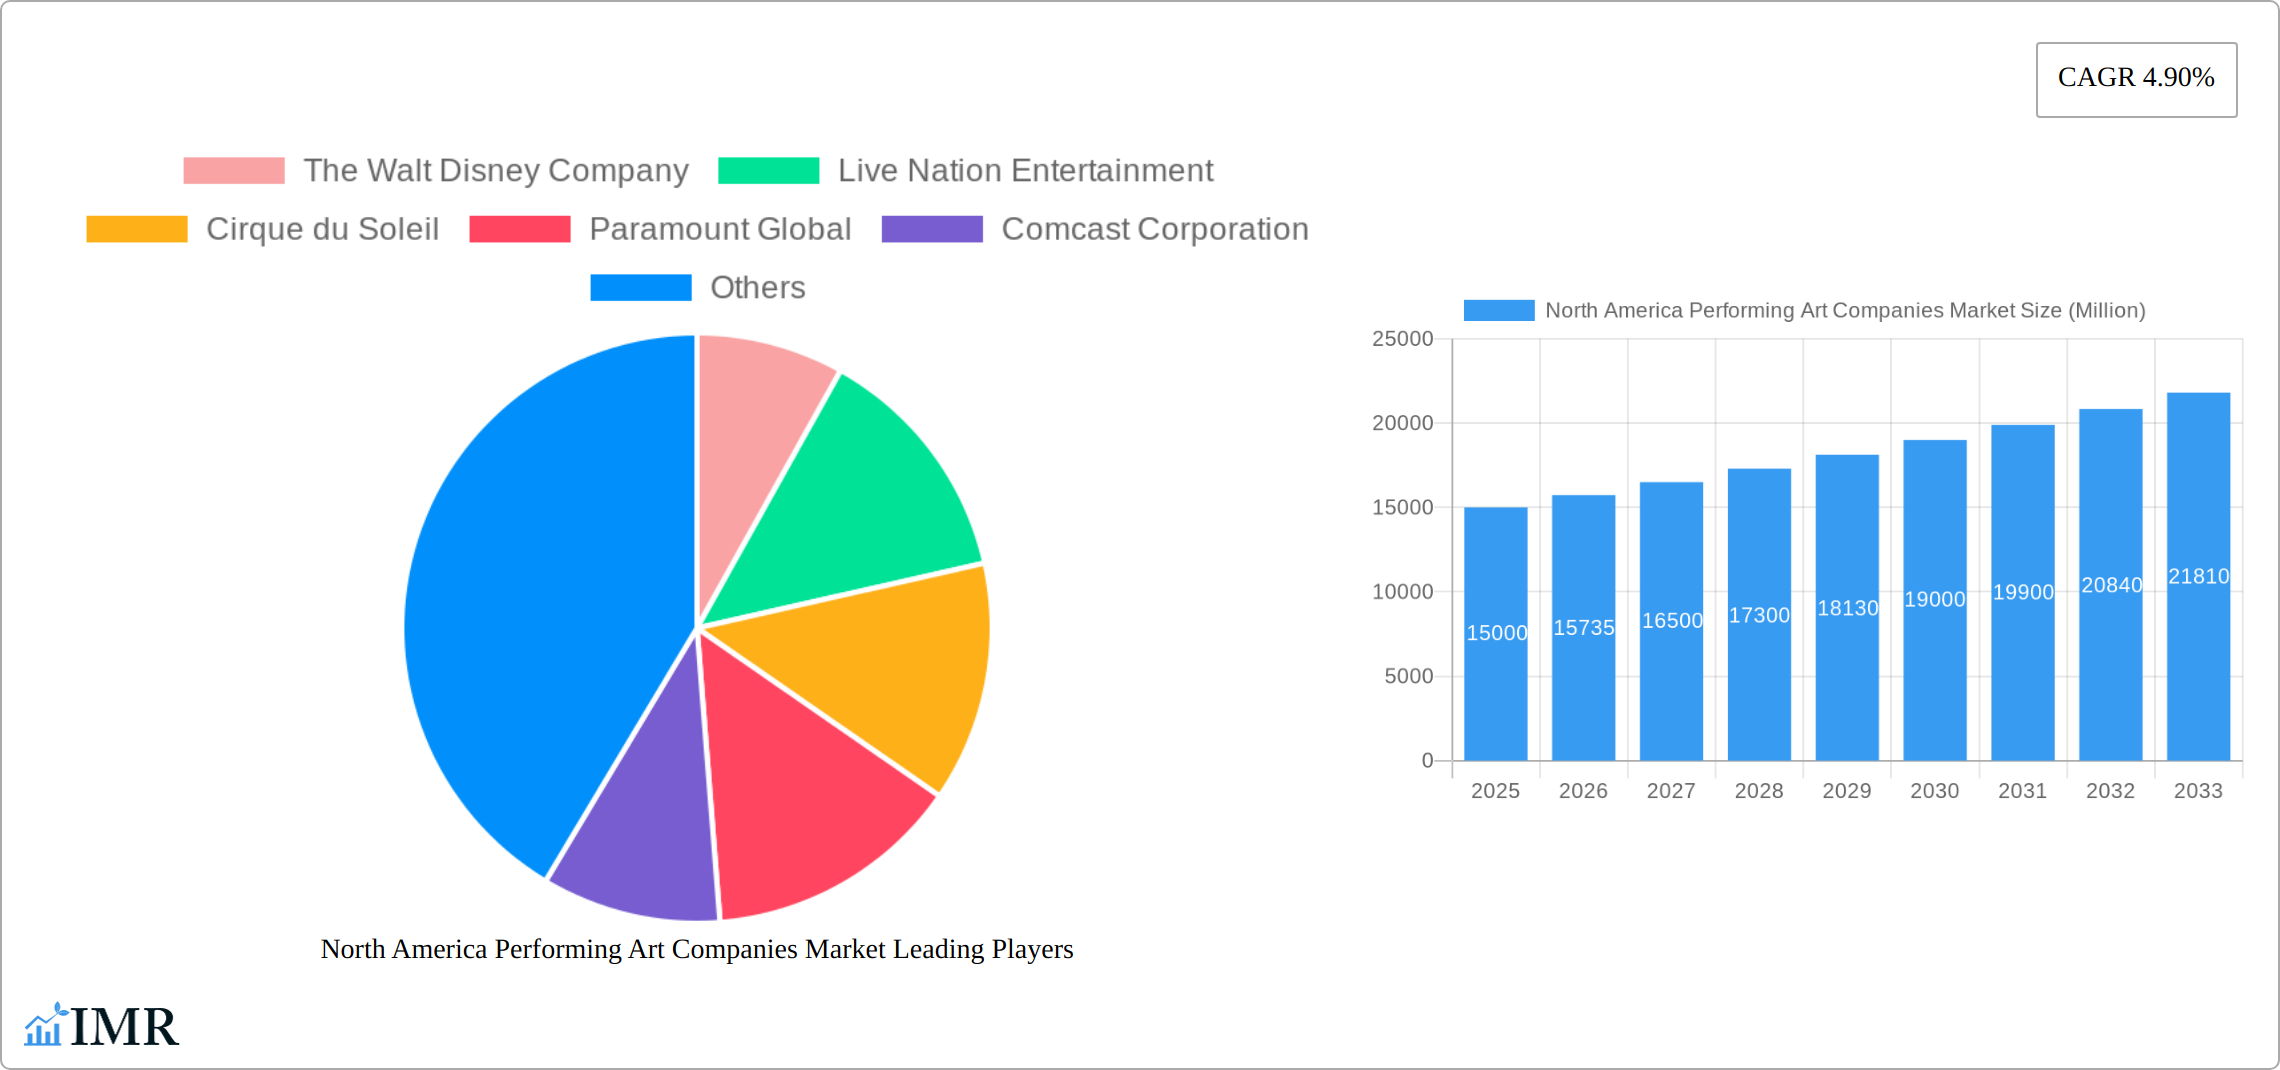
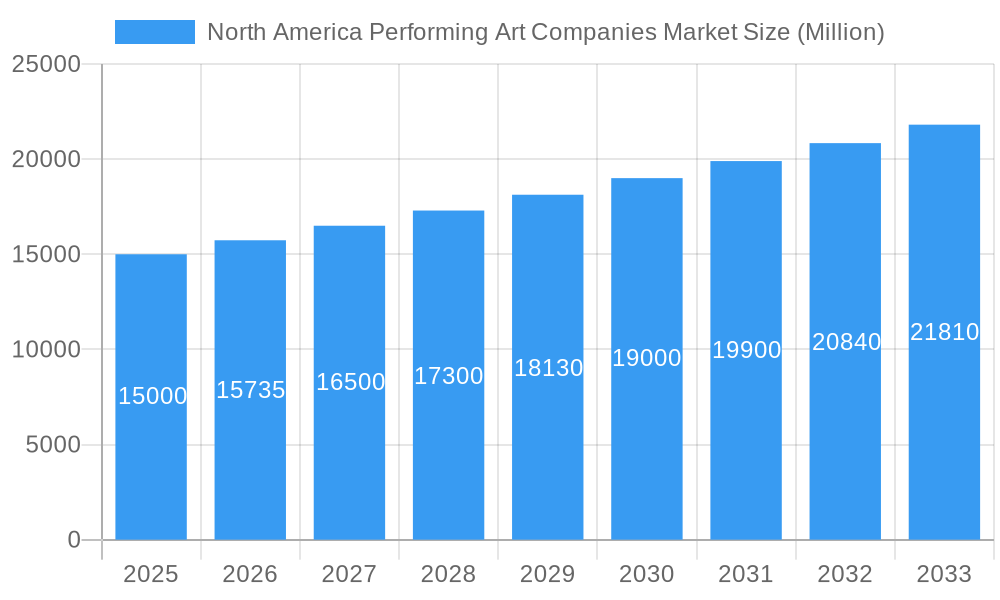
North America Performing Art Companies Market Market Size (In Million)
The forecast period from 2025 to 2033 indicates sustained market growth, supported by investments in novel productions, advanced audience engagement technologies (e.g., VR, interactive elements), and the enduring appeal of live performances. Navigating economic fluctuations and demographic shifts is critical for sustained success in this dynamic sector. The market's diversity, from large-scale productions to independent companies, offers both growth opportunities and competitive challenges. Delivering unique, memorable experiences through effective marketing and distribution will be paramount for audience acquisition and retention.
North America Performing Art Companies Market Company Market Share
North America Performing Arts Companies Market: A Comprehensive Report (2019-2033)
This in-depth report provides a comprehensive analysis of the North America Performing Arts Companies market, encompassing market dynamics, growth trends, key players, and future opportunities. With a study period spanning 2019-2033, a base year of 2025, and a forecast period of 2025-2033, this report offers invaluable insights for industry professionals, investors, and stakeholders. The report covers the parent market of the Entertainment Industry and the child market of Live Performing Arts, providing a granular view of this dynamic sector. The market size is predicted to reach xx Million by 2033.
North America Performing Art Companies Market Dynamics & Structure
The North American performing arts market is a complex ecosystem characterized by both concentrated and fragmented segments. Major players like The Walt Disney Company, Live Nation Entertainment, and Cirque du Soleil hold significant market share, but numerous smaller regional companies and independent artists contribute significantly to the overall landscape. Technological innovation, particularly in digital distribution and virtual reality experiences, is a key driver, impacting both production and consumption. Regulatory frameworks, varying across states and municipalities, influence venue licensing, artist visas, and content restrictions. The market faces competition from substitute forms of entertainment, including streaming services and video games. End-user demographics are diverse, spanning across age groups, income levels, and cultural backgrounds. M&A activity within the sector has been moderate in recent years, with xx deals valued at approximately xx Million recorded between 2020 and 2024.
- Market Concentration: Highly concentrated at the top tier, with increasing fragmentation at the regional level. The top 5 players hold approximately xx% market share in 2025.
- Technological Innovation: VR/AR experiences, enhanced streaming capabilities, and data-driven audience engagement are key innovation drivers.
- Regulatory Frameworks: Varying licensing, zoning, and content regulations across different jurisdictions present challenges.
- Competitive Substitutes: Streaming services, gaming, and home entertainment systems compete for consumer leisure time.
- End-User Demographics: A diverse audience base with varying preferences, impacting content and distribution strategies.
- M&A Trends: Moderate M&A activity driven by consolidation efforts and expansion into new markets.
North America Performing Art Companies Market Growth Trends & Insights
The North American performing arts market experienced a period of disruption during the COVID-19 pandemic, with significant revenue declines and operational challenges. However, a strong recovery is underway, driven by pent-up demand, renewed interest in live experiences, and innovative adaptations to the digital landscape. The market is projected to exhibit a CAGR of xx% during the forecast period (2025-2033), reaching an estimated value of xx Million by 2033. This growth is being fueled by factors such as increasing disposable incomes, heightened consumer demand for entertainment experiences, and the continuous evolution of digital technologies, providing new avenues for content creation and distribution. Market penetration for digital content and streaming is steadily increasing, supplementing traditional live performances.
- Market Size Evolution: Significant recovery post-pandemic, with sustained growth driven by evolving consumer preferences.
- Adoption Rates: Increased adoption of digital distribution channels for both live and on-demand content.
- Technological Disruptions: VR/AR integration, personalized experiences, and advanced data analytics are transforming the industry.
- Consumer Behavior Shifts: Increased demand for hybrid experiences combining live and digital elements.
Dominant Regions, Countries, or Segments in North America Performing Art Companies Market
The North American performing arts market is largely dominated by its major metropolitan hubs, including New York City, Los Angeles, and Chicago. These cities boast well-established arts infrastructure, a high concentration of world-class venues, and a consistently large and diverse audience base. The presence of numerous established performing arts companies and a robust supporting ecosystem further solidifies their leadership. While these primary markets remain strong, significant growth is also observed in secondary and emerging markets. These areas are experiencing increased investment in arts infrastructure and benefit from proactive local government initiatives aimed at fostering cultural engagement and economic development through the arts. Among the various segments, theatre, encompassing both the iconic Broadway productions and vibrant regional theatre scenes, currently holds the most substantial market share.
- Key Drivers: Robust economic activity within major metropolitan areas, supportive government policies and funding for the arts, and a well-developed and integrated industry infrastructure are critical drivers.
- Dominance Factors: High population density, substantial contributions from tourism revenue, and the existence of a dynamic and deeply rooted arts and culture scene are paramount to market dominance.
- Growth Potential: Expansion into secondary and emerging markets presents significant opportunities. Furthermore, diversification into niche performance genres, the adoption of innovative technologies, and the development of hybrid digital-physical experiences offer considerable growth avenues.
North America Performing Art Companies Market Product Landscape
The North American performing arts market is characterized by an exceptionally diverse and evolving product landscape. This includes a wide array of offerings such as theatrical productions ranging from large-scale musicals to intimate dramas, a vast spectrum of musical concerts spanning classical, jazz, rock, and contemporary genres, captivating dance performances from ballet to contemporary choreography, and the grandeur of opera. Beyond these traditional forms, the market is witnessing significant innovation through the creation of immersive experiences that blur the lines between performer and audience, the strategic integration of cutting-edge technology to enhance storytelling and engagement, and the development of novel storytelling techniques. The success and marketability of individual productions are meticulously measured by key performance indicators including ticket sales, audience engagement levels, and critical acclaim. This dynamic market thrives on a continuous cycle of groundbreaking new creations, faithful revivals of cherished classic works, and innovative adaptations of existing intellectual property, ensuring a perpetually evolving and exciting product offering for audiences.
Key Drivers, Barriers & Challenges in North America Performing Art Companies Market
Key Drivers:
- Increasing disposable incomes driving demand for leisure and entertainment.
- Growing interest in diverse and immersive experiences.
- Technological advancements enhancing audience engagement and access.
Challenges:
- High operational costs associated with production and venue management. This results in increased ticket prices, potentially hindering market accessibility for some segments of the population.
- Intense competition for audience attention and funding from other entertainment options.
- Uncertainties associated with evolving audience preferences and economic factors.
Emerging Opportunities in North America Performing Art Companies Market
- Digital Expansion: Broadening reach and accessibility by developing and leveraging new digital channels and platforms for content delivery, including streaming services, virtual reality experiences, and interactive online performances.
- Immersive & Interactive Experiences: Creating and popularizing highly engaging and interactive live experiences that foster deeper audience participation and memorable connections with the art form.
- Data-Driven Personalization: Harnessing the power of data analytics to gain deeper insights into audience preferences, enabling personalized marketing efforts, tailored content recommendations, and enhanced overall audience experience.
- Cross-Disciplinary Collaborations: Fostering partnerships between performing arts companies and other creative industries (e.g., gaming, technology, film) to develop unique, hybrid art forms and reach new demographics.
- Sustainability Initiatives: Developing and promoting environmentally conscious practices within production and operations, aligning with growing audience demand for corporate social responsibility.
Growth Accelerators in the North America Performing Art Companies Market Industry
Strategic partnerships between performing arts organizations and technology companies are driving significant growth in the industry. This collaboration is resulting in the development of innovative content formats, enhanced audience engagement, and more efficient distribution strategies. Expansion into emerging markets, including smaller cities and regions, presents further opportunities for growth. Investment in arts education and community engagement initiatives is also fostering the development of a more engaged and diverse audience base.
Key Players Shaping the North America Performing Art Companies Market Market
- The Walt Disney Company (Broad entertainment, including theme parks, Broadway productions, and live entertainment)
- Live Nation Entertainment (Live event promoter and venue operator)
- Cirque du Soleil (Acclaimed theatrical entertainment company known for its unique circus-like performances)
- Paramount Global (Media and entertainment conglomerate with interests in live productions and touring)
- Comcast Corporation (Through its NBCUniversal division, involved in entertainment and media, potentially impacting touring and content distribution)
- The Madison Square Garden Company (Owner and operator of iconic venues hosting a wide range of performing arts events)
- Broadway Across America (Leading presenter of Broadway shows on tour across North America)
- The Shubert Organization (Major owner and operator of Broadway theatres)
- The Second City (Renowned improvisational theatre company and comedy club)
- The Metropolitan Opera (One of the world's leading opera companies)
Notable Milestones in North America Performing Art Companies Market Sector
- February 2023: Segerstrom Center for the Arts successfully presented the North American Premiere of Christopher Wheeldon's "Like Water for Chocolate." This event underscored the strong demand for high-quality international productions and significantly boosted local audience engagement, demonstrating the continued appeal of globally recognized artistic achievements.
- November 2022: The Metropolitan Opera announced the renewal of its highly successful "The Met: Live in HD" series through the 2025-2026 season. This extension highlights the enduring viability of live performance, even when delivered through digital distribution, and showcases the effective adaptation of traditional art forms to reach a wider, geographically diverse audience. This success also signifies a strong and lasting partnership between established performance venues and sophisticated digital distribution networks.
- Ongoing Trend: Increased investment and focus on accessibility initiatives by various performing arts organizations, aiming to broaden audience demographics and reduce barriers to attendance through discounted tickets, relaxed performance options, and enhanced sensory experiences.
- Emerging Development: A growing trend of hybrid models, where performances are simultaneously offered in-person and via livestream, catering to diverse audience preferences and expanding market reach in a post-pandemic landscape.
In-Depth North America Performing Art Companies Market Market Outlook
The future of the North American performing arts market appears bright, driven by evolving consumer preferences, technological innovation, and the ongoing recovery from the pandemic. The industry is poised for continued growth through strategic partnerships, audience engagement initiatives, and the exploration of new digital channels. Opportunities exist in personalized experiences, immersive technologies, and expansion into underserved markets. The focus will be on adaptability, innovation, and a continuous evolution of how live performance interacts with modern technology.
North America Performing Art Companies Market Segmentation
-
1. Type of Performing Arts
- 1.1. Theatre
- 1.2. Music and Opera
- 1.3. Dance
- 1.4. Circus and Other Art Forms
-
2. Venue Type
- 2.1. Concert Halls
- 2.2. Theatres
- 2.3. Stadiums
-
3. Ticket Pricing
- 3.1. Premium
- 3.2. Mid-Range
- 3.3. Economy
North America Performing Art Companies Market Segmentation By Geography
-
1. North America
- 1.1. United States
- 1.2. Canada
- 1.3. Mexico
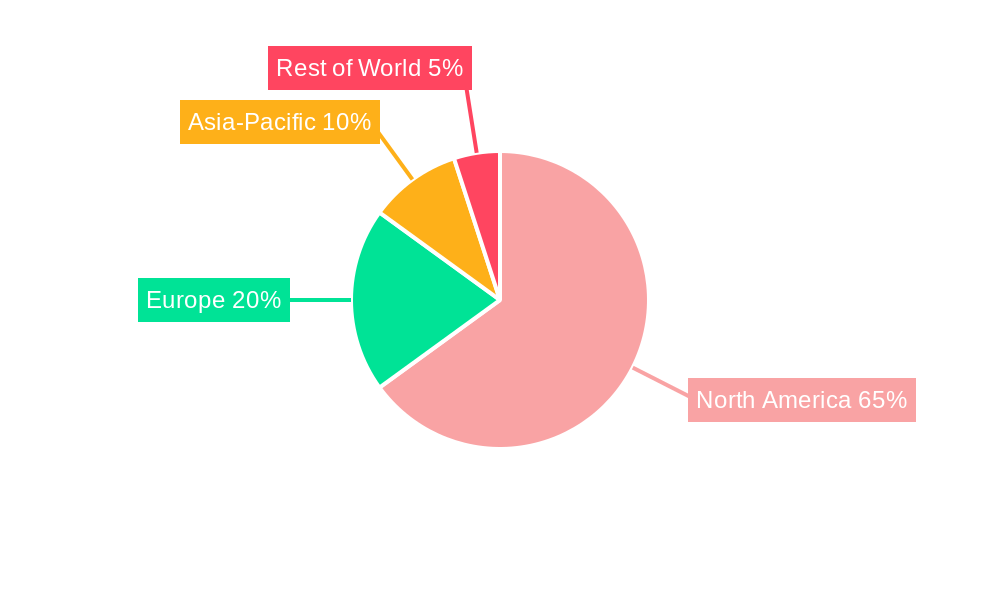
North America Performing Art Companies Market Regional Market Share
Geographic Coverage of North America Performing Art Companies Market
North America Performing Art Companies Market REPORT HIGHLIGHTS
| Aspects | Details |
|---|---|
| Study Period | 2020-2034 |
| Base Year | 2025 |
| Estimated Year | 2026 |
| Forecast Period | 2026-2034 |
| Historical Period | 2020-2025 |
| Growth Rate | CAGR of 5.67% from 2020-2034 |
| Segmentation |
|
Table of Contents
- 1. Introduction
- 1.1. Research Scope
- 1.2. Market Segmentation
- 1.3. Research Objective
- 1.4. Definitions and Assumptions
- 2. Executive Summary
- 2.1. Market Snapshot
- 3. Market Dynamics
- 3.1. Market Drivers
- 3.2. Market Restrains
- 3.3. Market Trends
- 3.4. Market Opportunities
- 4. Market Factor Analysis
- 4.1. Porters Five Forces
- 4.1.1. Bargaining Power of Suppliers
- 4.1.2. Bargaining Power of Buyers
- 4.1.3. Threat of New Entrants
- 4.1.4. Threat of Substitutes
- 4.1.5. Competitive Rivalry
- 4.2. PESTEL analysis
- 4.3. BCG Analysis
- 4.3.1. Stars (High Growth, High Market Share)
- 4.3.2. Cash Cows (Low Growth, High Market Share)
- 4.3.3. Question Mark (High Growth, Low Market Share)
- 4.3.4. Dogs (Low Growth, Low Market Share)
- 4.4. Ansoff Matrix Analysis
- 4.5. Supply Chain Analysis
- 4.6. Regulatory Landscape
- 4.7. Current Market Potential and Opportunity Assessment (TAM–SAM–SOM Framework)
- 4.8. IMR Analyst Note
- 4.1. Porters Five Forces
- 5. Market Analysis, Insights and Forecast 2021-2033
- 5.1. Market Analysis, Insights and Forecast - by Type of Performing Arts
- 5.1.1. Theatre
- 5.1.2. Music and Opera
- 5.1.3. Dance
- 5.1.4. Circus and Other Art Forms
- 5.2. Market Analysis, Insights and Forecast - by Venue Type
- 5.2.1. Concert Halls
- 5.2.2. Theatres
- 5.2.3. Stadiums
- 5.3. Market Analysis, Insights and Forecast - by Ticket Pricing
- 5.3.1. Premium
- 5.3.2. Mid-Range
- 5.3.3. Economy
- 5.4. Market Analysis, Insights and Forecast - by Region
- 5.4.1. North America
- 5.1. Market Analysis, Insights and Forecast - by Type of Performing Arts
- 6. North America Performing Art Companies Market Analysis, Insights and Forecast, 2021-2033
- 6.1. Market Analysis, Insights and Forecast - by Type of Performing Arts
- 6.1.1. Theatre
- 6.1.2. Music and Opera
- 6.1.3. Dance
- 6.1.4. Circus and Other Art Forms
- 6.2. Market Analysis, Insights and Forecast - by Venue Type
- 6.2.1. Concert Halls
- 6.2.2. Theatres
- 6.2.3. Stadiums
- 6.3. Market Analysis, Insights and Forecast - by Ticket Pricing
- 6.3.1. Premium
- 6.3.2. Mid-Range
- 6.3.3. Economy
- 6.1. Market Analysis, Insights and Forecast - by Type of Performing Arts
- 7. Competitive Analysis
- 7.1. Company Profiles
- 7.1.1 The Walt Disney Company
- 7.1.1.1. Company Overview
- 7.1.1.2. Products
- 7.1.1.3. Company Financials
- 7.1.1.4. SWOT Analysis
- 7.1.2 Live Nation Entertainment
- 7.1.2.1. Company Overview
- 7.1.2.2. Products
- 7.1.2.3. Company Financials
- 7.1.2.4. SWOT Analysis
- 7.1.3 Cirque du Soleil
- 7.1.3.1. Company Overview
- 7.1.3.2. Products
- 7.1.3.3. Company Financials
- 7.1.3.4. SWOT Analysis
- 7.1.4 Paramount Global
- 7.1.4.1. Company Overview
- 7.1.4.2. Products
- 7.1.4.3. Company Financials
- 7.1.4.4. SWOT Analysis
- 7.1.5 Comcast Corporation
- 7.1.5.1. Company Overview
- 7.1.5.2. Products
- 7.1.5.3. Company Financials
- 7.1.5.4. SWOT Analysis
- 7.1.6 The Madison Square Garden Company
- 7.1.6.1. Company Overview
- 7.1.6.2. Products
- 7.1.6.3. Company Financials
- 7.1.6.4. SWOT Analysis
- 7.1.7 Broadway Across America
- 7.1.7.1. Company Overview
- 7.1.7.2. Products
- 7.1.7.3. Company Financials
- 7.1.7.4. SWOT Analysis
- 7.1.8 The Shubert Organization
- 7.1.8.1. Company Overview
- 7.1.8.2. Products
- 7.1.8.3. Company Financials
- 7.1.8.4. SWOT Analysis
- 7.1.9 The Second City
- 7.1.9.1. Company Overview
- 7.1.9.2. Products
- 7.1.9.3. Company Financials
- 7.1.9.4. SWOT Analysis
- 7.1.10 The Metropolitan Opera**List Not Exhaustive
- 7.1.10.1. Company Overview
- 7.1.10.2. Products
- 7.1.10.3. Company Financials
- 7.1.10.4. SWOT Analysis
- 7.1.1 The Walt Disney Company
- 7.2. Market Entropy
- 7.2.1 Company's Key Areas Served
- 7.2.2 Recent Developments
- 7.3. Company Market Share Analysis 2025
- 7.3.1 Top 5 Companies Market Share Analysis
- 7.3.2 Top 3 Companies Market Share Analysis
- 7.4. List of Potential Customers
- 8. Research Methodology
List of Figures
- Figure 1: North America Performing Art Companies Market Revenue Breakdown (million, %) by Product 2025 & 2033
- Figure 2: North America Performing Art Companies Market Share (%) by Company 2025
List of Tables
- Table 1: North America Performing Art Companies Market Revenue million Forecast, by Type of Performing Arts 2020 & 2033
- Table 2: North America Performing Art Companies Market Revenue million Forecast, by Venue Type 2020 & 2033
- Table 3: North America Performing Art Companies Market Revenue million Forecast, by Ticket Pricing 2020 & 2033
- Table 4: North America Performing Art Companies Market Revenue million Forecast, by Region 2020 & 2033
- Table 5: North America Performing Art Companies Market Revenue million Forecast, by Type of Performing Arts 2020 & 2033
- Table 6: North America Performing Art Companies Market Revenue million Forecast, by Venue Type 2020 & 2033
- Table 7: North America Performing Art Companies Market Revenue million Forecast, by Ticket Pricing 2020 & 2033
- Table 8: North America Performing Art Companies Market Revenue million Forecast, by Country 2020 & 2033
- Table 9: United States North America Performing Art Companies Market Revenue (million) Forecast, by Application 2020 & 2033
- Table 10: Canada North America Performing Art Companies Market Revenue (million) Forecast, by Application 2020 & 2033
- Table 11: Mexico North America Performing Art Companies Market Revenue (million) Forecast, by Application 2020 & 2033
Frequently Asked Questions
1. What is the projected Compound Annual Growth Rate (CAGR) of the North America Performing Art Companies Market?
The projected CAGR is approximately 5.67%.
2. Which companies are prominent players in the North America Performing Art Companies Market?
Key companies in the market include The Walt Disney Company, Live Nation Entertainment, Cirque du Soleil, Paramount Global, Comcast Corporation, The Madison Square Garden Company, Broadway Across America, The Shubert Organization, The Second City, The Metropolitan Opera**List Not Exhaustive.
3. What are the main segments of the North America Performing Art Companies Market?
The market segments include Type of Performing Arts, Venue Type, Ticket Pricing.
4. Can you provide details about the market size?
The market size is estimated to be USD 193.38 million as of 2022.
5. What are some drivers contributing to market growth?
N/A
6. What are the notable trends driving market growth?
Rise in the Use of Online Platforms.
7. Are there any restraints impacting market growth?
N/A
8. Can you provide examples of recent developments in the market?
February 2023: Costa Mesa, CA Segerstrom Center for the Arts presents the North American Premiere of Christopher Wheeldon's latest ballet, Like Water for Chocolate, from American Ballet Theatre for six performances from Wednesday, March 29 through Sunday, April 2. Center audiences will be the first in the country to experience this magical Mexican love story, with the stellar dancers of ABT translating this richly layered story.
9. What pricing options are available for accessing the report?
Pricing options include single-user, multi-user, and enterprise licenses priced at USD 3800, USD 4500, and USD 5800 respectively.
10. Is the market size provided in terms of value or volume?
The market size is provided in terms of value, measured in million.
11. Are there any specific market keywords associated with the report?
Yes, the market keyword associated with the report is "North America Performing Art Companies Market," which aids in identifying and referencing the specific market segment covered.
12. How do I determine which pricing option suits my needs best?
The pricing options vary based on user requirements and access needs. Individual users may opt for single-user licenses, while businesses requiring broader access may choose multi-user or enterprise licenses for cost-effective access to the report.
13. Are there any additional resources or data provided in the North America Performing Art Companies Market report?
While the report offers comprehensive insights, it's advisable to review the specific contents or supplementary materials provided to ascertain if additional resources or data are available.
14. How can I stay updated on further developments or reports in the North America Performing Art Companies Market?
To stay informed about further developments, trends, and reports in the North America Performing Art Companies Market, consider subscribing to industry newsletters, following relevant companies and organizations, or regularly checking reputable industry news sources and publications.
Methodology
Step 1 - Identification of Relevant Samples Size from Population Database


Step 2 - Approaches for Defining Global Market Size (Value, Volume* & Price*)

Note*: In applicable scenarios
Step 3 - Data Sources
Primary Research
- Web Analytics
- Survey Reports
- Research Institute
- Latest Research Reports
- Opinion Leaders
Secondary Research
- Annual Reports
- White Paper
- Latest Press Release
- Industry Association
- Paid Database
- Investor Presentations

Step 4 - Data Triangulation
Involves using different sources of information in order to increase the validity of a study
These sources are likely to be stakeholders in a program - participants, other researchers, program staff, other community members, and so on.
Then we put all data in single framework & apply various statistical tools to find out the dynamic on the market.
During the analysis stage, feedback from the stakeholder groups would be compared to determine areas of agreement as well as areas of divergence