

Key Insights
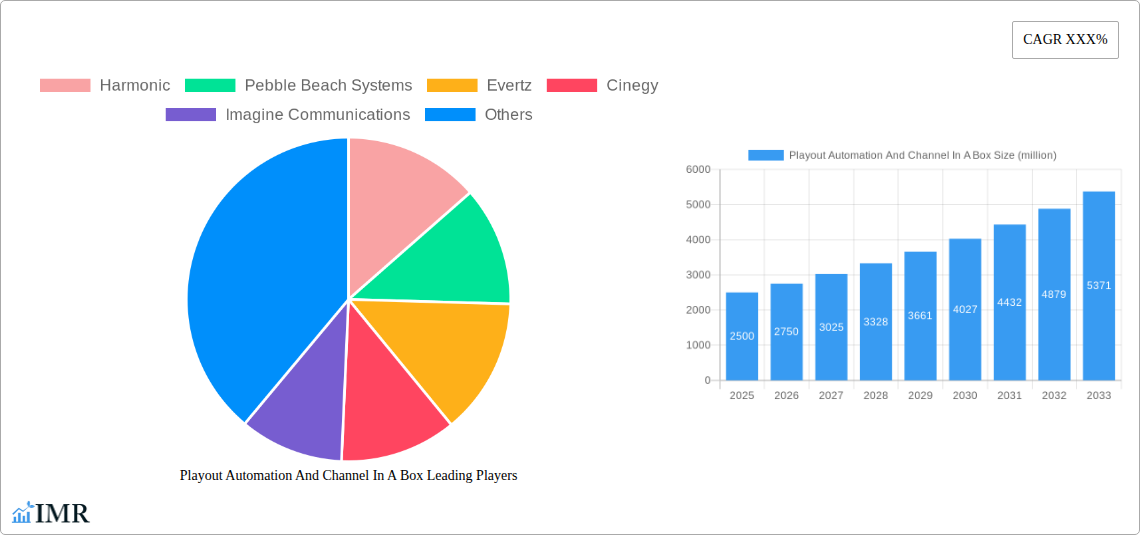
The Playout Automation and Channel-in-a-Box market is experiencing robust growth, driven by the increasing demand for efficient and cost-effective broadcast solutions. The rising adoption of cloud-based technologies and the need for streamlined workflows across various media platforms are key factors propelling this market expansion. From 2019 to 2024, the market demonstrated significant progress, and this positive trajectory is expected to continue throughout the forecast period (2025-2033). The market's expansion is fueled by the increasing adoption of IP-based infrastructure, the growing popularity of over-the-top (OTT) platforms, and the need for broadcasters to improve operational efficiency and reduce capital expenditure. Leading players like Harmonic, Pebble Beach Systems, and Imagine Communications are driving innovation, constantly introducing advanced features and functionalities to enhance their offerings, contributing to the market's overall dynamism.
The segmentation within the Playout Automation and Channel-in-a-Box market reveals diverse opportunities. Software-defined solutions are gaining traction due to their flexibility and scalability. Geographical expansion is also a key trend, with emerging markets showing promising growth potential. However, factors such as the high initial investment cost of implementing new technologies and the complexity of integrating various systems can pose challenges to market growth. Nevertheless, the overall market outlook remains positive, driven by sustained technological innovation and the increasing adoption of efficient broadcast solutions globally. The continued integration of AI and machine learning functionalities within these systems is set to further improve workflow efficiency and enhance content delivery. The market is likely to witness consolidation through mergers and acquisitions, with larger players strategically acquiring smaller companies to expand their market share and product portfolio.
Playout Automation and Channel-in-a-Box Market Report: 2019-2033
This comprehensive report provides a detailed analysis of the Playout Automation and Channel-in-a-Box market, encompassing market dynamics, growth trends, regional dominance, product landscape, key players, and future outlook. The report covers the period from 2019 to 2033, with a base year of 2025 and a forecast period of 2025-2033. The study examines the parent market of broadcast equipment and the child market of automated playout systems, offering granular insights for industry professionals and investors. The market size is predicted to reach xx million by 2033.
Playout Automation And Channel In A Box Market Dynamics & Structure
The Playout Automation and Channel-in-a-Box market is characterized by moderate concentration, with several key players vying for market share. Technological innovation, particularly in cloud-based solutions and AI-powered workflows, is a significant driver. Regulatory frameworks, especially concerning broadcasting standards and security, influence market growth. Competitive substitutes include traditional on-premise playout systems and emerging streaming technologies. The end-user demographic primarily comprises broadcasters, media companies, and content providers of varying sizes. M&A activity has been relatively moderate in recent years, with xx deals recorded between 2019 and 2024.
- Market Concentration: Moderately concentrated, with the top 5 players holding approximately 40% market share (Estimated 2025).
- Technological Innovation: Cloud-based solutions, AI-driven automation, and improved integration with streaming platforms are key drivers.
- Regulatory Frameworks: Compliance with broadcasting standards and data security regulations influences vendor strategies.
- Competitive Substitutes: Traditional on-premise systems and direct-to-consumer streaming platforms present competitive pressure.
- End-User Demographics: Broadcasters (55%), Media Companies (30%), Content Providers (15%) (Estimated 2025).
- M&A Trends: xx M&A deals between 2019 and 2024, signaling consolidation and strategic expansion.
Playout Automation And Channel In A Box Growth Trends & Insights
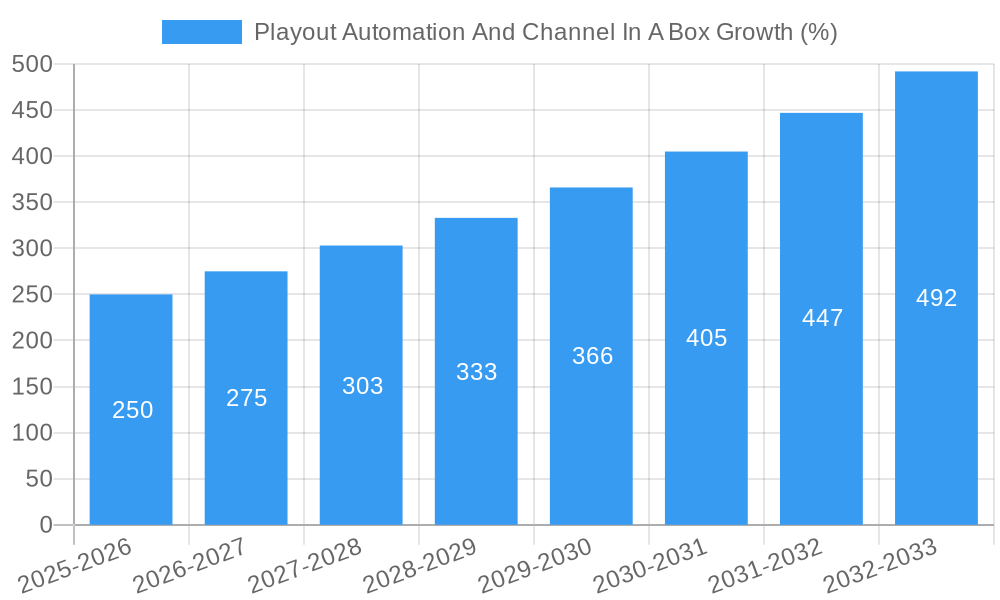
The Playout Automation and Channel-in-a-Box market has witnessed robust growth over the historical period (2019-2024), driven by the increasing adoption of automated workflows, the rise of OTT platforms, and the need for efficient content delivery. The market is projected to maintain a healthy CAGR of xx% during the forecast period (2025-2033), reaching a projected value of xx million by 2033. This growth is fueled by the ongoing shift towards IP-based infrastructures, the increasing demand for high-quality video streaming, and the growing adoption of cloud-based solutions for cost efficiency and scalability. Market penetration is currently estimated at xx%, with significant growth potential in underserved regions. Technological disruptions, particularly the integration of AI and machine learning, are further accelerating market expansion. Consumer behavior shifts, such as increased on-demand consumption and preference for personalized content, contribute to the growing demand for efficient and flexible playout solutions.
Dominant Regions, Countries, or Segments in Playout Automation And Channel In A Box
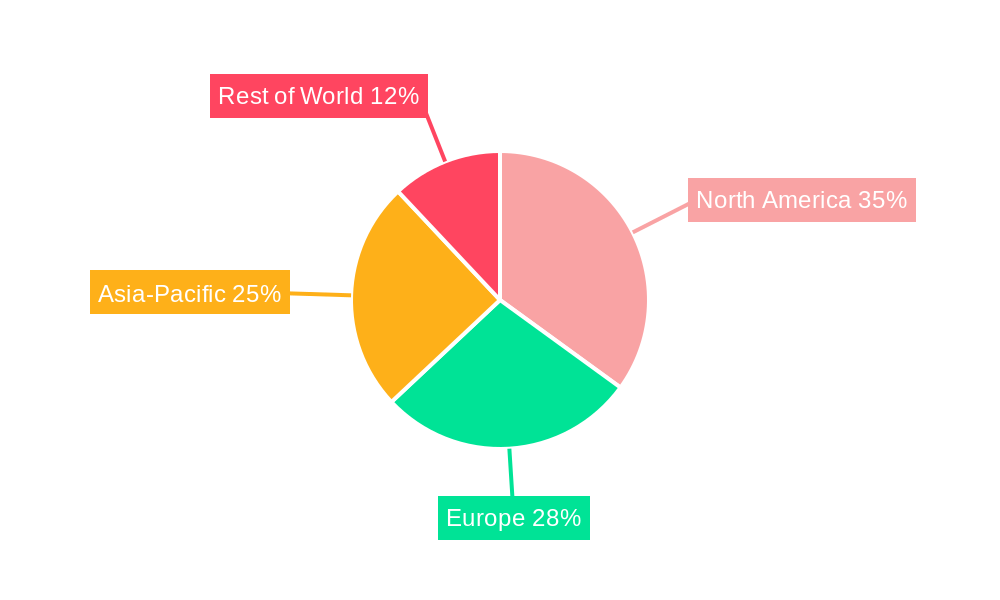
North America currently dominates the Playout Automation and Channel-in-a-Box market, driven by the presence of major broadcasters, media companies, and technology vendors. However, strong growth is expected in the Asia-Pacific region, fueled by increasing investments in media infrastructure and a rising demand for high-quality video content. Within segments, the cloud-based solutions segment exhibits the fastest growth, driven by cost-effectiveness, scalability, and improved accessibility.
- North America: High market maturity, strong technological advancements, and a large base of broadcasters contribute to its leading position.
- Asia-Pacific: Rapid growth potential driven by significant investments in media infrastructure and expanding digital content consumption.
- Europe: A well-established market with steady growth, driven by adoption in both traditional and digital broadcasting sectors.
- Cloud-Based Solutions: Fastest growing segment, driven by cost-efficiency, scalability, and accessibility.
Playout Automation And Channel In A Box Product Landscape
The Playout Automation and Channel-in-a-Box market offers a diverse range of products catering to various needs and budgets. Innovations focus on improving workflow efficiency, enhancing content management capabilities, and integrating with emerging technologies like AI and cloud platforms. Key performance metrics include operational efficiency, scalability, reliability, and integration capabilities. Unique selling propositions often center around ease of use, customizable features, and advanced automation capabilities. Recent advancements include improved AI-powered content scheduling and automated content quality control.
Key Drivers, Barriers & Challenges in Playout Automation And Channel In A Box
Key Drivers:
- Increasing demand for high-quality video content across multiple platforms.
- Growing adoption of IP-based broadcasting infrastructure.
- Need for efficient and cost-effective content delivery solutions.
- Rise of cloud-based solutions for scalability and accessibility.
Challenges & Restraints:
- High initial investment costs for some solutions can be a barrier for smaller broadcasters.
- Complexity of integration with legacy systems can hinder adoption.
- Cybersecurity concerns related to cloud-based solutions need careful consideration.
- Competition from traditional and emerging playout technologies.
Emerging Opportunities in Playout Automation And Channel In A Box
- Expansion into untapped markets in developing economies.
- Integration of AI and machine learning for further automation and efficiency.
- Development of tailored solutions for specific vertical markets (e.g., sports, news).
- Growing demand for personalized content delivery through targeted automation.
Growth Accelerators in the Playout Automation And Channel In A Box Industry
Strategic partnerships between technology vendors and broadcasters are accelerating market growth. Technological breakthroughs such as AI-powered automation are streamlining workflows and reducing operational costs. Market expansion strategies, including geographical expansion and diversification into new segments, are further fueling growth.
Key Players Shaping the Playout Automation And Channel In A Box Market
- Harmonic
- Pebble Beach Systems
- Evertz
- Cinegy
- Imagine Communications
- Grass Valley Canada
- PlayBox Technology (UK)
- Pixel Power
- Florical systems
- Hardata
- BroadStream Solutions
- Axel Technology
- Aveco
- Anyware Video company
- wTVision Solutions
- PlayBox Neo
- SkyLark Technology
- AQ BROADCAST
Notable Milestones in Playout Automation And Channel In A Box Sector
- 2020: Several major vendors launch cloud-based playout solutions.
- 2021: Increased adoption of AI-powered automation features in playout systems.
- 2022: Significant M&A activity in the market, leading to consolidation.
- 2023: Focus on improving integration with streaming platforms and OTT services.
- 2024: Growing demand for solutions supporting immersive video technologies.
In-Depth Playout Automation And Channel In A Box Market Outlook
The Playout Automation and Channel-in-a-Box market is poised for continued strong growth, driven by technological advancements, increasing demand for efficient content delivery, and the expansion into new markets. Strategic partnerships, investments in R&D, and a focus on innovative solutions will further shape the market landscape. The forecast period presents substantial opportunities for vendors to capitalize on the ongoing digital transformation of the broadcasting and media industries.
Playout Automation And Channel In A Box Segmentation
-
1. Application
- 1.1. Entertainment
- 1.2. News
- 1.3. Sports
- 1.4. Others
-
2. Type
- 2.1. Single Channel
- 2.2. Multiple Channel
Playout Automation And Channel In A Box Segmentation By Geography
-
1. North America
- 1.1. United States
- 1.2. Canada
- 1.3. Mexico
-
2. South America
- 2.1. Brazil
- 2.2. Argentina
- 2.3. Rest of South America
-
3. Europe
- 3.1. United Kingdom
- 3.2. Germany
- 3.3. France
- 3.4. Italy
- 3.5. Spain
- 3.6. Russia
- 3.7. Benelux
- 3.8. Nordics
- 3.9. Rest of Europe
-
4. Middle East & Africa
- 4.1. Turkey
- 4.2. Israel
- 4.3. GCC
- 4.4. North Africa
- 4.5. South Africa
- 4.6. Rest of Middle East & Africa
-
5. Asia Pacific
- 5.1. China
- 5.2. India
- 5.3. Japan
- 5.4. South Korea
- 5.5. ASEAN
- 5.6. Oceania
- 5.7. Rest of Asia Pacific
Playout Automation And Channel In A Box REPORT HIGHLIGHTS
| Aspects | Details |
|---|---|
| Study Period | 2019-2033 |
| Base Year | 2024 |
| Estimated Year | 2025 |
| Forecast Period | 2025-2033 |
| Historical Period | 2019-2024 |
| Growth Rate | CAGR of XXX% from 2019-2033 |
| Segmentation |
|
Table of Contents
- 1. Introduction
- 1.1. Research Scope
- 1.2. Market Segmentation
- 1.3. Research Methodology
- 1.4. Definitions and Assumptions
- 2. Executive Summary
- 2.1. Introduction
- 3. Market Dynamics
- 3.1. Introduction
- 3.2. Market Drivers
- 3.3. Market Restrains
- 3.4. Market Trends
- 4. Market Factor Analysis
- 4.1. Porters Five Forces
- 4.2. Supply/Value Chain
- 4.3. PESTEL analysis
- 4.4. Market Entropy
- 4.5. Patent/Trademark Analysis
- 5. Global Playout Automation And Channel In A Box Analysis, Insights and Forecast, 2019-2031
- 5.1. Market Analysis, Insights and Forecast - by Application
- 5.1.1. Entertainment
- 5.1.2. News
- 5.1.3. Sports
- 5.1.4. Others
- 5.2. Market Analysis, Insights and Forecast - by Type
- 5.2.1. Single Channel
- 5.2.2. Multiple Channel
- 5.3. Market Analysis, Insights and Forecast - by Region
- 5.3.1. North America
- 5.3.2. South America
- 5.3.3. Europe
- 5.3.4. Middle East & Africa
- 5.3.5. Asia Pacific
- 5.1. Market Analysis, Insights and Forecast - by Application
- 6. North America Playout Automation And Channel In A Box Analysis, Insights and Forecast, 2019-2031
- 6.1. Market Analysis, Insights and Forecast - by Application
- 6.1.1. Entertainment
- 6.1.2. News
- 6.1.3. Sports
- 6.1.4. Others
- 6.2. Market Analysis, Insights and Forecast - by Type
- 6.2.1. Single Channel
- 6.2.2. Multiple Channel
- 6.1. Market Analysis, Insights and Forecast - by Application
- 7. South America Playout Automation And Channel In A Box Analysis, Insights and Forecast, 2019-2031
- 7.1. Market Analysis, Insights and Forecast - by Application
- 7.1.1. Entertainment
- 7.1.2. News
- 7.1.3. Sports
- 7.1.4. Others
- 7.2. Market Analysis, Insights and Forecast - by Type
- 7.2.1. Single Channel
- 7.2.2. Multiple Channel
- 7.1. Market Analysis, Insights and Forecast - by Application
- 8. Europe Playout Automation And Channel In A Box Analysis, Insights and Forecast, 2019-2031
- 8.1. Market Analysis, Insights and Forecast - by Application
- 8.1.1. Entertainment
- 8.1.2. News
- 8.1.3. Sports
- 8.1.4. Others
- 8.2. Market Analysis, Insights and Forecast - by Type
- 8.2.1. Single Channel
- 8.2.2. Multiple Channel
- 8.1. Market Analysis, Insights and Forecast - by Application
- 9. Middle East & Africa Playout Automation And Channel In A Box Analysis, Insights and Forecast, 2019-2031
- 9.1. Market Analysis, Insights and Forecast - by Application
- 9.1.1. Entertainment
- 9.1.2. News
- 9.1.3. Sports
- 9.1.4. Others
- 9.2. Market Analysis, Insights and Forecast - by Type
- 9.2.1. Single Channel
- 9.2.2. Multiple Channel
- 9.1. Market Analysis, Insights and Forecast - by Application
- 10. Asia Pacific Playout Automation And Channel In A Box Analysis, Insights and Forecast, 2019-2031
- 10.1. Market Analysis, Insights and Forecast - by Application
- 10.1.1. Entertainment
- 10.1.2. News
- 10.1.3. Sports
- 10.1.4. Others
- 10.2. Market Analysis, Insights and Forecast - by Type
- 10.2.1. Single Channel
- 10.2.2. Multiple Channel
- 10.1. Market Analysis, Insights and Forecast - by Application
- 11. Competitive Analysis
- 11.1. Global Market Share Analysis 2024
- 11.2. Company Profiles
- 11.2.1 Harmonic
- 11.2.1.1. Overview
- 11.2.1.2. Products
- 11.2.1.3. SWOT Analysis
- 11.2.1.4. Recent Developments
- 11.2.1.5. Financials (Based on Availability)
- 11.2.2 Pebble Beach Systems
- 11.2.2.1. Overview
- 11.2.2.2. Products
- 11.2.2.3. SWOT Analysis
- 11.2.2.4. Recent Developments
- 11.2.2.5. Financials (Based on Availability)
- 11.2.3 Evertz
- 11.2.3.1. Overview
- 11.2.3.2. Products
- 11.2.3.3. SWOT Analysis
- 11.2.3.4. Recent Developments
- 11.2.3.5. Financials (Based on Availability)
- 11.2.4 Cinegy
- 11.2.4.1. Overview
- 11.2.4.2. Products
- 11.2.4.3. SWOT Analysis
- 11.2.4.4. Recent Developments
- 11.2.4.5. Financials (Based on Availability)
- 11.2.5 Imagine Communications
- 11.2.5.1. Overview
- 11.2.5.2. Products
- 11.2.5.3. SWOT Analysis
- 11.2.5.4. Recent Developments
- 11.2.5.5. Financials (Based on Availability)
- 11.2.6 Grass Valley Canada
- 11.2.6.1. Overview
- 11.2.6.2. Products
- 11.2.6.3. SWOT Analysis
- 11.2.6.4. Recent Developments
- 11.2.6.5. Financials (Based on Availability)
- 11.2.7 PlayBox Technology (UK)
- 11.2.7.1. Overview
- 11.2.7.2. Products
- 11.2.7.3. SWOT Analysis
- 11.2.7.4. Recent Developments
- 11.2.7.5. Financials (Based on Availability)
- 11.2.8 Pixel Power
- 11.2.8.1. Overview
- 11.2.8.2. Products
- 11.2.8.3. SWOT Analysis
- 11.2.8.4. Recent Developments
- 11.2.8.5. Financials (Based on Availability)
- 11.2.9 florical systems
- 11.2.9.1. Overview
- 11.2.9.2. Products
- 11.2.9.3. SWOT Analysis
- 11.2.9.4. Recent Developments
- 11.2.9.5. Financials (Based on Availability)
- 11.2.10 Hardata
- 11.2.10.1. Overview
- 11.2.10.2. Products
- 11.2.10.3. SWOT Analysis
- 11.2.10.4. Recent Developments
- 11.2.10.5. Financials (Based on Availability)
- 11.2.11 BroadStream Solutions
- 11.2.11.1. Overview
- 11.2.11.2. Products
- 11.2.11.3. SWOT Analysis
- 11.2.11.4. Recent Developments
- 11.2.11.5. Financials (Based on Availability)
- 11.2.12 Axel Technology
- 11.2.12.1. Overview
- 11.2.12.2. Products
- 11.2.12.3. SWOT Analysis
- 11.2.12.4. Recent Developments
- 11.2.12.5. Financials (Based on Availability)
- 11.2.13 Aveco
- 11.2.13.1. Overview
- 11.2.13.2. Products
- 11.2.13.3. SWOT Analysis
- 11.2.13.4. Recent Developments
- 11.2.13.5. Financials (Based on Availability)
- 11.2.14 Anyware Video company
- 11.2.14.1. Overview
- 11.2.14.2. Products
- 11.2.14.3. SWOT Analysis
- 11.2.14.4. Recent Developments
- 11.2.14.5. Financials (Based on Availability)
- 11.2.15 wTVision Solutions
- 11.2.15.1. Overview
- 11.2.15.2. Products
- 11.2.15.3. SWOT Analysis
- 11.2.15.4. Recent Developments
- 11.2.15.5. Financials (Based on Availability)
- 11.2.16 PlayBox Neo
- 11.2.16.1. Overview
- 11.2.16.2. Products
- 11.2.16.3. SWOT Analysis
- 11.2.16.4. Recent Developments
- 11.2.16.5. Financials (Based on Availability)
- 11.2.17 SkyLark Technology
- 11.2.17.1. Overview
- 11.2.17.2. Products
- 11.2.17.3. SWOT Analysis
- 11.2.17.4. Recent Developments
- 11.2.17.5. Financials (Based on Availability)
- 11.2.18 AQ BROADCAST
- 11.2.18.1. Overview
- 11.2.18.2. Products
- 11.2.18.3. SWOT Analysis
- 11.2.18.4. Recent Developments
- 11.2.18.5. Financials (Based on Availability)
- 11.2.1 Harmonic
List of Figures
- Figure 1: Global Playout Automation And Channel In A Box Revenue Breakdown (million, %) by Region 2024 & 2032
- Figure 2: North America Playout Automation And Channel In A Box Revenue (million), by Application 2024 & 2032
- Figure 3: North America Playout Automation And Channel In A Box Revenue Share (%), by Application 2024 & 2032
- Figure 4: North America Playout Automation And Channel In A Box Revenue (million), by Type 2024 & 2032
- Figure 5: North America Playout Automation And Channel In A Box Revenue Share (%), by Type 2024 & 2032
- Figure 6: North America Playout Automation And Channel In A Box Revenue (million), by Country 2024 & 2032
- Figure 7: North America Playout Automation And Channel In A Box Revenue Share (%), by Country 2024 & 2032
- Figure 8: South America Playout Automation And Channel In A Box Revenue (million), by Application 2024 & 2032
- Figure 9: South America Playout Automation And Channel In A Box Revenue Share (%), by Application 2024 & 2032
- Figure 10: South America Playout Automation And Channel In A Box Revenue (million), by Type 2024 & 2032
- Figure 11: South America Playout Automation And Channel In A Box Revenue Share (%), by Type 2024 & 2032
- Figure 12: South America Playout Automation And Channel In A Box Revenue (million), by Country 2024 & 2032
- Figure 13: South America Playout Automation And Channel In A Box Revenue Share (%), by Country 2024 & 2032
- Figure 14: Europe Playout Automation And Channel In A Box Revenue (million), by Application 2024 & 2032
- Figure 15: Europe Playout Automation And Channel In A Box Revenue Share (%), by Application 2024 & 2032
- Figure 16: Europe Playout Automation And Channel In A Box Revenue (million), by Type 2024 & 2032
- Figure 17: Europe Playout Automation And Channel In A Box Revenue Share (%), by Type 2024 & 2032
- Figure 18: Europe Playout Automation And Channel In A Box Revenue (million), by Country 2024 & 2032
- Figure 19: Europe Playout Automation And Channel In A Box Revenue Share (%), by Country 2024 & 2032
- Figure 20: Middle East & Africa Playout Automation And Channel In A Box Revenue (million), by Application 2024 & 2032
- Figure 21: Middle East & Africa Playout Automation And Channel In A Box Revenue Share (%), by Application 2024 & 2032
- Figure 22: Middle East & Africa Playout Automation And Channel In A Box Revenue (million), by Type 2024 & 2032
- Figure 23: Middle East & Africa Playout Automation And Channel In A Box Revenue Share (%), by Type 2024 & 2032
- Figure 24: Middle East & Africa Playout Automation And Channel In A Box Revenue (million), by Country 2024 & 2032
- Figure 25: Middle East & Africa Playout Automation And Channel In A Box Revenue Share (%), by Country 2024 & 2032
- Figure 26: Asia Pacific Playout Automation And Channel In A Box Revenue (million), by Application 2024 & 2032
- Figure 27: Asia Pacific Playout Automation And Channel In A Box Revenue Share (%), by Application 2024 & 2032
- Figure 28: Asia Pacific Playout Automation And Channel In A Box Revenue (million), by Type 2024 & 2032
- Figure 29: Asia Pacific Playout Automation And Channel In A Box Revenue Share (%), by Type 2024 & 2032
- Figure 30: Asia Pacific Playout Automation And Channel In A Box Revenue (million), by Country 2024 & 2032
- Figure 31: Asia Pacific Playout Automation And Channel In A Box Revenue Share (%), by Country 2024 & 2032
List of Tables
- Table 1: Global Playout Automation And Channel In A Box Revenue million Forecast, by Region 2019 & 2032
- Table 2: Global Playout Automation And Channel In A Box Revenue million Forecast, by Application 2019 & 2032
- Table 3: Global Playout Automation And Channel In A Box Revenue million Forecast, by Type 2019 & 2032
- Table 4: Global Playout Automation And Channel In A Box Revenue million Forecast, by Region 2019 & 2032
- Table 5: Global Playout Automation And Channel In A Box Revenue million Forecast, by Application 2019 & 2032
- Table 6: Global Playout Automation And Channel In A Box Revenue million Forecast, by Type 2019 & 2032
- Table 7: Global Playout Automation And Channel In A Box Revenue million Forecast, by Country 2019 & 2032
- Table 8: United States Playout Automation And Channel In A Box Revenue (million) Forecast, by Application 2019 & 2032
- Table 9: Canada Playout Automation And Channel In A Box Revenue (million) Forecast, by Application 2019 & 2032
- Table 10: Mexico Playout Automation And Channel In A Box Revenue (million) Forecast, by Application 2019 & 2032
- Table 11: Global Playout Automation And Channel In A Box Revenue million Forecast, by Application 2019 & 2032
- Table 12: Global Playout Automation And Channel In A Box Revenue million Forecast, by Type 2019 & 2032
- Table 13: Global Playout Automation And Channel In A Box Revenue million Forecast, by Country 2019 & 2032
- Table 14: Brazil Playout Automation And Channel In A Box Revenue (million) Forecast, by Application 2019 & 2032
- Table 15: Argentina Playout Automation And Channel In A Box Revenue (million) Forecast, by Application 2019 & 2032
- Table 16: Rest of South America Playout Automation And Channel In A Box Revenue (million) Forecast, by Application 2019 & 2032
- Table 17: Global Playout Automation And Channel In A Box Revenue million Forecast, by Application 2019 & 2032
- Table 18: Global Playout Automation And Channel In A Box Revenue million Forecast, by Type 2019 & 2032
- Table 19: Global Playout Automation And Channel In A Box Revenue million Forecast, by Country 2019 & 2032
- Table 20: United Kingdom Playout Automation And Channel In A Box Revenue (million) Forecast, by Application 2019 & 2032
- Table 21: Germany Playout Automation And Channel In A Box Revenue (million) Forecast, by Application 2019 & 2032
- Table 22: France Playout Automation And Channel In A Box Revenue (million) Forecast, by Application 2019 & 2032
- Table 23: Italy Playout Automation And Channel In A Box Revenue (million) Forecast, by Application 2019 & 2032
- Table 24: Spain Playout Automation And Channel In A Box Revenue (million) Forecast, by Application 2019 & 2032
- Table 25: Russia Playout Automation And Channel In A Box Revenue (million) Forecast, by Application 2019 & 2032
- Table 26: Benelux Playout Automation And Channel In A Box Revenue (million) Forecast, by Application 2019 & 2032
- Table 27: Nordics Playout Automation And Channel In A Box Revenue (million) Forecast, by Application 2019 & 2032
- Table 28: Rest of Europe Playout Automation And Channel In A Box Revenue (million) Forecast, by Application 2019 & 2032
- Table 29: Global Playout Automation And Channel In A Box Revenue million Forecast, by Application 2019 & 2032
- Table 30: Global Playout Automation And Channel In A Box Revenue million Forecast, by Type 2019 & 2032
- Table 31: Global Playout Automation And Channel In A Box Revenue million Forecast, by Country 2019 & 2032
- Table 32: Turkey Playout Automation And Channel In A Box Revenue (million) Forecast, by Application 2019 & 2032
- Table 33: Israel Playout Automation And Channel In A Box Revenue (million) Forecast, by Application 2019 & 2032
- Table 34: GCC Playout Automation And Channel In A Box Revenue (million) Forecast, by Application 2019 & 2032
- Table 35: North Africa Playout Automation And Channel In A Box Revenue (million) Forecast, by Application 2019 & 2032
- Table 36: South Africa Playout Automation And Channel In A Box Revenue (million) Forecast, by Application 2019 & 2032
- Table 37: Rest of Middle East & Africa Playout Automation And Channel In A Box Revenue (million) Forecast, by Application 2019 & 2032
- Table 38: Global Playout Automation And Channel In A Box Revenue million Forecast, by Application 2019 & 2032
- Table 39: Global Playout Automation And Channel In A Box Revenue million Forecast, by Type 2019 & 2032
- Table 40: Global Playout Automation And Channel In A Box Revenue million Forecast, by Country 2019 & 2032
- Table 41: China Playout Automation And Channel In A Box Revenue (million) Forecast, by Application 2019 & 2032
- Table 42: India Playout Automation And Channel In A Box Revenue (million) Forecast, by Application 2019 & 2032
- Table 43: Japan Playout Automation And Channel In A Box Revenue (million) Forecast, by Application 2019 & 2032
- Table 44: South Korea Playout Automation And Channel In A Box Revenue (million) Forecast, by Application 2019 & 2032
- Table 45: ASEAN Playout Automation And Channel In A Box Revenue (million) Forecast, by Application 2019 & 2032
- Table 46: Oceania Playout Automation And Channel In A Box Revenue (million) Forecast, by Application 2019 & 2032
- Table 47: Rest of Asia Pacific Playout Automation And Channel In A Box Revenue (million) Forecast, by Application 2019 & 2032
Frequently Asked Questions
1. What is the projected Compound Annual Growth Rate (CAGR) of the Playout Automation And Channel In A Box?
The projected CAGR is approximately XXX%.
2. Which companies are prominent players in the Playout Automation And Channel In A Box?
Key companies in the market include Harmonic, Pebble Beach Systems, Evertz, Cinegy, Imagine Communications, Grass Valley Canada, PlayBox Technology (UK), Pixel Power, florical systems, Hardata, BroadStream Solutions, Axel Technology, Aveco, Anyware Video company, wTVision Solutions, PlayBox Neo, SkyLark Technology, AQ BROADCAST.
3. What are the main segments of the Playout Automation And Channel In A Box?
The market segments include Application, Type.
4. Can you provide details about the market size?
The market size is estimated to be USD XXX million as of 2022.
5. What are some drivers contributing to market growth?
N/A
6. What are the notable trends driving market growth?
N/A
7. Are there any restraints impacting market growth?
N/A
8. Can you provide examples of recent developments in the market?
N/A
9. What pricing options are available for accessing the report?
Pricing options include single-user, multi-user, and enterprise licenses priced at USD 4250.00, USD 6375.00, and USD 8500.00 respectively.
10. Is the market size provided in terms of value or volume?
The market size is provided in terms of value, measured in million.
11. Are there any specific market keywords associated with the report?
Yes, the market keyword associated with the report is "Playout Automation And Channel In A Box," which aids in identifying and referencing the specific market segment covered.
12. How do I determine which pricing option suits my needs best?
The pricing options vary based on user requirements and access needs. Individual users may opt for single-user licenses, while businesses requiring broader access may choose multi-user or enterprise licenses for cost-effective access to the report.
13. Are there any additional resources or data provided in the Playout Automation And Channel In A Box report?
While the report offers comprehensive insights, it's advisable to review the specific contents or supplementary materials provided to ascertain if additional resources or data are available.
14. How can I stay updated on further developments or reports in the Playout Automation And Channel In A Box?
To stay informed about further developments, trends, and reports in the Playout Automation And Channel In A Box, consider subscribing to industry newsletters, following relevant companies and organizations, or regularly checking reputable industry news sources and publications.
Methodology
Step 1 - Identification of Relevant Samples Size from Population Database


Step 2 - Approaches for Defining Global Market Size (Value, Volume* & Price*)

Note*: In applicable scenarios
Step 3 - Data Sources
Primary Research
- Web Analytics
- Survey Reports
- Research Institute
- Latest Research Reports
- Opinion Leaders
Secondary Research
- Annual Reports
- White Paper
- Latest Press Release
- Industry Association
- Paid Database
- Investor Presentations

Step 4 - Data Triangulation
Involves using different sources of information in order to increase the validity of a study
These sources are likely to be stakeholders in a program - participants, other researchers, program staff, other community members, and so on.
Then we put all data in single framework & apply various statistical tools to find out the dynamic on the market.
During the analysis stage, feedback from the stakeholder groups would be compared to determine areas of agreement as well as areas of divergence
