

Key Insights
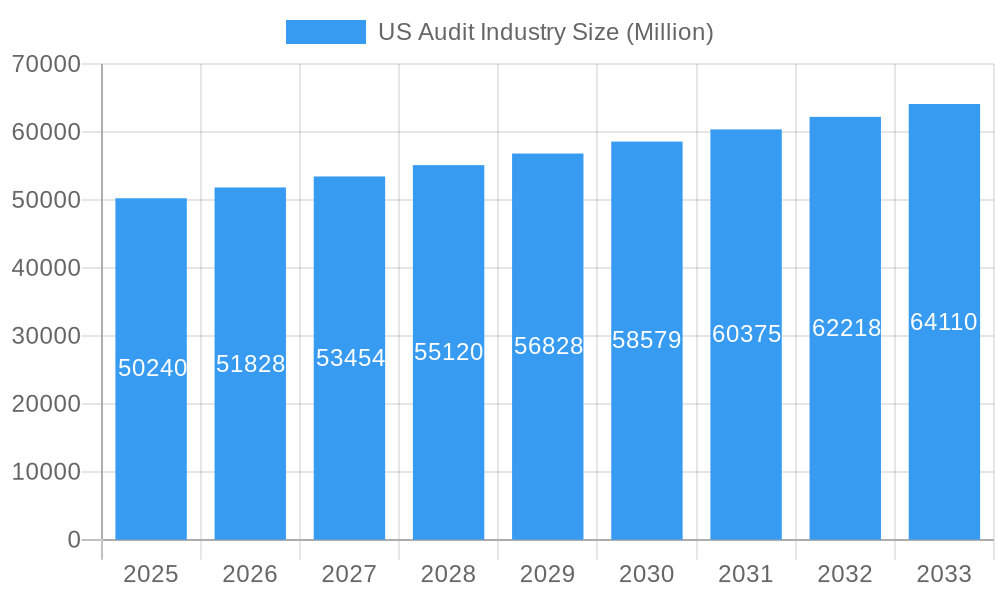
The US audit industry, a cornerstone of financial transparency and regulatory compliance, boasts a substantial market size, estimated at $50.24 billion in 2025. This sector demonstrates consistent growth, exhibiting a Compound Annual Growth Rate (CAGR) of 3.27% from 2019 to 2033. Several factors fuel this expansion. Increased regulatory scrutiny following prominent financial scandals necessitates rigorous auditing practices, driving demand for services from leading firms like Deloitte, EY, KPMG, PwC, and others. The burgeoning complexity of financial reporting, particularly for publicly traded companies and multinational corporations, also contributes significantly. Technological advancements, such as AI-driven audit tools and data analytics platforms, are transforming the industry, enabling more efficient and insightful audits, further bolstering growth. However, the industry faces challenges. Pricing pressures from clients seeking cost-effective solutions and competition from smaller, specialized firms pose ongoing challenges. Furthermore, the increasing prevalence of cybersecurity threats and the need for robust data protection measures add to operational complexities and costs.
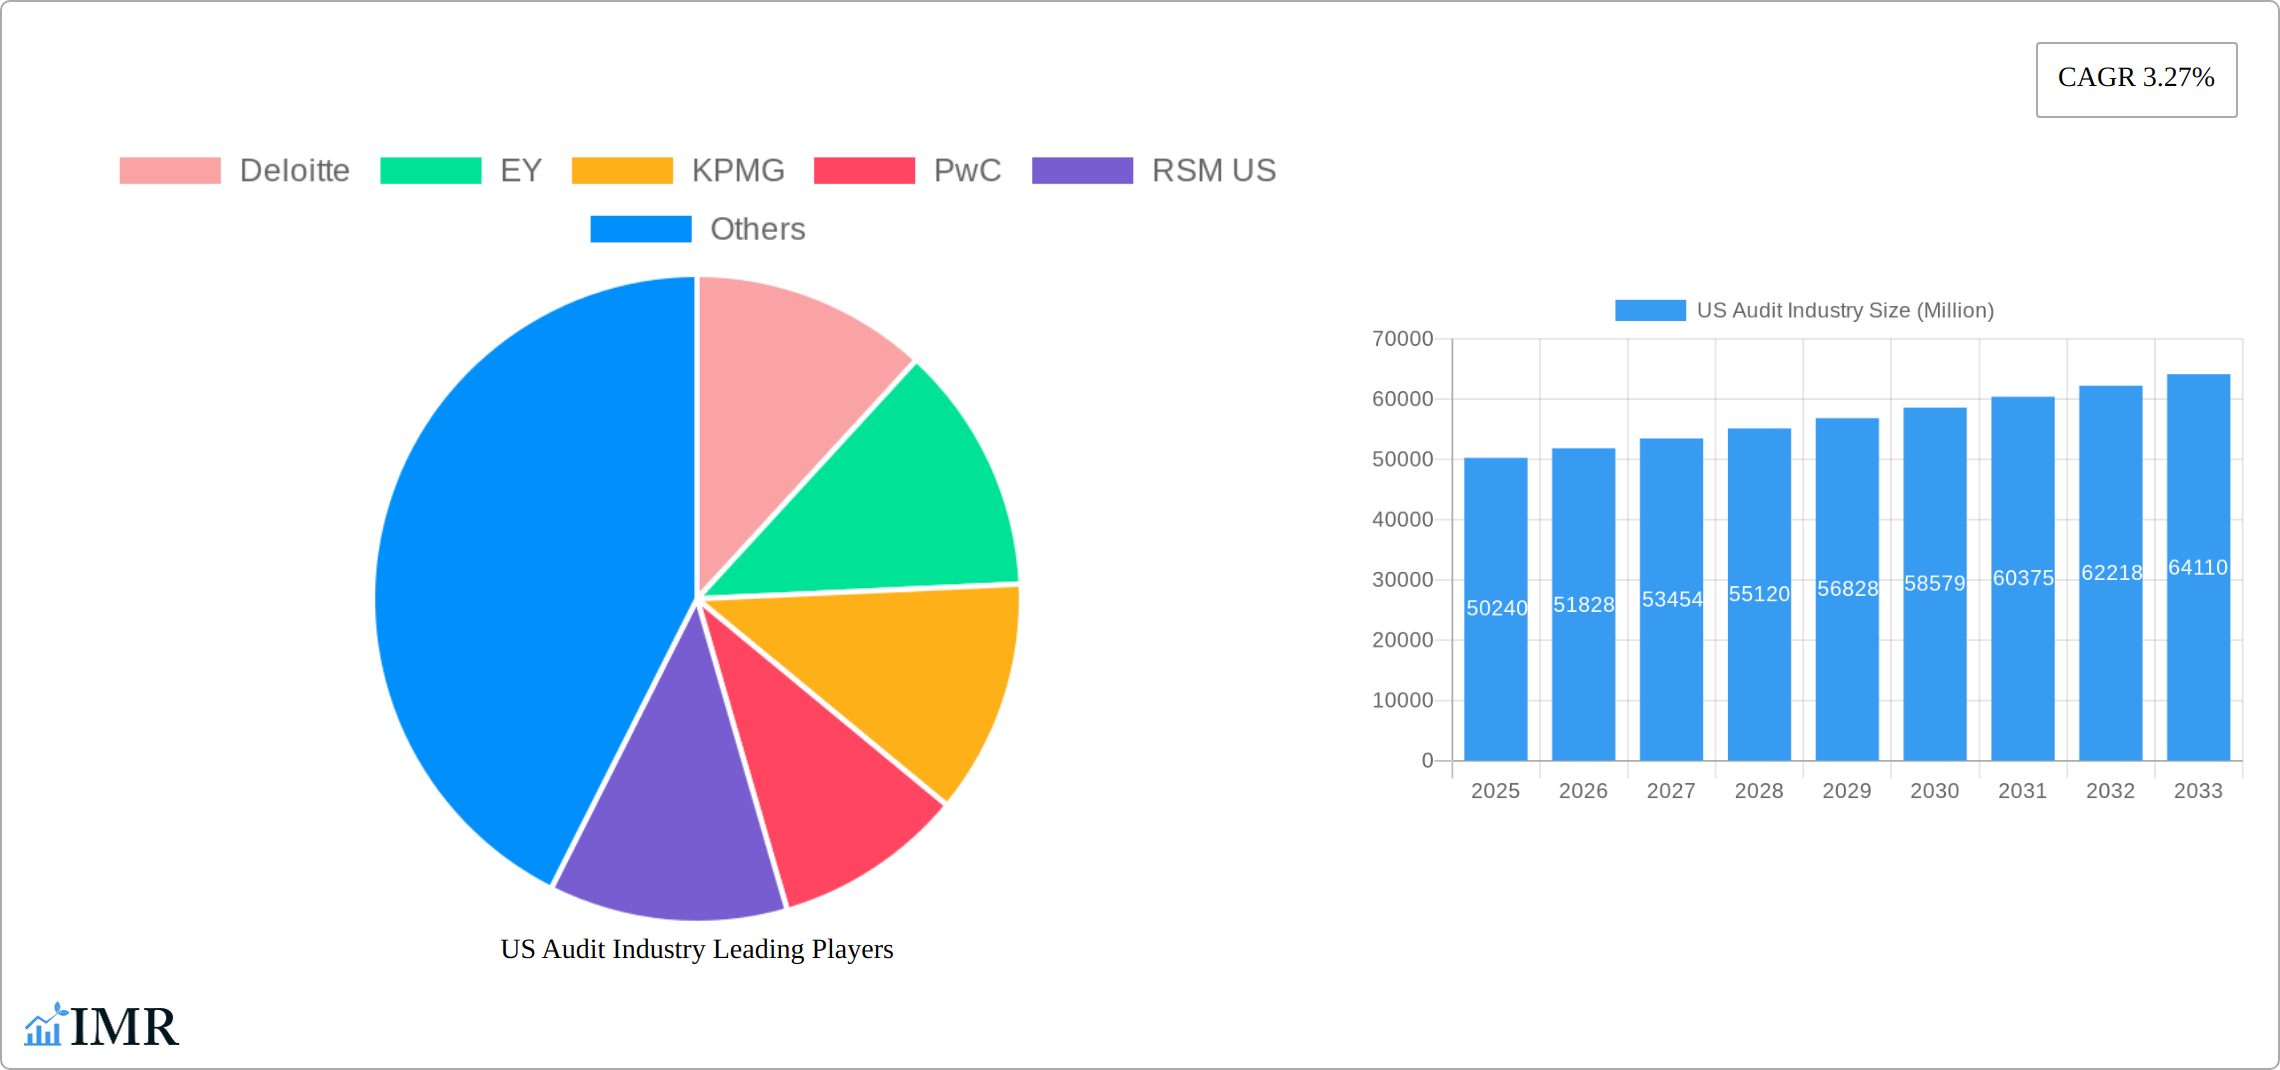
US Audit Industry Market Size (In Billion)
The forecast period (2025-2033) anticipates continued growth, driven by the factors mentioned above. While precise segmentation data is unavailable, it's reasonable to expect significant contributions from segments focused on publicly traded companies, financial institutions, and government entities. Regional variations are likely, with major metropolitan areas and financial hubs experiencing higher concentration of audit activity. The continued dominance of the "Big Four" accounting firms (Deloitte, EY, KPMG, PwC) is expected, although smaller firms like RSM US, Grant Thornton LLP, and others will likely continue to compete effectively in niche markets or specific industry verticals. The overall outlook remains positive, with the industry poised for moderate but sustained growth over the next decade, fueled by evolving regulatory landscapes and the enduring need for robust financial oversight.
US Audit Industry Company Market Share
This comprehensive report provides a detailed analysis of the US Audit Industry, encompassing market dynamics, growth trends, competitive landscape, and future outlook. With a focus on the parent market (Professional Services) and child market (Financial Auditing), this report is essential for industry professionals, investors, and strategic planners seeking actionable insights. The study period covers 2019-2033, with 2025 as the base year and forecast period extending to 2033. The historical period analyzed is 2019-2024. Market values are presented in millions of USD.
US Audit Industry Market Dynamics & Structure
The US audit industry is characterized by high market concentration, with the "Big Four" firms (Deloitte, EY, KPMG, and PwC) holding a significant majority of the market share, estimated at xx% in 2025. However, mid-tier firms like RSM US, Grant Thornton LLP, BDO USA, and Crowe Horwath are actively competing for market share, particularly in niche segments. The industry is undergoing significant transformation driven by technological innovation, including the increasing adoption of AI and data analytics. Regulatory frameworks like the Sarbanes-Oxley Act (SOX) and Public Company Accounting Oversight Board (PCAOB) standards heavily influence the industry's operations and compliance requirements.
- Market Concentration: Big Four firms dominate, holding an estimated xx% market share in 2025. Mid-tier firms are competing for remaining share.
- Technological Innovation: AI, data analytics, and blockchain are transforming audit processes and increasing efficiency. However, high initial investment costs present a barrier for smaller firms.
- Regulatory Framework: SOX and PCAOB standards create stringent compliance requirements, impacting operational costs and strategies.
- Competitive Landscape: Intense competition exists among Big Four and mid-tier firms, fueled by pricing pressures and client acquisition. M&A activity is moderate, with xx deals recorded in 2024.
- End-User Demographics: The industry primarily serves publicly traded companies, large private enterprises, and government entities. Demand is influenced by economic conditions and regulatory changes.
- M&A Trends: Consolidation is expected to continue, with larger firms acquiring smaller ones to expand their service offerings and geographic reach.
US Audit Industry Growth Trends & Insights
The US audit industry is on a robust growth trajectory, having experienced a significant Compound Annual Growth Rate (CAGR) of approximately XX% during the historical period (2019-2024). Market projections indicate continued expansion, with the industry size anticipated to reach $XX million in 2025 and further ascend to $XX million by 2033, demonstrating a projected CAGR of XX% throughout the forecast period (2025-2033).
This upward trend is primarily propelled by several key factors:
- Heightened Regulatory Scrutiny: An increasingly stringent and evolving regulatory landscape necessitates more comprehensive and rigorous audit practices.
- Growing Business Complexity: The intricate nature of modern business operations, supply chains, and financial instruments demands sophisticated assurance services.
- Demand for Emerging Technology Assurance: As organizations rapidly adopt and integrate new technologies, the need for assurance on their security, reliability, and compliance is paramount.
- Technological Advancements: The transformative impact of Artificial Intelligence (AI) and cloud-based solutions is accelerating adoption rates, enhancing audit efficiency, improving data analysis capabilities, and ultimately elevating audit quality and insight delivery.
- Consumer and Stakeholder Expectations: A growing societal demand for greater transparency, ethical conduct, and corporate accountability is pushing businesses to seek independent verification of their operations and reporting.
While market penetration is already high among large enterprises, there is a substantial opportunity for growth within the Small and Medium-sized Enterprise (SME) segment, which often requires more tailored and cost-effective audit solutions.
Dominant Regions, Countries, or Segments in US Audit Industry
The largest segments within the US audit industry include publicly traded companies and large private enterprises concentrated in major metropolitan areas like New York, Los Angeles, Chicago, and San Francisco. These regions benefit from a high density of businesses, financial institutions, and skilled professionals. Strong economic activity, robust regulatory frameworks, and a well-developed infrastructure further contribute to their dominance. Government regulations and economic policies play a pivotal role in driving demand for audit services within these regions.
- Key Drivers: High concentration of businesses, strong economic growth, robust regulatory environment, and advanced infrastructure.
- Market Share: Major metropolitan areas hold the largest market share, with xx% attributed to the top 5 regions in 2025.
- Growth Potential: Continued growth is expected, driven by increasing business activity and regulatory compliance needs.
US Audit Industry Product Landscape
The audit industry's product landscape is evolving rapidly, incorporating advanced technologies such as AI-powered data analytics and cloud-based audit platforms. These innovations improve efficiency, reduce manual effort, and enhance the accuracy and reliability of audit procedures. Unique selling propositions increasingly focus on delivering data-driven insights and providing proactive risk management advice. The industry's performance metrics are shifting towards enhanced speed, accuracy, and cost-effectiveness.
Key Drivers, Barriers & Challenges in US Audit Industry
Key Drivers:
- Increasing Regulatory Requirements and Compliance Needs: Ever-evolving compliance mandates from bodies like the SEC, PCAOB, and industry-specific regulators continue to drive the demand for comprehensive audit services.
- Growing Complexity of Business Operations and Financial Reporting: Globalization, mergers and acquisitions, and sophisticated financial instruments necessitate deeper expertise and more advanced audit methodologies.
- Rising Demand for Assurance Services Related to Emerging Technologies: The rapid adoption of AI, cloud computing, IoT, and blockchain creates new avenues for audit, focusing on data integrity, cybersecurity, and system controls.
- Technological Advancements Enhancing Audit Efficiency and Accuracy: The integration of data analytics, AI-powered tools, and automation is streamlining audit processes, improving risk assessment, and enabling more precise and insightful findings.
- Focus on ESG Reporting and Assurance: Growing investor and stakeholder interest in Environmental, Social, and Governance (ESG) performance is creating a significant new demand for specialized assurance services.
Key Challenges and Restraints:
- Intense Competition and Pricing Pressures: The market is highly competitive, with significant pressure on pricing, particularly impacting smaller firms and those offering more commoditized services.
- Maintaining High Quality and Consistency of Audits Amidst Technological Disruptions: Ensuring that the adoption of new technologies does not compromise the rigor, independence, and overall quality of audit opinions is a continuous challenge.
- Shortage of Skilled Professionals: There is a persistent and growing demand for audit professionals with specialized skills in areas such as data analytics, cybersecurity, forensic accounting, and AI, leading to talent gaps.
- Regulatory Changes and Evolving Accounting Standards: The dynamic nature of accounting standards and regulatory frameworks requires constant adaptation and training, creating compliance complexities and potential for errors.
- Client Expectations for Value-Added Services: Clients increasingly expect auditors to provide insights beyond traditional compliance, pushing firms to develop broader advisory capabilities.
Emerging Opportunities in US Audit Industry
The US audit industry is ripe with emerging opportunities, particularly in specialized and forward-looking service areas. Key growth avenues include:
- Cybersecurity Audits: With the escalating threat landscape, there is a burgeoning demand for audits that assess an organization's cybersecurity posture, data protection measures, and compliance with relevant regulations.
- Data Privacy Assurance: As data privacy laws like GDPR and CCPA become more prevalent, businesses require assurance on their data handling practices, consent management, and compliance with privacy frameworks.
- Sustainability and ESG Audits: The increasing focus on Environmental, Social, and Governance (ESG) factors by investors, regulators, and consumers is creating a significant market for independent assurance on ESG reports and claims.
- Blockchain and Distributed Ledger Technology (DLT) Assurance: The growing adoption of blockchain technology in various industries opens up opportunities for auditors to develop expertise in verifying the integrity and security of blockchain-based transactions and smart contracts.
- SME Market Expansion: While large enterprises are well-served, many SMEs still require more accessible and tailored audit and assurance solutions, representing a significant untapped market.
- Industry-Specific Specialization: Developing deep expertise in niche industries (e.g., healthcare, fintech, life sciences) allows firms to offer highly relevant and valuable audit services.
- Technology-Enabled Advisory Services: Leveraging advanced analytics and AI to provide proactive risk management, process optimization, and strategic insights to clients.
Growth Accelerators in the US Audit Industry
Several powerful forces are accelerating the growth and evolution of the US audit industry:
- Technological Innovation: The widespread adoption of Artificial Intelligence (AI), machine learning, robotic process automation (RPA), and advanced data analytics is fundamentally transforming audit methodologies. These technologies enable auditors to process vast datasets, identify anomalies more effectively, predict risks, and deliver deeper insights, leading to enhanced efficiency, accuracy, and value.
- Strategic Partnerships and Alliances: Collaborations between established audit firms and innovative technology providers are crucial. These partnerships facilitate the co-creation and deployment of cutting-edge audit tools and platforms, enabling firms to offer more sophisticated solutions and stay ahead of the technological curve.
- International Expansion and Globalization: As businesses operate on a global scale, audit firms are expanding their international presence and capabilities to serve multinational clients. This includes developing expertise in diverse regulatory environments and cross-border auditing standards.
- Diversification of Service Offerings: Leading firms are moving beyond traditional financial statement audits to offer a broader spectrum of assurance and advisory services. This includes IT assurance, cybersecurity audits, ESG reporting assurance, forensic accounting, and risk management consulting, catering to the evolving needs of clients.
- Focus on Talent Development and Upskilling: Investing in continuous training and development programs for audit professionals, particularly in areas of technology, data science, and specialized industry knowledge, is a key accelerator for maintaining competitiveness and delivering high-quality services.
Key Players Shaping the US Audit Industry Market
The US audit industry is characterized by a mix of global accounting giants and specialized firms, all contributing to its dynamic landscape. The "Big Four" continue to dominate the market for large public companies, while other firms cater to mid-market and smaller enterprises. Key players include:
- Deloitte
- EY
- KPMG
- PwC
- RSM US
- Grant Thornton LLP
- A T Kearney
- BDO USA
- CBIZ & Mayer Hoffman McCann
- Crowe Horwath
- List Not Exhaustive
These firms are actively engaged in innovation, technology adoption, and strategic acquisitions to maintain their competitive edge and address the evolving demands of the market.
Notable Milestones in US Audit Industry Sector
- May 2023: Deloitte and Google Cloud strengthen their alliance, focusing on Generative AI applications across various industries.
- May 2023: EY unveils over 20 new Assurance technology capabilities after partnering with Microsoft, part of a USD 1 billion investment.
In-Depth US Audit Industry Market Outlook
The US audit industry is poised for continued growth, driven by technological advancements and increasing regulatory demands. Strategic opportunities exist in leveraging AI and data analytics to enhance audit quality and efficiency. Expanding into niche markets and developing specialized services will be crucial for maintaining a competitive edge. The future of the industry lies in embracing innovation and adapting to the ever-evolving business landscape.
US Audit Industry Segmentation
-
1. Type
- 1.1. Internal Audit
- 1.2. External Audit
-
2. Service line
- 2.1. Operational Audits
- 2.2. Financial Audits
- 2.3. Advisory and Consulting
- 2.4. Investigation Audit
- 2.5. Information System Audit
- 2.6. Compliance Audit
- 2.7. Other
US Audit Industry Segmentation By Geography
-
1. North America
- 1.1. United States
- 1.2. Canada
- 1.3. Mexico
-
2. South America
- 2.1. Brazil
- 2.2. Argentina
- 2.3. Rest of South America
-
3. Europe
- 3.1. United Kingdom
- 3.2. Germany
- 3.3. France
- 3.4. Italy
- 3.5. Spain
- 3.6. Russia
- 3.7. Benelux
- 3.8. Nordics
- 3.9. Rest of Europe
-
4. Middle East & Africa
- 4.1. Turkey
- 4.2. Israel
- 4.3. GCC
- 4.4. North Africa
- 4.5. South Africa
- 4.6. Rest of Middle East & Africa
-
5. Asia Pacific
- 5.1. China
- 5.2. India
- 5.3. Japan
- 5.4. South Korea
- 5.5. ASEAN
- 5.6. Oceania
- 5.7. Rest of Asia Pacific
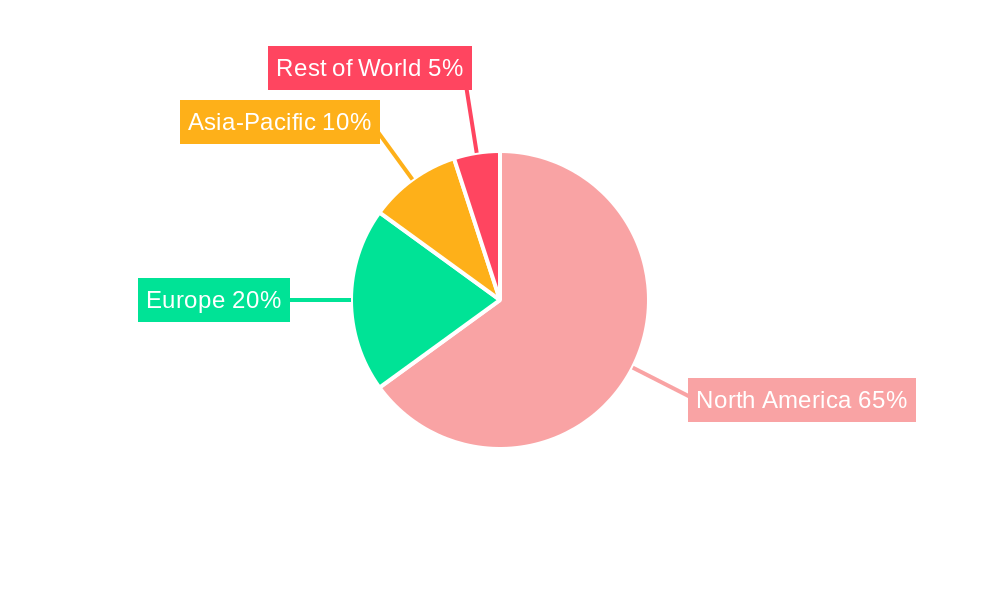
US Audit Industry Regional Market Share
Geographic Coverage of US Audit Industry
US Audit Industry REPORT HIGHLIGHTS
| Aspects | Details |
|---|---|
| Study Period | 2020-2034 |
| Base Year | 2025 |
| Estimated Year | 2026 |
| Forecast Period | 2026-2034 |
| Historical Period | 2020-2025 |
| Growth Rate | CAGR of 3.27% from 2020-2034 |
| Segmentation |
|
Table of Contents
- 1. Introduction
- 1.1. Research Scope
- 1.2. Market Segmentation
- 1.3. Research Objective
- 1.4. Definitions and Assumptions
- 2. Executive Summary
- 2.1. Market Snapshot
- 3. Market Dynamics
- 3.1. Market Drivers
- 3.2. Market Restrains
- 3.3. Market Trends
- 3.4. Market Opportunities
- 4. Market Factor Analysis
- 4.1. Porters Five Forces
- 4.1.1. Bargaining Power of Suppliers
- 4.1.2. Bargaining Power of Buyers
- 4.1.3. Threat of New Entrants
- 4.1.4. Threat of Substitutes
- 4.1.5. Competitive Rivalry
- 4.2. PESTEL analysis
- 4.3. BCG Analysis
- 4.3.1. Stars (High Growth, High Market Share)
- 4.3.2. Cash Cows (Low Growth, High Market Share)
- 4.3.3. Question Mark (High Growth, Low Market Share)
- 4.3.4. Dogs (Low Growth, Low Market Share)
- 4.4. Ansoff Matrix Analysis
- 4.5. Supply Chain Analysis
- 4.6. Regulatory Landscape
- 4.7. Current Market Potential and Opportunity Assessment (TAM–SAM–SOM Framework)
- 4.8. IMR Analyst Note
- 4.1. Porters Five Forces
- 5. Market Analysis, Insights and Forecast 2021-2033
- 5.1. Market Analysis, Insights and Forecast - by Type
- 5.1.1. Internal Audit
- 5.1.2. External Audit
- 5.2. Market Analysis, Insights and Forecast - by Service line
- 5.2.1. Operational Audits
- 5.2.2. Financial Audits
- 5.2.3. Advisory and Consulting
- 5.2.4. Investigation Audit
- 5.2.5. Information System Audit
- 5.2.6. Compliance Audit
- 5.2.7. Other
- 5.3. Market Analysis, Insights and Forecast - by Region
- 5.3.1. North America
- 5.3.2. South America
- 5.3.3. Europe
- 5.3.4. Middle East & Africa
- 5.3.5. Asia Pacific
- 5.1. Market Analysis, Insights and Forecast - by Type
- 6. Global US Audit Industry Analysis, Insights and Forecast, 2021-2033
- 6.1. Market Analysis, Insights and Forecast - by Type
- 6.1.1. Internal Audit
- 6.1.2. External Audit
- 6.2. Market Analysis, Insights and Forecast - by Service line
- 6.2.1. Operational Audits
- 6.2.2. Financial Audits
- 6.2.3. Advisory and Consulting
- 6.2.4. Investigation Audit
- 6.2.5. Information System Audit
- 6.2.6. Compliance Audit
- 6.2.7. Other
- 6.1. Market Analysis, Insights and Forecast - by Type
- 7. North America US Audit Industry Analysis, Insights and Forecast, 2020-2032
- 7.1. Market Analysis, Insights and Forecast - by Type
- 7.1.1. Internal Audit
- 7.1.2. External Audit
- 7.2. Market Analysis, Insights and Forecast - by Service line
- 7.2.1. Operational Audits
- 7.2.2. Financial Audits
- 7.2.3. Advisory and Consulting
- 7.2.4. Investigation Audit
- 7.2.5. Information System Audit
- 7.2.6. Compliance Audit
- 7.2.7. Other
- 7.1. Market Analysis, Insights and Forecast - by Type
- 8. South America US Audit Industry Analysis, Insights and Forecast, 2020-2032
- 8.1. Market Analysis, Insights and Forecast - by Type
- 8.1.1. Internal Audit
- 8.1.2. External Audit
- 8.2. Market Analysis, Insights and Forecast - by Service line
- 8.2.1. Operational Audits
- 8.2.2. Financial Audits
- 8.2.3. Advisory and Consulting
- 8.2.4. Investigation Audit
- 8.2.5. Information System Audit
- 8.2.6. Compliance Audit
- 8.2.7. Other
- 8.1. Market Analysis, Insights and Forecast - by Type
- 9. Europe US Audit Industry Analysis, Insights and Forecast, 2020-2032
- 9.1. Market Analysis, Insights and Forecast - by Type
- 9.1.1. Internal Audit
- 9.1.2. External Audit
- 9.2. Market Analysis, Insights and Forecast - by Service line
- 9.2.1. Operational Audits
- 9.2.2. Financial Audits
- 9.2.3. Advisory and Consulting
- 9.2.4. Investigation Audit
- 9.2.5. Information System Audit
- 9.2.6. Compliance Audit
- 9.2.7. Other
- 9.1. Market Analysis, Insights and Forecast - by Type
- 10. Middle East & Africa US Audit Industry Analysis, Insights and Forecast, 2020-2032
- 10.1. Market Analysis, Insights and Forecast - by Type
- 10.1.1. Internal Audit
- 10.1.2. External Audit
- 10.2. Market Analysis, Insights and Forecast - by Service line
- 10.2.1. Operational Audits
- 10.2.2. Financial Audits
- 10.2.3. Advisory and Consulting
- 10.2.4. Investigation Audit
- 10.2.5. Information System Audit
- 10.2.6. Compliance Audit
- 10.2.7. Other
- 10.1. Market Analysis, Insights and Forecast - by Type
- 11. Asia Pacific US Audit Industry Analysis, Insights and Forecast, 2020-2032
- 11.1. Market Analysis, Insights and Forecast - by Type
- 11.1.1. Internal Audit
- 11.1.2. External Audit
- 11.2. Market Analysis, Insights and Forecast - by Service line
- 11.2.1. Operational Audits
- 11.2.2. Financial Audits
- 11.2.3. Advisory and Consulting
- 11.2.4. Investigation Audit
- 11.2.5. Information System Audit
- 11.2.6. Compliance Audit
- 11.2.7. Other
- 11.1. Market Analysis, Insights and Forecast - by Type
- 12. Competitive Analysis
- 12.1. Company Profiles
- 12.1.1 Deloitte
- 12.1.1.1. Company Overview
- 12.1.1.2. Products
- 12.1.1.3. Company Financials
- 12.1.1.4. SWOT Analysis
- 12.1.2 EY
- 12.1.2.1. Company Overview
- 12.1.2.2. Products
- 12.1.2.3. Company Financials
- 12.1.2.4. SWOT Analysis
- 12.1.3 KPMG
- 12.1.3.1. Company Overview
- 12.1.3.2. Products
- 12.1.3.3. Company Financials
- 12.1.3.4. SWOT Analysis
- 12.1.4 PwC
- 12.1.4.1. Company Overview
- 12.1.4.2. Products
- 12.1.4.3. Company Financials
- 12.1.4.4. SWOT Analysis
- 12.1.5 RSM US
- 12.1.5.1. Company Overview
- 12.1.5.2. Products
- 12.1.5.3. Company Financials
- 12.1.5.4. SWOT Analysis
- 12.1.6 Grant Thornton LLP
- 12.1.6.1. Company Overview
- 12.1.6.2. Products
- 12.1.6.3. Company Financials
- 12.1.6.4. SWOT Analysis
- 12.1.7 A T Kearney
- 12.1.7.1. Company Overview
- 12.1.7.2. Products
- 12.1.7.3. Company Financials
- 12.1.7.4. SWOT Analysis
- 12.1.8 BDO USA
- 12.1.8.1. Company Overview
- 12.1.8.2. Products
- 12.1.8.3. Company Financials
- 12.1.8.4. SWOT Analysis
- 12.1.9 CBIZ & Mayer Hoffman McCann
- 12.1.9.1. Company Overview
- 12.1.9.2. Products
- 12.1.9.3. Company Financials
- 12.1.9.4. SWOT Analysis
- 12.1.10 Crowe Horwath**List Not Exhaustive
- 12.1.10.1. Company Overview
- 12.1.10.2. Products
- 12.1.10.3. Company Financials
- 12.1.10.4. SWOT Analysis
- 12.1.1 Deloitte
- 12.2. Market Entropy
- 12.2.1 Company's Key Areas Served
- 12.2.2 Recent Developments
- 12.3. Company Market Share Analysis 2025
- 12.3.1 Top 5 Companies Market Share Analysis
- 12.3.2 Top 3 Companies Market Share Analysis
- 12.4. List of Potential Customers
- 13. Research Methodology
List of Figures
- Figure 1: Global US Audit Industry Revenue Breakdown (Million, %) by Region 2025 & 2033
- Figure 2: Global US Audit Industry Volume Breakdown (Billion, %) by Region 2025 & 2033
- Figure 3: North America US Audit Industry Revenue (Million), by Type 2025 & 2033
- Figure 4: North America US Audit Industry Volume (Billion), by Type 2025 & 2033
- Figure 5: North America US Audit Industry Revenue Share (%), by Type 2025 & 2033
- Figure 6: North America US Audit Industry Volume Share (%), by Type 2025 & 2033
- Figure 7: North America US Audit Industry Revenue (Million), by Service line 2025 & 2033
- Figure 8: North America US Audit Industry Volume (Billion), by Service line 2025 & 2033
- Figure 9: North America US Audit Industry Revenue Share (%), by Service line 2025 & 2033
- Figure 10: North America US Audit Industry Volume Share (%), by Service line 2025 & 2033
- Figure 11: North America US Audit Industry Revenue (Million), by Country 2025 & 2033
- Figure 12: North America US Audit Industry Volume (Billion), by Country 2025 & 2033
- Figure 13: North America US Audit Industry Revenue Share (%), by Country 2025 & 2033
- Figure 14: North America US Audit Industry Volume Share (%), by Country 2025 & 2033
- Figure 15: South America US Audit Industry Revenue (Million), by Type 2025 & 2033
- Figure 16: South America US Audit Industry Volume (Billion), by Type 2025 & 2033
- Figure 17: South America US Audit Industry Revenue Share (%), by Type 2025 & 2033
- Figure 18: South America US Audit Industry Volume Share (%), by Type 2025 & 2033
- Figure 19: South America US Audit Industry Revenue (Million), by Service line 2025 & 2033
- Figure 20: South America US Audit Industry Volume (Billion), by Service line 2025 & 2033
- Figure 21: South America US Audit Industry Revenue Share (%), by Service line 2025 & 2033
- Figure 22: South America US Audit Industry Volume Share (%), by Service line 2025 & 2033
- Figure 23: South America US Audit Industry Revenue (Million), by Country 2025 & 2033
- Figure 24: South America US Audit Industry Volume (Billion), by Country 2025 & 2033
- Figure 25: South America US Audit Industry Revenue Share (%), by Country 2025 & 2033
- Figure 26: South America US Audit Industry Volume Share (%), by Country 2025 & 2033
- Figure 27: Europe US Audit Industry Revenue (Million), by Type 2025 & 2033
- Figure 28: Europe US Audit Industry Volume (Billion), by Type 2025 & 2033
- Figure 29: Europe US Audit Industry Revenue Share (%), by Type 2025 & 2033
- Figure 30: Europe US Audit Industry Volume Share (%), by Type 2025 & 2033
- Figure 31: Europe US Audit Industry Revenue (Million), by Service line 2025 & 2033
- Figure 32: Europe US Audit Industry Volume (Billion), by Service line 2025 & 2033
- Figure 33: Europe US Audit Industry Revenue Share (%), by Service line 2025 & 2033
- Figure 34: Europe US Audit Industry Volume Share (%), by Service line 2025 & 2033
- Figure 35: Europe US Audit Industry Revenue (Million), by Country 2025 & 2033
- Figure 36: Europe US Audit Industry Volume (Billion), by Country 2025 & 2033
- Figure 37: Europe US Audit Industry Revenue Share (%), by Country 2025 & 2033
- Figure 38: Europe US Audit Industry Volume Share (%), by Country 2025 & 2033
- Figure 39: Middle East & Africa US Audit Industry Revenue (Million), by Type 2025 & 2033
- Figure 40: Middle East & Africa US Audit Industry Volume (Billion), by Type 2025 & 2033
- Figure 41: Middle East & Africa US Audit Industry Revenue Share (%), by Type 2025 & 2033
- Figure 42: Middle East & Africa US Audit Industry Volume Share (%), by Type 2025 & 2033
- Figure 43: Middle East & Africa US Audit Industry Revenue (Million), by Service line 2025 & 2033
- Figure 44: Middle East & Africa US Audit Industry Volume (Billion), by Service line 2025 & 2033
- Figure 45: Middle East & Africa US Audit Industry Revenue Share (%), by Service line 2025 & 2033
- Figure 46: Middle East & Africa US Audit Industry Volume Share (%), by Service line 2025 & 2033
- Figure 47: Middle East & Africa US Audit Industry Revenue (Million), by Country 2025 & 2033
- Figure 48: Middle East & Africa US Audit Industry Volume (Billion), by Country 2025 & 2033
- Figure 49: Middle East & Africa US Audit Industry Revenue Share (%), by Country 2025 & 2033
- Figure 50: Middle East & Africa US Audit Industry Volume Share (%), by Country 2025 & 2033
- Figure 51: Asia Pacific US Audit Industry Revenue (Million), by Type 2025 & 2033
- Figure 52: Asia Pacific US Audit Industry Volume (Billion), by Type 2025 & 2033
- Figure 53: Asia Pacific US Audit Industry Revenue Share (%), by Type 2025 & 2033
- Figure 54: Asia Pacific US Audit Industry Volume Share (%), by Type 2025 & 2033
- Figure 55: Asia Pacific US Audit Industry Revenue (Million), by Service line 2025 & 2033
- Figure 56: Asia Pacific US Audit Industry Volume (Billion), by Service line 2025 & 2033
- Figure 57: Asia Pacific US Audit Industry Revenue Share (%), by Service line 2025 & 2033
- Figure 58: Asia Pacific US Audit Industry Volume Share (%), by Service line 2025 & 2033
- Figure 59: Asia Pacific US Audit Industry Revenue (Million), by Country 2025 & 2033
- Figure 60: Asia Pacific US Audit Industry Volume (Billion), by Country 2025 & 2033
- Figure 61: Asia Pacific US Audit Industry Revenue Share (%), by Country 2025 & 2033
- Figure 62: Asia Pacific US Audit Industry Volume Share (%), by Country 2025 & 2033
List of Tables
- Table 1: Global US Audit Industry Revenue Million Forecast, by Type 2020 & 2033
- Table 2: Global US Audit Industry Volume Billion Forecast, by Type 2020 & 2033
- Table 3: Global US Audit Industry Revenue Million Forecast, by Service line 2020 & 2033
- Table 4: Global US Audit Industry Volume Billion Forecast, by Service line 2020 & 2033
- Table 5: Global US Audit Industry Revenue Million Forecast, by Region 2020 & 2033
- Table 6: Global US Audit Industry Volume Billion Forecast, by Region 2020 & 2033
- Table 7: Global US Audit Industry Revenue Million Forecast, by Type 2020 & 2033
- Table 8: Global US Audit Industry Volume Billion Forecast, by Type 2020 & 2033
- Table 9: Global US Audit Industry Revenue Million Forecast, by Service line 2020 & 2033
- Table 10: Global US Audit Industry Volume Billion Forecast, by Service line 2020 & 2033
- Table 11: Global US Audit Industry Revenue Million Forecast, by Country 2020 & 2033
- Table 12: Global US Audit Industry Volume Billion Forecast, by Country 2020 & 2033
- Table 13: United States US Audit Industry Revenue (Million) Forecast, by Application 2020 & 2033
- Table 14: United States US Audit Industry Volume (Billion) Forecast, by Application 2020 & 2033
- Table 15: Canada US Audit Industry Revenue (Million) Forecast, by Application 2020 & 2033
- Table 16: Canada US Audit Industry Volume (Billion) Forecast, by Application 2020 & 2033
- Table 17: Mexico US Audit Industry Revenue (Million) Forecast, by Application 2020 & 2033
- Table 18: Mexico US Audit Industry Volume (Billion) Forecast, by Application 2020 & 2033
- Table 19: Global US Audit Industry Revenue Million Forecast, by Type 2020 & 2033
- Table 20: Global US Audit Industry Volume Billion Forecast, by Type 2020 & 2033
- Table 21: Global US Audit Industry Revenue Million Forecast, by Service line 2020 & 2033
- Table 22: Global US Audit Industry Volume Billion Forecast, by Service line 2020 & 2033
- Table 23: Global US Audit Industry Revenue Million Forecast, by Country 2020 & 2033
- Table 24: Global US Audit Industry Volume Billion Forecast, by Country 2020 & 2033
- Table 25: Brazil US Audit Industry Revenue (Million) Forecast, by Application 2020 & 2033
- Table 26: Brazil US Audit Industry Volume (Billion) Forecast, by Application 2020 & 2033
- Table 27: Argentina US Audit Industry Revenue (Million) Forecast, by Application 2020 & 2033
- Table 28: Argentina US Audit Industry Volume (Billion) Forecast, by Application 2020 & 2033
- Table 29: Rest of South America US Audit Industry Revenue (Million) Forecast, by Application 2020 & 2033
- Table 30: Rest of South America US Audit Industry Volume (Billion) Forecast, by Application 2020 & 2033
- Table 31: Global US Audit Industry Revenue Million Forecast, by Type 2020 & 2033
- Table 32: Global US Audit Industry Volume Billion Forecast, by Type 2020 & 2033
- Table 33: Global US Audit Industry Revenue Million Forecast, by Service line 2020 & 2033
- Table 34: Global US Audit Industry Volume Billion Forecast, by Service line 2020 & 2033
- Table 35: Global US Audit Industry Revenue Million Forecast, by Country 2020 & 2033
- Table 36: Global US Audit Industry Volume Billion Forecast, by Country 2020 & 2033
- Table 37: United Kingdom US Audit Industry Revenue (Million) Forecast, by Application 2020 & 2033
- Table 38: United Kingdom US Audit Industry Volume (Billion) Forecast, by Application 2020 & 2033
- Table 39: Germany US Audit Industry Revenue (Million) Forecast, by Application 2020 & 2033
- Table 40: Germany US Audit Industry Volume (Billion) Forecast, by Application 2020 & 2033
- Table 41: France US Audit Industry Revenue (Million) Forecast, by Application 2020 & 2033
- Table 42: France US Audit Industry Volume (Billion) Forecast, by Application 2020 & 2033
- Table 43: Italy US Audit Industry Revenue (Million) Forecast, by Application 2020 & 2033
- Table 44: Italy US Audit Industry Volume (Billion) Forecast, by Application 2020 & 2033
- Table 45: Spain US Audit Industry Revenue (Million) Forecast, by Application 2020 & 2033
- Table 46: Spain US Audit Industry Volume (Billion) Forecast, by Application 2020 & 2033
- Table 47: Russia US Audit Industry Revenue (Million) Forecast, by Application 2020 & 2033
- Table 48: Russia US Audit Industry Volume (Billion) Forecast, by Application 2020 & 2033
- Table 49: Benelux US Audit Industry Revenue (Million) Forecast, by Application 2020 & 2033
- Table 50: Benelux US Audit Industry Volume (Billion) Forecast, by Application 2020 & 2033
- Table 51: Nordics US Audit Industry Revenue (Million) Forecast, by Application 2020 & 2033
- Table 52: Nordics US Audit Industry Volume (Billion) Forecast, by Application 2020 & 2033
- Table 53: Rest of Europe US Audit Industry Revenue (Million) Forecast, by Application 2020 & 2033
- Table 54: Rest of Europe US Audit Industry Volume (Billion) Forecast, by Application 2020 & 2033
- Table 55: Global US Audit Industry Revenue Million Forecast, by Type 2020 & 2033
- Table 56: Global US Audit Industry Volume Billion Forecast, by Type 2020 & 2033
- Table 57: Global US Audit Industry Revenue Million Forecast, by Service line 2020 & 2033
- Table 58: Global US Audit Industry Volume Billion Forecast, by Service line 2020 & 2033
- Table 59: Global US Audit Industry Revenue Million Forecast, by Country 2020 & 2033
- Table 60: Global US Audit Industry Volume Billion Forecast, by Country 2020 & 2033
- Table 61: Turkey US Audit Industry Revenue (Million) Forecast, by Application 2020 & 2033
- Table 62: Turkey US Audit Industry Volume (Billion) Forecast, by Application 2020 & 2033
- Table 63: Israel US Audit Industry Revenue (Million) Forecast, by Application 2020 & 2033
- Table 64: Israel US Audit Industry Volume (Billion) Forecast, by Application 2020 & 2033
- Table 65: GCC US Audit Industry Revenue (Million) Forecast, by Application 2020 & 2033
- Table 66: GCC US Audit Industry Volume (Billion) Forecast, by Application 2020 & 2033
- Table 67: North Africa US Audit Industry Revenue (Million) Forecast, by Application 2020 & 2033
- Table 68: North Africa US Audit Industry Volume (Billion) Forecast, by Application 2020 & 2033
- Table 69: South Africa US Audit Industry Revenue (Million) Forecast, by Application 2020 & 2033
- Table 70: South Africa US Audit Industry Volume (Billion) Forecast, by Application 2020 & 2033
- Table 71: Rest of Middle East & Africa US Audit Industry Revenue (Million) Forecast, by Application 2020 & 2033
- Table 72: Rest of Middle East & Africa US Audit Industry Volume (Billion) Forecast, by Application 2020 & 2033
- Table 73: Global US Audit Industry Revenue Million Forecast, by Type 2020 & 2033
- Table 74: Global US Audit Industry Volume Billion Forecast, by Type 2020 & 2033
- Table 75: Global US Audit Industry Revenue Million Forecast, by Service line 2020 & 2033
- Table 76: Global US Audit Industry Volume Billion Forecast, by Service line 2020 & 2033
- Table 77: Global US Audit Industry Revenue Million Forecast, by Country 2020 & 2033
- Table 78: Global US Audit Industry Volume Billion Forecast, by Country 2020 & 2033
- Table 79: China US Audit Industry Revenue (Million) Forecast, by Application 2020 & 2033
- Table 80: China US Audit Industry Volume (Billion) Forecast, by Application 2020 & 2033
- Table 81: India US Audit Industry Revenue (Million) Forecast, by Application 2020 & 2033
- Table 82: India US Audit Industry Volume (Billion) Forecast, by Application 2020 & 2033
- Table 83: Japan US Audit Industry Revenue (Million) Forecast, by Application 2020 & 2033
- Table 84: Japan US Audit Industry Volume (Billion) Forecast, by Application 2020 & 2033
- Table 85: South Korea US Audit Industry Revenue (Million) Forecast, by Application 2020 & 2033
- Table 86: South Korea US Audit Industry Volume (Billion) Forecast, by Application 2020 & 2033
- Table 87: ASEAN US Audit Industry Revenue (Million) Forecast, by Application 2020 & 2033
- Table 88: ASEAN US Audit Industry Volume (Billion) Forecast, by Application 2020 & 2033
- Table 89: Oceania US Audit Industry Revenue (Million) Forecast, by Application 2020 & 2033
- Table 90: Oceania US Audit Industry Volume (Billion) Forecast, by Application 2020 & 2033
- Table 91: Rest of Asia Pacific US Audit Industry Revenue (Million) Forecast, by Application 2020 & 2033
- Table 92: Rest of Asia Pacific US Audit Industry Volume (Billion) Forecast, by Application 2020 & 2033
Frequently Asked Questions
1. What is the projected Compound Annual Growth Rate (CAGR) of the US Audit Industry?
The projected CAGR is approximately 3.27%.
2. Which companies are prominent players in the US Audit Industry?
Key companies in the market include Deloitte, EY, KPMG, PwC, RSM US, Grant Thornton LLP, A T Kearney, BDO USA, CBIZ & Mayer Hoffman McCann, Crowe Horwath**List Not Exhaustive.
3. What are the main segments of the US Audit Industry?
The market segments include Type, Service line.
4. Can you provide details about the market size?
The market size is estimated to be USD 50.24 Million as of 2022.
5. What are some drivers contributing to market growth?
N/A
6. What are the notable trends driving market growth?
Declining Quality of Auditing from the Big 4.
7. Are there any restraints impacting market growth?
N/A
8. Can you provide examples of recent developments in the market?
In May 2023, Deloitte and Google Cloud have recently bolstered their decade-long alliance, with a specific focus on deploying Google Cloud's cutting-edge Generative AI capabilities across various industries.
9. What pricing options are available for accessing the report?
Pricing options include single-user, multi-user, and enterprise licenses priced at USD 3800, USD 4500, and USD 5800 respectively.
10. Is the market size provided in terms of value or volume?
The market size is provided in terms of value, measured in Million and volume, measured in Billion.
11. Are there any specific market keywords associated with the report?
Yes, the market keyword associated with the report is "US Audit Industry," which aids in identifying and referencing the specific market segment covered.
12. How do I determine which pricing option suits my needs best?
The pricing options vary based on user requirements and access needs. Individual users may opt for single-user licenses, while businesses requiring broader access may choose multi-user or enterprise licenses for cost-effective access to the report.
13. Are there any additional resources or data provided in the US Audit Industry report?
While the report offers comprehensive insights, it's advisable to review the specific contents or supplementary materials provided to ascertain if additional resources or data are available.
14. How can I stay updated on further developments or reports in the US Audit Industry?
To stay informed about further developments, trends, and reports in the US Audit Industry, consider subscribing to industry newsletters, following relevant companies and organizations, or regularly checking reputable industry news sources and publications.
Methodology
Step 1 - Identification of Relevant Samples Size from Population Database


Step 2 - Approaches for Defining Global Market Size (Value, Volume* & Price*)

Note*: In applicable scenarios
Step 3 - Data Sources
Primary Research
- Web Analytics
- Survey Reports
- Research Institute
- Latest Research Reports
- Opinion Leaders
Secondary Research
- Annual Reports
- White Paper
- Latest Press Release
- Industry Association
- Paid Database
- Investor Presentations

Step 4 - Data Triangulation
Involves using different sources of information in order to increase the validity of a study
These sources are likely to be stakeholders in a program - participants, other researchers, program staff, other community members, and so on.
Then we put all data in single framework & apply various statistical tools to find out the dynamic on the market.
During the analysis stage, feedback from the stakeholder groups would be compared to determine areas of agreement as well as areas of divergence