

Key Insights
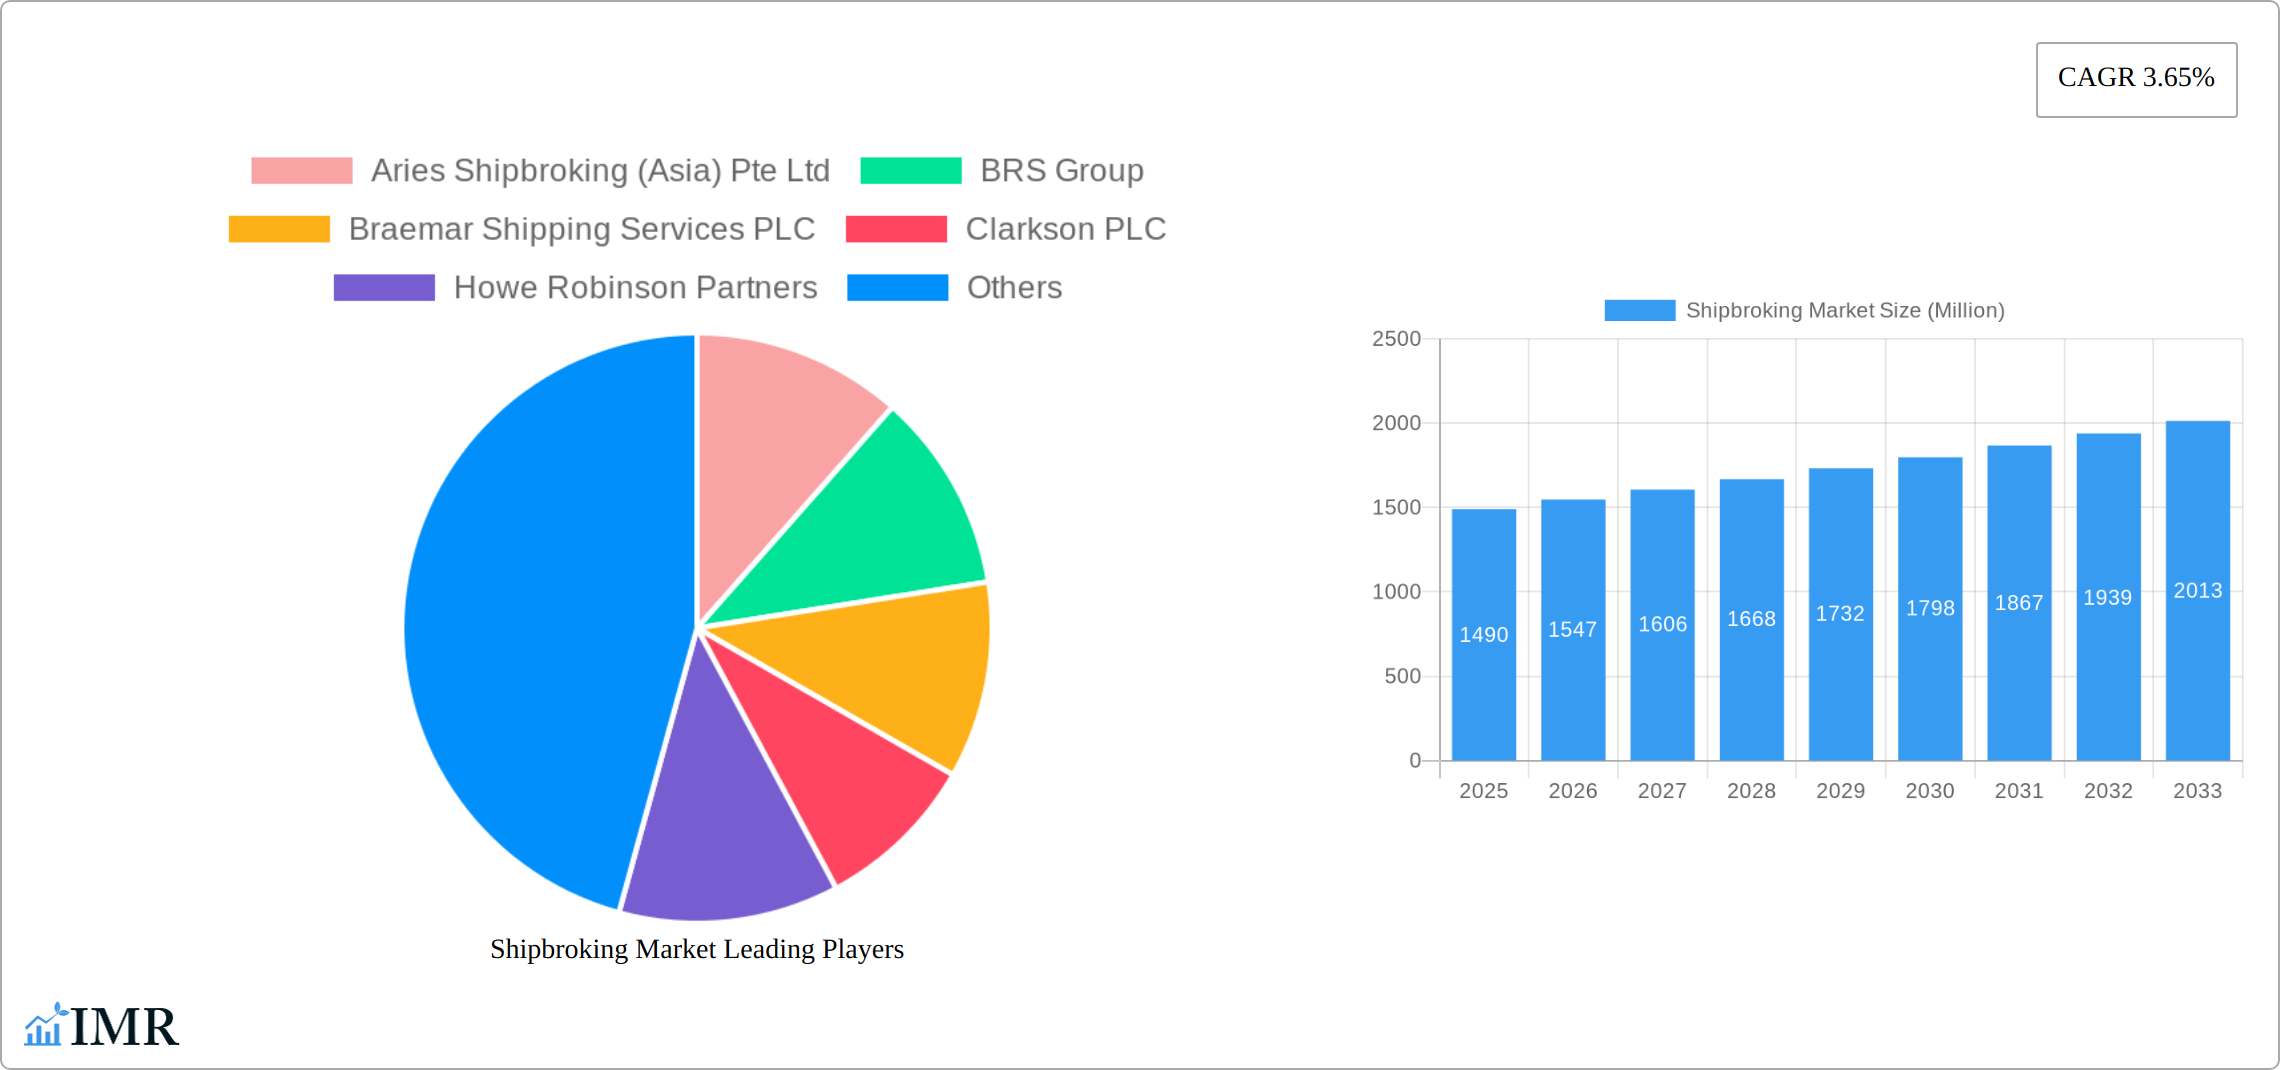
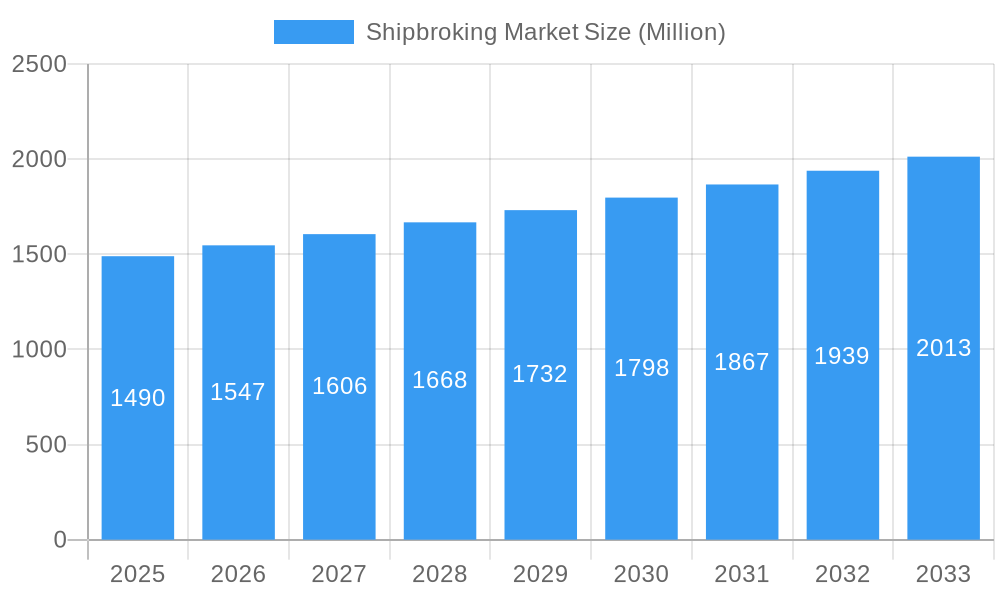
The global shipbroking market, valued at $1.49 billion in 2025, is projected to experience steady growth, driven by increasing global trade volumes and the ongoing need for efficient vessel chartering and operations. The Compound Annual Growth Rate (CAGR) of 3.65% from 2025 to 2033 indicates a consistent expansion, fueled by several key factors. The growth of the global shipping industry, particularly in sectors like container shipping and bulk carriers, creates significant demand for shipbroking services. Technological advancements, such as digital platforms and data analytics, are streamlining brokerage processes and improving market transparency, boosting efficiency and attracting new players. Furthermore, the growing complexity of maritime regulations and compliance requirements necessitates specialized shipbroking expertise, furthering market demand. However, market volatility related to global economic fluctuations and fuel price changes remains a considerable restraint. The competitive landscape is marked by established players like Clarkson PLC and Braemar Shipping Services PLC, along with several mid-sized and smaller regional brokers. Increased competition is likely to drive innovation and further enhance the services offered within the market. Segmentation within the market is likely diverse, encompassing vessel types (e.g., tankers, dry bulk, container ships), charter types (e.g., time charter, voyage charter), and geographical regions, each exhibiting varying growth trajectories.
Shipbroking Market Market Size (In Billion)
The period from 2019 to 2024 represents a foundation for the projected growth, providing valuable historical data for accurate forecasting. The forecast period (2025-2033) anticipates continued expansion driven by the factors outlined above. While specific regional breakdowns are unavailable, it's reasonable to anticipate a concentration of market share among established shipping hubs and regions with significant maritime activity, such as Europe, Asia, and North America. Further market segmentation based on service offerings (e.g., sale and purchase, chartering, newbuilding) will provide a more granular understanding of market dynamics. The continuous evolution of shipping logistics and technologies will reshape the competitive landscape, necessitating continuous adaptation and innovation within the shipbroking industry.
Shipbroking Market Company Market Share
Shipbroking Market Report: 2019-2033 Forecast
This comprehensive report provides an in-depth analysis of the global Shipbroking Market, encompassing its parent market (Maritime Services) and child markets (Dry Bulk, Tanker, and Container Shipping Broking). The study period covers 2019-2033, with 2025 as the base year and an estimated market size of xx Million. The forecast period spans 2025-2033. This report is essential for industry professionals, investors, and strategic decision-makers seeking to understand the market dynamics, growth trends, and key players shaping the future of shipbroking.
Shipbroking Market Dynamics & Structure
The global shipbroking market is characterized by moderate concentration, with a few large players holding significant market share alongside numerous smaller, specialized firms. Market share data for 2024 estimates Clarkson PLC at approximately 15%, Braemar Shipping Services PLC at 10%, and the remaining share distributed amongst other players. Technological innovation, driven by digitalization and data analytics, is reshaping operations, creating efficiencies and improving decision-making. However, high initial investment costs and integration challenges present barriers to full adoption. Regulatory frameworks, particularly those related to environmental compliance and safety, significantly influence market practices. The market faces competition from alternative transaction methods but maintains dominance due to its expertise and network effects. M&A activity has been steady, with xx deals recorded in the historical period (2019-2024), primarily focused on consolidation and expansion into new segments.
- Market Concentration: Moderately concentrated, with top players holding xx% of market share in 2024.
- Technological Innovation: Digitalization and data analytics driving efficiency gains but facing high implementation costs.
- Regulatory Framework: Stringent environmental and safety regulations shaping market operations.
- Competitive Substitutes: Limited direct substitutes, but alternative transaction methods pose indirect competition.
- M&A Activity: xx deals between 2019-2024, focusing on consolidation and expansion.
Shipbroking Market Growth Trends & Insights
The shipbroking market experienced a CAGR of xx% during the historical period (2019-2024), driven by increasing global trade volumes and the need for specialized brokerage services. The market size is projected to reach xx Million by 2033, exhibiting a CAGR of xx% during the forecast period (2025-2033). Technological advancements, such as AI-powered analytics and blockchain-based platforms, are improving transparency and efficiency. Furthermore, the rising demand for sustainable shipping practices is creating opportunities for specialized brokers focusing on environmentally friendly vessels and fuels. Shifts in consumer behavior, particularly towards e-commerce and just-in-time inventory management, are further influencing demand. The adoption rate of digital tools is expected to increase significantly over the forecast period, leading to improved efficiency and cost reduction for brokers.
Dominant Regions, Countries, or Segments in Shipbroking Market
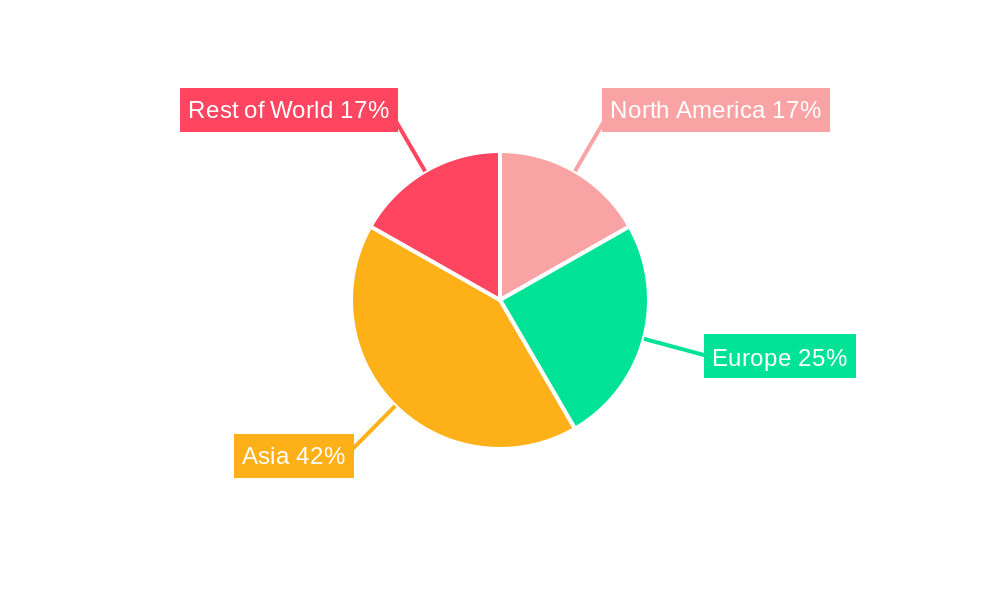
The global shipbroking market is a dynamic and geographically diverse landscape, with distinct regions and segments showcasing significant influence and growth potential. Europe continues to be a bedrock of the industry, boasting established shipping hubs and a robust regulatory framework that fosters stability and trust. It is estimated to hold a substantial market share, approximately 35-40% in 2024. In contrast, Asia is emerging as the fastest-growing region, propelled by its rapid economic expansion, burgeoning manufacturing sectors, and a monumental increase in shipping activity. This region is projected to witness a compound annual growth rate (CAGR) of 7-9% during the forecast period. Countries like Singapore, recognized for its strategic maritime location and advanced infrastructure; London, a historical and financial powerhouse for shipping services; and Hong Kong, a key gateway to mainland China and Southeast Asia, are pivotal hubs that attract significant brokerage activity. On the segment front, the dry bulk segment currently commands the largest market share, estimated at approximately 45-50%, driven by the consistent global demand for commodities. Tanker broking remains a significant player, while the container shipping segment is poised for the fastest growth. This surge is directly attributable to the relentless expansion of e-commerce, the increasing complexity of global supply chains, and the growing demand for efficient and reliable containerized freight solutions.
- Europe: Characterized by well-established shipping hubs, advanced financial services, and a strong, stable regulatory environment, making it a consistently dominant region.
- Asia: The epicenter of rapid economic growth and industrialization, leading to a surge in both import and export activities, thus fueling substantial growth in shipping and broking services.
- Dry Bulk Segment: Remains the cornerstone of the shipbroking market, driven by the enduring global demand for the transportation of raw materials like iron ore, coal, and grains.
- Container Shipping: Experiencing accelerated growth, largely powered by the global boom in e-commerce, the need for efficient logistics in intricate supply chains, and increasing trade volumes.
Shipbroking Market Product Landscape
The shipbroking market offers a comprehensive suite of specialized services designed to cater to the intricate needs of various vessel types, cargo requirements, and maritime transactions. Key offerings include chartering (finding suitable vessels for cargo or cargo for vessels), sale and purchase (S&P) (facilitating the buying and selling of existing vessels), newbuilding (brokering contracts for the construction of new ships), and demolition broking (managing the sale of vessels for scrap). The industry is undergoing a significant transformation driven by technological advancements. Digital platforms are revolutionizing transaction processing, enabling faster execution, real-time data analysis, and enhanced communication channels between brokers, owners, and charterers. Leading brokers are differentiating themselves through their deep market expertise, cultivated over years of experience and analysis, their extensive and reliable global networks that connect buyers, sellers, and charterers worldwide, and an unwavering commitment to client service, ensuring personalized attention, transparency, and tailored solutions.
Key Drivers, Barriers & Challenges in Shipbroking Market
Key Drivers: Global trade expansion, increasing demand for specialized shipping services, and technological advancements driving efficiency gains are primary growth drivers. Government initiatives promoting sustainable shipping practices also create opportunities.
Key Challenges: Supply chain disruptions, regulatory hurdles related to environmental protection and safety, and intense competition among established and emerging players pose considerable challenges. These factors can lead to price volatility and reduced profit margins, impacting overall market growth. The impact of geopolitical instability on shipping routes and trade flows also presents a significant challenge.
Emerging Opportunities in Shipbroking Market
The shipbroking market is ripe with emerging opportunities that are shaping its future trajectory. Significant growth potential lies within specialized and niche markets. The burgeoning demand for LNG (Liquefied Natural Gas) shipping, driven by global energy transitions, presents a lucrative avenue. Similarly, the growing need for expertise in handling specialized cargo, such as project cargo, refrigerated goods, and chemicals, offers new avenues for brokers. The increasing global emphasis on environmental stewardship has fueled a substantial demand for sustainable shipping solutions, including greener vessel technologies and alternative fuels, creating a market for brokers knowledgeable in this area. Furthermore, the innovative application of digital technologies is unlocking unprecedented opportunities. AI-powered market forecasting tools can provide clients with predictive insights, while blockchain-based transaction platforms promise enhanced security, transparency, and efficiency in the complex processes of shipbroking. The growing global call for greater transparency and ethical practices within the shipping industry also presents a prime opportunity for forward-thinking brokers to champion and facilitate sustainable and responsible shipping practices, thereby building trust and long-term partnerships.
Growth Accelerators in the Shipbroking Market Industry
Several key factors are acting as significant growth accelerators for the shipbroking market. Technological innovation stands at the forefront, with advancements in Artificial Intelligence (AI) and sophisticated data analytics revolutionizing how market trends are identified, analyzed, and leveraged. These technologies empower brokers to offer more informed advice and predict market shifts with greater accuracy. The forging of strategic partnerships between traditional shipbroking firms and leading technology providers is crucial. These collaborations are fostering the development of cutting-edge platforms and bespoke services that significantly enhance operational efficiency, streamline workflows, and deliver superior value to clients. Geographically, expansion into new and emerging markets that are experiencing robust growth in shipping activity, such as certain regions in Africa and South America, represents another significant growth catalyst. Simultaneously, the proactive implementation and promotion of sustainable shipping practices, aligning with global environmental regulations and client demands, are not only becoming a necessity but also a powerful differentiator and a driver of future business growth.
Key Players Shaping the Shipbroking Market Market
- Aries Shipbroking (Asia) Pte Ltd
- BRS Group
- Braemar Shipping Services PLC
- Clarkson PLC
- Howe Robinson Partners
- Simpson Spense Young
- Fearnleys A/S
- ACM Shipping Group PLC
- Chowgule Brothers Pvt Ltd
- Affinity (Shipping) LLP
Notable Milestones in Shipbroking Market Sector
- September 2023: ZIM Integrated Shipping Services Ltd. signed a new operational collaboration agreement with MSC, enhancing service standards and operational efficiencies.
- January 2024: Maersk and Hapag-Lloyd announced a significant long-term collaboration, consolidating hundreds of vessels.
In-Depth Shipbroking Market Market Outlook
The future of the shipbroking market is promising, with significant growth potential driven by ongoing technological advancements and the increasing complexity of global shipping. Strategic partnerships, expansion into new markets, and a focus on sustainability will be critical for success. The adoption of innovative technologies and the development of specialized services will enable brokers to enhance efficiency, improve decision-making, and provide greater value to their clients. This report offers invaluable insights to guide businesses and investors in navigating the dynamic landscape of the shipbroking industry and capitalize on emerging opportunities.
Shipbroking Market Segmentation
-
1. Type
- 1.1. Dry Cargo Broking
- 1.2. Tanker Broking
- 1.3. Container Vessel Broking
- 1.4. Other Types
-
2. Service
- 2.1. Charting
- 2.2. Sales and Purchases
- 2.3. Offshore Services
- 2.4. Newbuilding Services
- 2.5. Salvage &Towage Services
-
3. Industry
- 3.1. Oil and Gas
- 3.2. Manufacturing
- 3.3. Aerospace and Defense
- 3.4. Government
- 3.5. Other Industries
Shipbroking Market Segmentation By Geography
-
1. North America
- 1.1. United States
- 1.2. Canada
- 1.3. Rest of North America
-
2. Europe
- 2.1. Germany
- 2.2. United Kingdom
- 2.3. France
- 2.4. Russia
- 2.5. Spain
- 2.6. Rest of Europe
-
3. Asia Pacific
- 3.1. India
- 3.2. China
- 3.3. Japan
- 3.4. Rest of Asia Pacific
-
4. South America
- 4.1. Brazil
- 4.2. Argentina
- 4.3. Rest of South America
-
5. Middle East and Africa
- 5.1. United Arab Emirates
- 5.2. Saudi Arabia
- 5.3. Rest of Middle East and Africa
Shipbroking Market Regional Market Share
Geographic Coverage of Shipbroking Market
Shipbroking Market REPORT HIGHLIGHTS
| Aspects | Details |
|---|---|
| Study Period | 2020-2034 |
| Base Year | 2025 |
| Estimated Year | 2026 |
| Forecast Period | 2026-2034 |
| Historical Period | 2020-2025 |
| Growth Rate | CAGR of 3.65% from 2020-2034 |
| Segmentation |
|
Table of Contents
- 1. Introduction
- 1.1. Research Scope
- 1.2. Market Segmentation
- 1.3. Research Objective
- 1.4. Definitions and Assumptions
- 2. Executive Summary
- 2.1. Market Snapshot
- 3. Market Dynamics
- 3.1. Market Drivers
- 3.2. Market Restrains
- 3.3. Market Trends
- 3.4. Market Opportunities
- 4. Market Factor Analysis
- 4.1. Porters Five Forces
- 4.1.1. Bargaining Power of Suppliers
- 4.1.2. Bargaining Power of Buyers
- 4.1.3. Threat of New Entrants
- 4.1.4. Threat of Substitutes
- 4.1.5. Competitive Rivalry
- 4.2. PESTEL analysis
- 4.3. BCG Analysis
- 4.3.1. Stars (High Growth, High Market Share)
- 4.3.2. Cash Cows (Low Growth, High Market Share)
- 4.3.3. Question Mark (High Growth, Low Market Share)
- 4.3.4. Dogs (Low Growth, Low Market Share)
- 4.4. Ansoff Matrix Analysis
- 4.5. Supply Chain Analysis
- 4.6. Regulatory Landscape
- 4.7. Current Market Potential and Opportunity Assessment (TAM–SAM–SOM Framework)
- 4.8. IMR Analyst Note
- 4.1. Porters Five Forces
- 5. Market Analysis, Insights and Forecast 2021-2033
- 5.1. Market Analysis, Insights and Forecast - by Type
- 5.1.1. Dry Cargo Broking
- 5.1.2. Tanker Broking
- 5.1.3. Container Vessel Broking
- 5.1.4. Other Types
- 5.2. Market Analysis, Insights and Forecast - by Service
- 5.2.1. Charting
- 5.2.2. Sales and Purchases
- 5.2.3. Offshore Services
- 5.2.4. Newbuilding Services
- 5.2.5. Salvage &Towage Services
- 5.3. Market Analysis, Insights and Forecast - by Industry
- 5.3.1. Oil and Gas
- 5.3.2. Manufacturing
- 5.3.3. Aerospace and Defense
- 5.3.4. Government
- 5.3.5. Other Industries
- 5.4. Market Analysis, Insights and Forecast - by Region
- 5.4.1. North America
- 5.4.2. Europe
- 5.4.3. Asia Pacific
- 5.4.4. South America
- 5.4.5. Middle East and Africa
- 5.1. Market Analysis, Insights and Forecast - by Type
- 6. Global Shipbroking Market Analysis, Insights and Forecast, 2021-2033
- 6.1. Market Analysis, Insights and Forecast - by Type
- 6.1.1. Dry Cargo Broking
- 6.1.2. Tanker Broking
- 6.1.3. Container Vessel Broking
- 6.1.4. Other Types
- 6.2. Market Analysis, Insights and Forecast - by Service
- 6.2.1. Charting
- 6.2.2. Sales and Purchases
- 6.2.3. Offshore Services
- 6.2.4. Newbuilding Services
- 6.2.5. Salvage &Towage Services
- 6.3. Market Analysis, Insights and Forecast - by Industry
- 6.3.1. Oil and Gas
- 6.3.2. Manufacturing
- 6.3.3. Aerospace and Defense
- 6.3.4. Government
- 6.3.5. Other Industries
- 6.1. Market Analysis, Insights and Forecast - by Type
- 7. North America Shipbroking Market Analysis, Insights and Forecast, 2020-2032
- 7.1. Market Analysis, Insights and Forecast - by Type
- 7.1.1. Dry Cargo Broking
- 7.1.2. Tanker Broking
- 7.1.3. Container Vessel Broking
- 7.1.4. Other Types
- 7.2. Market Analysis, Insights and Forecast - by Service
- 7.2.1. Charting
- 7.2.2. Sales and Purchases
- 7.2.3. Offshore Services
- 7.2.4. Newbuilding Services
- 7.2.5. Salvage &Towage Services
- 7.3. Market Analysis, Insights and Forecast - by Industry
- 7.3.1. Oil and Gas
- 7.3.2. Manufacturing
- 7.3.3. Aerospace and Defense
- 7.3.4. Government
- 7.3.5. Other Industries
- 7.1. Market Analysis, Insights and Forecast - by Type
- 8. Europe Shipbroking Market Analysis, Insights and Forecast, 2020-2032
- 8.1. Market Analysis, Insights and Forecast - by Type
- 8.1.1. Dry Cargo Broking
- 8.1.2. Tanker Broking
- 8.1.3. Container Vessel Broking
- 8.1.4. Other Types
- 8.2. Market Analysis, Insights and Forecast - by Service
- 8.2.1. Charting
- 8.2.2. Sales and Purchases
- 8.2.3. Offshore Services
- 8.2.4. Newbuilding Services
- 8.2.5. Salvage &Towage Services
- 8.3. Market Analysis, Insights and Forecast - by Industry
- 8.3.1. Oil and Gas
- 8.3.2. Manufacturing
- 8.3.3. Aerospace and Defense
- 8.3.4. Government
- 8.3.5. Other Industries
- 8.1. Market Analysis, Insights and Forecast - by Type
- 9. Asia Pacific Shipbroking Market Analysis, Insights and Forecast, 2020-2032
- 9.1. Market Analysis, Insights and Forecast - by Type
- 9.1.1. Dry Cargo Broking
- 9.1.2. Tanker Broking
- 9.1.3. Container Vessel Broking
- 9.1.4. Other Types
- 9.2. Market Analysis, Insights and Forecast - by Service
- 9.2.1. Charting
- 9.2.2. Sales and Purchases
- 9.2.3. Offshore Services
- 9.2.4. Newbuilding Services
- 9.2.5. Salvage &Towage Services
- 9.3. Market Analysis, Insights and Forecast - by Industry
- 9.3.1. Oil and Gas
- 9.3.2. Manufacturing
- 9.3.3. Aerospace and Defense
- 9.3.4. Government
- 9.3.5. Other Industries
- 9.1. Market Analysis, Insights and Forecast - by Type
- 10. South America Shipbroking Market Analysis, Insights and Forecast, 2020-2032
- 10.1. Market Analysis, Insights and Forecast - by Type
- 10.1.1. Dry Cargo Broking
- 10.1.2. Tanker Broking
- 10.1.3. Container Vessel Broking
- 10.1.4. Other Types
- 10.2. Market Analysis, Insights and Forecast - by Service
- 10.2.1. Charting
- 10.2.2. Sales and Purchases
- 10.2.3. Offshore Services
- 10.2.4. Newbuilding Services
- 10.2.5. Salvage &Towage Services
- 10.3. Market Analysis, Insights and Forecast - by Industry
- 10.3.1. Oil and Gas
- 10.3.2. Manufacturing
- 10.3.3. Aerospace and Defense
- 10.3.4. Government
- 10.3.5. Other Industries
- 10.1. Market Analysis, Insights and Forecast - by Type
- 11. Middle East and Africa Shipbroking Market Analysis, Insights and Forecast, 2020-2032
- 11.1. Market Analysis, Insights and Forecast - by Type
- 11.1.1. Dry Cargo Broking
- 11.1.2. Tanker Broking
- 11.1.3. Container Vessel Broking
- 11.1.4. Other Types
- 11.2. Market Analysis, Insights and Forecast - by Service
- 11.2.1. Charting
- 11.2.2. Sales and Purchases
- 11.2.3. Offshore Services
- 11.2.4. Newbuilding Services
- 11.2.5. Salvage &Towage Services
- 11.3. Market Analysis, Insights and Forecast - by Industry
- 11.3.1. Oil and Gas
- 11.3.2. Manufacturing
- 11.3.3. Aerospace and Defense
- 11.3.4. Government
- 11.3.5. Other Industries
- 11.1. Market Analysis, Insights and Forecast - by Type
- 12. Competitive Analysis
- 12.1. Company Profiles
- 12.1.1 Aries Shipbroking (Asia) Pte Ltd
- 12.1.1.1. Company Overview
- 12.1.1.2. Products
- 12.1.1.3. Company Financials
- 12.1.1.4. SWOT Analysis
- 12.1.2 BRS Group
- 12.1.2.1. Company Overview
- 12.1.2.2. Products
- 12.1.2.3. Company Financials
- 12.1.2.4. SWOT Analysis
- 12.1.3 Braemar Shipping Services PLC
- 12.1.3.1. Company Overview
- 12.1.3.2. Products
- 12.1.3.3. Company Financials
- 12.1.3.4. SWOT Analysis
- 12.1.4 Clarkson PLC
- 12.1.4.1. Company Overview
- 12.1.4.2. Products
- 12.1.4.3. Company Financials
- 12.1.4.4. SWOT Analysis
- 12.1.5 Howe Robinson Partners
- 12.1.5.1. Company Overview
- 12.1.5.2. Products
- 12.1.5.3. Company Financials
- 12.1.5.4. SWOT Analysis
- 12.1.6 Simpson Spense Young
- 12.1.6.1. Company Overview
- 12.1.6.2. Products
- 12.1.6.3. Company Financials
- 12.1.6.4. SWOT Analysis
- 12.1.7 Fearnleys A/S
- 12.1.7.1. Company Overview
- 12.1.7.2. Products
- 12.1.7.3. Company Financials
- 12.1.7.4. SWOT Analysis
- 12.1.8 ACM Shipping Group PLC
- 12.1.8.1. Company Overview
- 12.1.8.2. Products
- 12.1.8.3. Company Financials
- 12.1.8.4. SWOT Analysis
- 12.1.9 Chowgule Brothers Pvt Ltd
- 12.1.9.1. Company Overview
- 12.1.9.2. Products
- 12.1.9.3. Company Financials
- 12.1.9.4. SWOT Analysis
- 12.1.10 Affinity (Shipping) LLP**List Not Exhaustive
- 12.1.10.1. Company Overview
- 12.1.10.2. Products
- 12.1.10.3. Company Financials
- 12.1.10.4. SWOT Analysis
- 12.1.1 Aries Shipbroking (Asia) Pte Ltd
- 12.2. Market Entropy
- 12.2.1 Company's Key Areas Served
- 12.2.2 Recent Developments
- 12.3. Company Market Share Analysis 2025
- 12.3.1 Top 5 Companies Market Share Analysis
- 12.3.2 Top 3 Companies Market Share Analysis
- 12.4. List of Potential Customers
- 13. Research Methodology
List of Figures
- Figure 1: Global Shipbroking Market Revenue Breakdown (Million, %) by Region 2025 & 2033
- Figure 2: Global Shipbroking Market Volume Breakdown (Billion, %) by Region 2025 & 2033
- Figure 3: North America Shipbroking Market Revenue (Million), by Type 2025 & 2033
- Figure 4: North America Shipbroking Market Volume (Billion), by Type 2025 & 2033
- Figure 5: North America Shipbroking Market Revenue Share (%), by Type 2025 & 2033
- Figure 6: North America Shipbroking Market Volume Share (%), by Type 2025 & 2033
- Figure 7: North America Shipbroking Market Revenue (Million), by Service 2025 & 2033
- Figure 8: North America Shipbroking Market Volume (Billion), by Service 2025 & 2033
- Figure 9: North America Shipbroking Market Revenue Share (%), by Service 2025 & 2033
- Figure 10: North America Shipbroking Market Volume Share (%), by Service 2025 & 2033
- Figure 11: North America Shipbroking Market Revenue (Million), by Industry 2025 & 2033
- Figure 12: North America Shipbroking Market Volume (Billion), by Industry 2025 & 2033
- Figure 13: North America Shipbroking Market Revenue Share (%), by Industry 2025 & 2033
- Figure 14: North America Shipbroking Market Volume Share (%), by Industry 2025 & 2033
- Figure 15: North America Shipbroking Market Revenue (Million), by Country 2025 & 2033
- Figure 16: North America Shipbroking Market Volume (Billion), by Country 2025 & 2033
- Figure 17: North America Shipbroking Market Revenue Share (%), by Country 2025 & 2033
- Figure 18: North America Shipbroking Market Volume Share (%), by Country 2025 & 2033
- Figure 19: Europe Shipbroking Market Revenue (Million), by Type 2025 & 2033
- Figure 20: Europe Shipbroking Market Volume (Billion), by Type 2025 & 2033
- Figure 21: Europe Shipbroking Market Revenue Share (%), by Type 2025 & 2033
- Figure 22: Europe Shipbroking Market Volume Share (%), by Type 2025 & 2033
- Figure 23: Europe Shipbroking Market Revenue (Million), by Service 2025 & 2033
- Figure 24: Europe Shipbroking Market Volume (Billion), by Service 2025 & 2033
- Figure 25: Europe Shipbroking Market Revenue Share (%), by Service 2025 & 2033
- Figure 26: Europe Shipbroking Market Volume Share (%), by Service 2025 & 2033
- Figure 27: Europe Shipbroking Market Revenue (Million), by Industry 2025 & 2033
- Figure 28: Europe Shipbroking Market Volume (Billion), by Industry 2025 & 2033
- Figure 29: Europe Shipbroking Market Revenue Share (%), by Industry 2025 & 2033
- Figure 30: Europe Shipbroking Market Volume Share (%), by Industry 2025 & 2033
- Figure 31: Europe Shipbroking Market Revenue (Million), by Country 2025 & 2033
- Figure 32: Europe Shipbroking Market Volume (Billion), by Country 2025 & 2033
- Figure 33: Europe Shipbroking Market Revenue Share (%), by Country 2025 & 2033
- Figure 34: Europe Shipbroking Market Volume Share (%), by Country 2025 & 2033
- Figure 35: Asia Pacific Shipbroking Market Revenue (Million), by Type 2025 & 2033
- Figure 36: Asia Pacific Shipbroking Market Volume (Billion), by Type 2025 & 2033
- Figure 37: Asia Pacific Shipbroking Market Revenue Share (%), by Type 2025 & 2033
- Figure 38: Asia Pacific Shipbroking Market Volume Share (%), by Type 2025 & 2033
- Figure 39: Asia Pacific Shipbroking Market Revenue (Million), by Service 2025 & 2033
- Figure 40: Asia Pacific Shipbroking Market Volume (Billion), by Service 2025 & 2033
- Figure 41: Asia Pacific Shipbroking Market Revenue Share (%), by Service 2025 & 2033
- Figure 42: Asia Pacific Shipbroking Market Volume Share (%), by Service 2025 & 2033
- Figure 43: Asia Pacific Shipbroking Market Revenue (Million), by Industry 2025 & 2033
- Figure 44: Asia Pacific Shipbroking Market Volume (Billion), by Industry 2025 & 2033
- Figure 45: Asia Pacific Shipbroking Market Revenue Share (%), by Industry 2025 & 2033
- Figure 46: Asia Pacific Shipbroking Market Volume Share (%), by Industry 2025 & 2033
- Figure 47: Asia Pacific Shipbroking Market Revenue (Million), by Country 2025 & 2033
- Figure 48: Asia Pacific Shipbroking Market Volume (Billion), by Country 2025 & 2033
- Figure 49: Asia Pacific Shipbroking Market Revenue Share (%), by Country 2025 & 2033
- Figure 50: Asia Pacific Shipbroking Market Volume Share (%), by Country 2025 & 2033
- Figure 51: South America Shipbroking Market Revenue (Million), by Type 2025 & 2033
- Figure 52: South America Shipbroking Market Volume (Billion), by Type 2025 & 2033
- Figure 53: South America Shipbroking Market Revenue Share (%), by Type 2025 & 2033
- Figure 54: South America Shipbroking Market Volume Share (%), by Type 2025 & 2033
- Figure 55: South America Shipbroking Market Revenue (Million), by Service 2025 & 2033
- Figure 56: South America Shipbroking Market Volume (Billion), by Service 2025 & 2033
- Figure 57: South America Shipbroking Market Revenue Share (%), by Service 2025 & 2033
- Figure 58: South America Shipbroking Market Volume Share (%), by Service 2025 & 2033
- Figure 59: South America Shipbroking Market Revenue (Million), by Industry 2025 & 2033
- Figure 60: South America Shipbroking Market Volume (Billion), by Industry 2025 & 2033
- Figure 61: South America Shipbroking Market Revenue Share (%), by Industry 2025 & 2033
- Figure 62: South America Shipbroking Market Volume Share (%), by Industry 2025 & 2033
- Figure 63: South America Shipbroking Market Revenue (Million), by Country 2025 & 2033
- Figure 64: South America Shipbroking Market Volume (Billion), by Country 2025 & 2033
- Figure 65: South America Shipbroking Market Revenue Share (%), by Country 2025 & 2033
- Figure 66: South America Shipbroking Market Volume Share (%), by Country 2025 & 2033
- Figure 67: Middle East and Africa Shipbroking Market Revenue (Million), by Type 2025 & 2033
- Figure 68: Middle East and Africa Shipbroking Market Volume (Billion), by Type 2025 & 2033
- Figure 69: Middle East and Africa Shipbroking Market Revenue Share (%), by Type 2025 & 2033
- Figure 70: Middle East and Africa Shipbroking Market Volume Share (%), by Type 2025 & 2033
- Figure 71: Middle East and Africa Shipbroking Market Revenue (Million), by Service 2025 & 2033
- Figure 72: Middle East and Africa Shipbroking Market Volume (Billion), by Service 2025 & 2033
- Figure 73: Middle East and Africa Shipbroking Market Revenue Share (%), by Service 2025 & 2033
- Figure 74: Middle East and Africa Shipbroking Market Volume Share (%), by Service 2025 & 2033
- Figure 75: Middle East and Africa Shipbroking Market Revenue (Million), by Industry 2025 & 2033
- Figure 76: Middle East and Africa Shipbroking Market Volume (Billion), by Industry 2025 & 2033
- Figure 77: Middle East and Africa Shipbroking Market Revenue Share (%), by Industry 2025 & 2033
- Figure 78: Middle East and Africa Shipbroking Market Volume Share (%), by Industry 2025 & 2033
- Figure 79: Middle East and Africa Shipbroking Market Revenue (Million), by Country 2025 & 2033
- Figure 80: Middle East and Africa Shipbroking Market Volume (Billion), by Country 2025 & 2033
- Figure 81: Middle East and Africa Shipbroking Market Revenue Share (%), by Country 2025 & 2033
- Figure 82: Middle East and Africa Shipbroking Market Volume Share (%), by Country 2025 & 2033
List of Tables
- Table 1: Global Shipbroking Market Revenue Million Forecast, by Type 2020 & 2033
- Table 2: Global Shipbroking Market Volume Billion Forecast, by Type 2020 & 2033
- Table 3: Global Shipbroking Market Revenue Million Forecast, by Service 2020 & 2033
- Table 4: Global Shipbroking Market Volume Billion Forecast, by Service 2020 & 2033
- Table 5: Global Shipbroking Market Revenue Million Forecast, by Industry 2020 & 2033
- Table 6: Global Shipbroking Market Volume Billion Forecast, by Industry 2020 & 2033
- Table 7: Global Shipbroking Market Revenue Million Forecast, by Region 2020 & 2033
- Table 8: Global Shipbroking Market Volume Billion Forecast, by Region 2020 & 2033
- Table 9: Global Shipbroking Market Revenue Million Forecast, by Type 2020 & 2033
- Table 10: Global Shipbroking Market Volume Billion Forecast, by Type 2020 & 2033
- Table 11: Global Shipbroking Market Revenue Million Forecast, by Service 2020 & 2033
- Table 12: Global Shipbroking Market Volume Billion Forecast, by Service 2020 & 2033
- Table 13: Global Shipbroking Market Revenue Million Forecast, by Industry 2020 & 2033
- Table 14: Global Shipbroking Market Volume Billion Forecast, by Industry 2020 & 2033
- Table 15: Global Shipbroking Market Revenue Million Forecast, by Country 2020 & 2033
- Table 16: Global Shipbroking Market Volume Billion Forecast, by Country 2020 & 2033
- Table 17: United States Shipbroking Market Revenue (Million) Forecast, by Application 2020 & 2033
- Table 18: United States Shipbroking Market Volume (Billion) Forecast, by Application 2020 & 2033
- Table 19: Canada Shipbroking Market Revenue (Million) Forecast, by Application 2020 & 2033
- Table 20: Canada Shipbroking Market Volume (Billion) Forecast, by Application 2020 & 2033
- Table 21: Rest of North America Shipbroking Market Revenue (Million) Forecast, by Application 2020 & 2033
- Table 22: Rest of North America Shipbroking Market Volume (Billion) Forecast, by Application 2020 & 2033
- Table 23: Global Shipbroking Market Revenue Million Forecast, by Type 2020 & 2033
- Table 24: Global Shipbroking Market Volume Billion Forecast, by Type 2020 & 2033
- Table 25: Global Shipbroking Market Revenue Million Forecast, by Service 2020 & 2033
- Table 26: Global Shipbroking Market Volume Billion Forecast, by Service 2020 & 2033
- Table 27: Global Shipbroking Market Revenue Million Forecast, by Industry 2020 & 2033
- Table 28: Global Shipbroking Market Volume Billion Forecast, by Industry 2020 & 2033
- Table 29: Global Shipbroking Market Revenue Million Forecast, by Country 2020 & 2033
- Table 30: Global Shipbroking Market Volume Billion Forecast, by Country 2020 & 2033
- Table 31: Germany Shipbroking Market Revenue (Million) Forecast, by Application 2020 & 2033
- Table 32: Germany Shipbroking Market Volume (Billion) Forecast, by Application 2020 & 2033
- Table 33: United Kingdom Shipbroking Market Revenue (Million) Forecast, by Application 2020 & 2033
- Table 34: United Kingdom Shipbroking Market Volume (Billion) Forecast, by Application 2020 & 2033
- Table 35: France Shipbroking Market Revenue (Million) Forecast, by Application 2020 & 2033
- Table 36: France Shipbroking Market Volume (Billion) Forecast, by Application 2020 & 2033
- Table 37: Russia Shipbroking Market Revenue (Million) Forecast, by Application 2020 & 2033
- Table 38: Russia Shipbroking Market Volume (Billion) Forecast, by Application 2020 & 2033
- Table 39: Spain Shipbroking Market Revenue (Million) Forecast, by Application 2020 & 2033
- Table 40: Spain Shipbroking Market Volume (Billion) Forecast, by Application 2020 & 2033
- Table 41: Rest of Europe Shipbroking Market Revenue (Million) Forecast, by Application 2020 & 2033
- Table 42: Rest of Europe Shipbroking Market Volume (Billion) Forecast, by Application 2020 & 2033
- Table 43: Global Shipbroking Market Revenue Million Forecast, by Type 2020 & 2033
- Table 44: Global Shipbroking Market Volume Billion Forecast, by Type 2020 & 2033
- Table 45: Global Shipbroking Market Revenue Million Forecast, by Service 2020 & 2033
- Table 46: Global Shipbroking Market Volume Billion Forecast, by Service 2020 & 2033
- Table 47: Global Shipbroking Market Revenue Million Forecast, by Industry 2020 & 2033
- Table 48: Global Shipbroking Market Volume Billion Forecast, by Industry 2020 & 2033
- Table 49: Global Shipbroking Market Revenue Million Forecast, by Country 2020 & 2033
- Table 50: Global Shipbroking Market Volume Billion Forecast, by Country 2020 & 2033
- Table 51: India Shipbroking Market Revenue (Million) Forecast, by Application 2020 & 2033
- Table 52: India Shipbroking Market Volume (Billion) Forecast, by Application 2020 & 2033
- Table 53: China Shipbroking Market Revenue (Million) Forecast, by Application 2020 & 2033
- Table 54: China Shipbroking Market Volume (Billion) Forecast, by Application 2020 & 2033
- Table 55: Japan Shipbroking Market Revenue (Million) Forecast, by Application 2020 & 2033
- Table 56: Japan Shipbroking Market Volume (Billion) Forecast, by Application 2020 & 2033
- Table 57: Rest of Asia Pacific Shipbroking Market Revenue (Million) Forecast, by Application 2020 & 2033
- Table 58: Rest of Asia Pacific Shipbroking Market Volume (Billion) Forecast, by Application 2020 & 2033
- Table 59: Global Shipbroking Market Revenue Million Forecast, by Type 2020 & 2033
- Table 60: Global Shipbroking Market Volume Billion Forecast, by Type 2020 & 2033
- Table 61: Global Shipbroking Market Revenue Million Forecast, by Service 2020 & 2033
- Table 62: Global Shipbroking Market Volume Billion Forecast, by Service 2020 & 2033
- Table 63: Global Shipbroking Market Revenue Million Forecast, by Industry 2020 & 2033
- Table 64: Global Shipbroking Market Volume Billion Forecast, by Industry 2020 & 2033
- Table 65: Global Shipbroking Market Revenue Million Forecast, by Country 2020 & 2033
- Table 66: Global Shipbroking Market Volume Billion Forecast, by Country 2020 & 2033
- Table 67: Brazil Shipbroking Market Revenue (Million) Forecast, by Application 2020 & 2033
- Table 68: Brazil Shipbroking Market Volume (Billion) Forecast, by Application 2020 & 2033
- Table 69: Argentina Shipbroking Market Revenue (Million) Forecast, by Application 2020 & 2033
- Table 70: Argentina Shipbroking Market Volume (Billion) Forecast, by Application 2020 & 2033
- Table 71: Rest of South America Shipbroking Market Revenue (Million) Forecast, by Application 2020 & 2033
- Table 72: Rest of South America Shipbroking Market Volume (Billion) Forecast, by Application 2020 & 2033
- Table 73: Global Shipbroking Market Revenue Million Forecast, by Type 2020 & 2033
- Table 74: Global Shipbroking Market Volume Billion Forecast, by Type 2020 & 2033
- Table 75: Global Shipbroking Market Revenue Million Forecast, by Service 2020 & 2033
- Table 76: Global Shipbroking Market Volume Billion Forecast, by Service 2020 & 2033
- Table 77: Global Shipbroking Market Revenue Million Forecast, by Industry 2020 & 2033
- Table 78: Global Shipbroking Market Volume Billion Forecast, by Industry 2020 & 2033
- Table 79: Global Shipbroking Market Revenue Million Forecast, by Country 2020 & 2033
- Table 80: Global Shipbroking Market Volume Billion Forecast, by Country 2020 & 2033
- Table 81: United Arab Emirates Shipbroking Market Revenue (Million) Forecast, by Application 2020 & 2033
- Table 82: United Arab Emirates Shipbroking Market Volume (Billion) Forecast, by Application 2020 & 2033
- Table 83: Saudi Arabia Shipbroking Market Revenue (Million) Forecast, by Application 2020 & 2033
- Table 84: Saudi Arabia Shipbroking Market Volume (Billion) Forecast, by Application 2020 & 2033
- Table 85: Rest of Middle East and Africa Shipbroking Market Revenue (Million) Forecast, by Application 2020 & 2033
- Table 86: Rest of Middle East and Africa Shipbroking Market Volume (Billion) Forecast, by Application 2020 & 2033
Frequently Asked Questions
1. What is the projected Compound Annual Growth Rate (CAGR) of the Shipbroking Market?
The projected CAGR is approximately 3.65%.
2. Which companies are prominent players in the Shipbroking Market?
Key companies in the market include Aries Shipbroking (Asia) Pte Ltd, BRS Group, Braemar Shipping Services PLC, Clarkson PLC, Howe Robinson Partners, Simpson Spense Young, Fearnleys A/S, ACM Shipping Group PLC, Chowgule Brothers Pvt Ltd, Affinity (Shipping) LLP**List Not Exhaustive.
3. What are the main segments of the Shipbroking Market?
The market segments include Type, Service, Industry.
4. Can you provide details about the market size?
The market size is estimated to be USD 1.49 Million as of 2022.
5. What are some drivers contributing to market growth?
Rise in Maritime Transport is Driving the Market; The Increasing Interconnectedness of Global Markets.
6. What are the notable trends driving market growth?
Rise in Oil and Gas Industry is Driving the Shipbroking Market.
7. Are there any restraints impacting market growth?
Rise in Maritime Transport is Driving the Market; The Increasing Interconnectedness of Global Markets.
8. Can you provide examples of recent developments in the market?
January 2024: The Danish shipping giant Maersk announced a significant long-term collaboration with its German counterpart, Hapag-Lloyd, consolidating hundreds of vessels under this partnership.September 2023: Global container liner shipping business ZIM Integrated Shipping Services Ltd signed a new operational collaboration agreement spanning many trades with MSC, the industry leader. This partnership is intended to improve service standards for ZIM's esteemed clientele and greatly increase operating efficiencies.
9. What pricing options are available for accessing the report?
Pricing options include single-user, multi-user, and enterprise licenses priced at USD 4750, USD 5250, and USD 8750 respectively.
10. Is the market size provided in terms of value or volume?
The market size is provided in terms of value, measured in Million and volume, measured in Billion.
11. Are there any specific market keywords associated with the report?
Yes, the market keyword associated with the report is "Shipbroking Market," which aids in identifying and referencing the specific market segment covered.
12. How do I determine which pricing option suits my needs best?
The pricing options vary based on user requirements and access needs. Individual users may opt for single-user licenses, while businesses requiring broader access may choose multi-user or enterprise licenses for cost-effective access to the report.
13. Are there any additional resources or data provided in the Shipbroking Market report?
While the report offers comprehensive insights, it's advisable to review the specific contents or supplementary materials provided to ascertain if additional resources or data are available.
14. How can I stay updated on further developments or reports in the Shipbroking Market?
To stay informed about further developments, trends, and reports in the Shipbroking Market, consider subscribing to industry newsletters, following relevant companies and organizations, or regularly checking reputable industry news sources and publications.
Methodology
Step 1 - Identification of Relevant Samples Size from Population Database


Step 2 - Approaches for Defining Global Market Size (Value, Volume* & Price*)

Note*: In applicable scenarios
Step 3 - Data Sources
Primary Research
- Web Analytics
- Survey Reports
- Research Institute
- Latest Research Reports
- Opinion Leaders
Secondary Research
- Annual Reports
- White Paper
- Latest Press Release
- Industry Association
- Paid Database
- Investor Presentations

Step 4 - Data Triangulation
Involves using different sources of information in order to increase the validity of a study
These sources are likely to be stakeholders in a program - participants, other researchers, program staff, other community members, and so on.
Then we put all data in single framework & apply various statistical tools to find out the dynamic on the market.
During the analysis stage, feedback from the stakeholder groups would be compared to determine areas of agreement as well as areas of divergence