

Key Insights
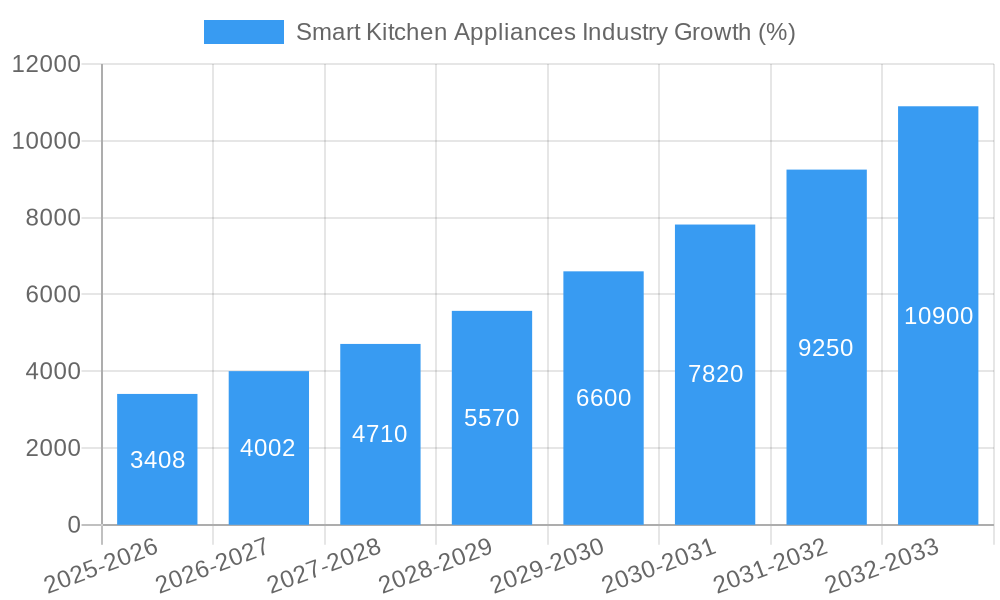
The global smart kitchen appliances market is experiencing robust growth, projected to reach \$20.44 billion in 2025 and exhibiting a Compound Annual Growth Rate (CAGR) of 16.83% from 2025 to 2033. This expansion is driven by several key factors. Increasing consumer disposable incomes, particularly in developing economies, fuel demand for technologically advanced and convenient appliances. The growing adoption of smart home technology and the integration of smart kitchen appliances into broader ecosystems further contribute to market growth. Consumers are increasingly seeking convenience, energy efficiency, and improved food management capabilities, all of which smart appliances offer. The rise of connected homes and the availability of sophisticated features like remote control, automated cooking functions, and intelligent inventory management are significant drivers. Furthermore, manufacturers are constantly innovating, introducing new features and functionalities to enhance user experience and appeal to a wider consumer base. This includes improvements in appliance design, user interfaces, and integration with popular smart home platforms.
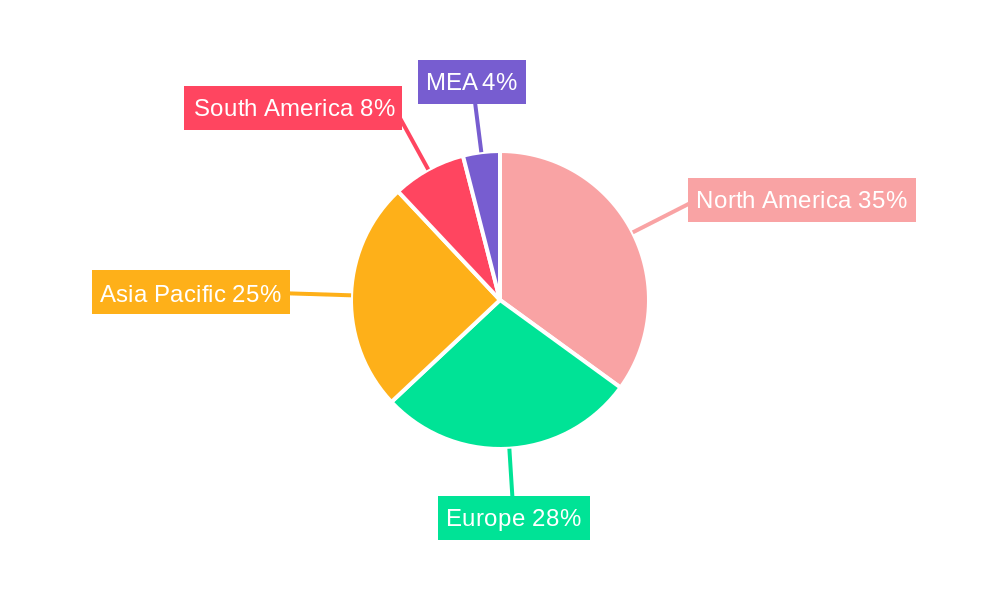
However, certain challenges remain. High initial costs of smart kitchen appliances compared to traditional models can act as a restraint, particularly for price-sensitive consumers. Concerns surrounding data privacy and security related to connected appliances also represent a potential barrier to market penetration. The complexity of integration with existing home networks and the need for reliable internet connectivity in all areas can limit adoption. Despite these challenges, the market's overall growth trajectory remains positive, fuelled by the increasing demand for advanced features, convenience, and seamless integration within the smart home ecosystem. The market segmentation, including product types (smart ovens, refrigerators, dishwashers, etc.), distribution channels (online, retail), and end-users (residential, commercial), offers various avenues for growth and specialized market approaches. North America and Asia-Pacific are currently leading regions, but growth opportunities exist across all geographical segments.
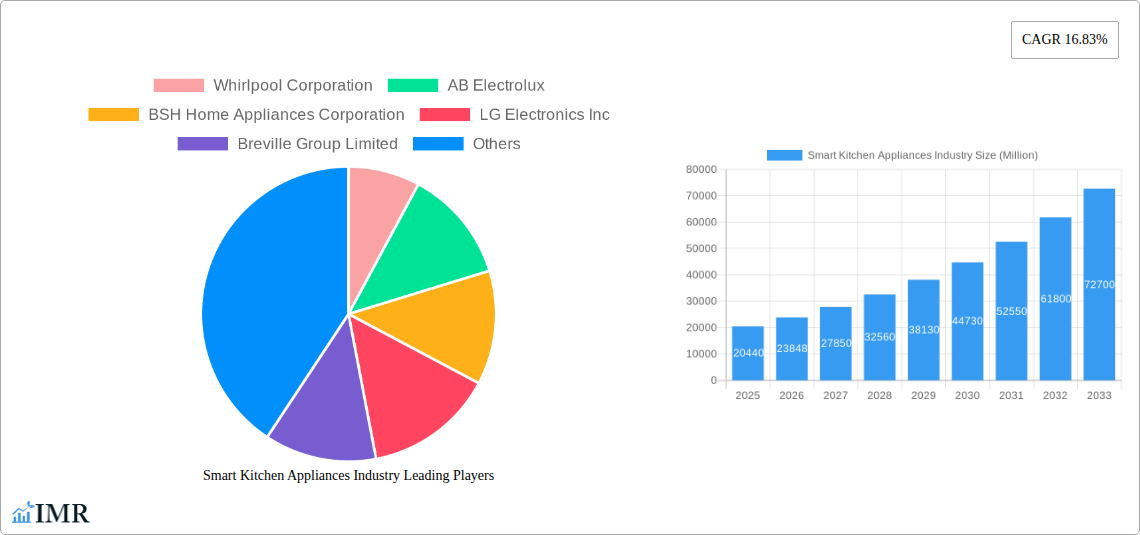
Smart Kitchen Appliances Industry Market Report: 2019-2033
This comprehensive report provides an in-depth analysis of the global smart kitchen appliances market, encompassing market dynamics, growth trends, regional dominance, product landscape, key players, and future outlook. The study period covers 2019-2033, with a focus on the estimated year 2025 and a forecast period of 2025-2033. The report segments the market by product type (smart ovens, smart dishwashers, smart refrigerators, smart cookware and cooktops, smart scales and thermometers, and other product types), distribution channel (multi-brand stores, exclusive stores, online, and other distribution channels), and end-user (residential and commercial). Key players analyzed include Whirlpool Corporation, AB Electrolux, BSH Home Appliances Corporation, LG Electronics Inc, Breville Group Limited, Miele, Samsung Electronics Co Ltd, Haier Group, Philips, and Panasonic Corporation. The report is essential for industry professionals, investors, and anyone seeking a comprehensive understanding of this rapidly evolving market. The report projects a market size of xx Million units by 2033.
Smart Kitchen Appliances Industry Market Dynamics & Structure
The smart kitchen appliances market is characterized by moderate concentration, with a few major players holding significant market share. Technological innovation, particularly in areas like AI, connectivity, and energy efficiency, is a primary growth driver. Stringent safety and energy efficiency regulations influence product design and manufacturing. Competitive substitutes include traditional kitchen appliances and emerging technologies. End-user demographics, particularly the growing millennial and Gen Z populations with higher disposable incomes and a preference for smart technology, fuel market expansion. M&A activity is expected to remain steady, with larger players seeking to acquire smaller, innovative companies to expand their product portfolios and technological capabilities.
- Market Concentration: Moderately concentrated, with top 5 players holding approximately xx% market share in 2025.
- Technological Innovation: AI-powered features, smart connectivity, and energy-efficient designs are key innovation drivers.
- Regulatory Frameworks: Safety and energy efficiency standards influence product development and market access.
- Competitive Substitutes: Traditional appliances and emerging technologies pose competitive challenges.
- End-User Demographics: Growing millennial and Gen Z populations drive demand for smart features and convenience.
- M&A Trends: Steady M&A activity is anticipated, with larger companies focusing on acquisitions to expand product offerings and enhance technological capabilities. xx M&A deals are projected between 2025 and 2033.
Smart Kitchen Appliances Industry Growth Trends & Insights
The smart kitchen appliances market exhibits robust growth, driven by increasing consumer adoption of smart home technologies and the desire for convenience and efficiency. Market size evolution shows a significant expansion from xx Million units in 2019 to an estimated xx Million units in 2025. Technological disruptions, such as the integration of AI and IoT, have significantly impacted consumer behavior, leading to a preference for smart, connected appliances. The adoption rate of smart kitchen appliances is rapidly increasing, with a projected CAGR of xx% during the forecast period (2025-2033). Consumer behavior shifts towards personalization and sustainability are also contributing to market growth. Market penetration is expected to reach xx% by 2033.
Dominant Regions, Countries, or Segments in Smart Kitchen Appliances Industry
North America and Western Europe currently dominate the smart kitchen appliances market, owing to high consumer disposable incomes, early adoption of smart home technologies, and strong established distribution networks. However, the Asia-Pacific region is expected to witness the fastest growth rate due to rising urbanization, expanding middle class, and increased smartphone penetration. Within product types, smart refrigerators lead the market in terms of volume, followed by smart ovens and smart dishwashers. Online distribution channels are experiencing rapid growth, driven by the convenience and reach offered by e-commerce platforms. Residential end-users constitute the largest segment, but commercial applications are emerging as a significant growth opportunity.
- Key Drivers:
- North America & Western Europe: High disposable incomes, early adoption of smart home technologies, established distribution networks.
- Asia-Pacific: Rising urbanization, expanding middle class, increasing smartphone penetration.
- Product Type: Smart Refrigerators (xx Million units in 2025), Smart Ovens (xx Million units in 2025), Smart Dishwashers (xx Million units in 2025)
- Distribution Channel: Online sales are experiencing significant growth.
- End-User: Residential segment dominates, but commercial applications are showing strong growth potential.
Smart Kitchen Appliances Industry Product Landscape
Smart kitchen appliances are increasingly incorporating advanced features such as AI-powered cooking assistance, voice control, smart connectivity, and energy-efficient designs. Unique selling propositions include personalized cooking experiences, enhanced convenience, seamless integration with other smart home devices, and remote monitoring and control capabilities. Technological advancements are focused on improving user experience, optimizing energy consumption, and enhancing food safety. The integration of IoT and cloud connectivity enables remote monitoring and control, providing users with greater flexibility and convenience.
Key Drivers, Barriers & Challenges in Smart Kitchen Appliances Industry
Key Drivers: Technological advancements (AI, IoT, connectivity), increasing consumer disposable incomes, growing preference for convenience and personalization, and government initiatives promoting energy efficiency drive market growth. For example, the increasing popularity of smart home ecosystems is a major driver.
Key Challenges: High initial cost of smart appliances, concerns about data security and privacy, complexity of integration with existing kitchen infrastructure, and supply chain disruptions pose significant challenges. For instance, the semiconductor shortage impacted production in 2022, resulting in a xx% decrease in production.
Emerging Opportunities in Smart Kitchen Appliances Industry
Untapped markets in developing economies, innovative applications in commercial kitchens (restaurants, hotels), integration with health and wellness apps, and the development of sustainable and eco-friendly smart appliances present significant opportunities. The integration of augmented reality (AR) and virtual reality (VR) for enhanced user experience offers a further avenue for growth.
Growth Accelerators in the Smart Kitchen Appliances Industry
Technological breakthroughs in AI, IoT, and energy efficiency, strategic partnerships between appliance manufacturers and software/technology companies, and aggressive market expansion into developing countries will fuel long-term growth. Furthermore, the development of subscription-based services that offer ongoing support and feature updates will generate recurring revenue streams.
Key Players Shaping the Smart Kitchen Appliances Industry Market
- Whirlpool Corporation
- AB Electrolux
- BSH Home Appliances Corporation
- LG Electronics Inc
- Breville Group Limited
- Miele
- Samsung Electronics Co Ltd
- Haier Group
- Philips
- Panasonic Corporation
Notable Milestones in Smart Kitchen Appliances Industry Sector
- May 2023: LG Electronics launched the InstaView refrigerator with customizable color-changing door panels, offering up to 190,000 color combinations. This significantly enhances personalization options.
- January 2023: Samsung Electronics introduced enhancements to its Bespoke Home series, focusing on personalization and enhanced connectivity for sustainable practices. This includes new refrigerator models and AI Pro Cooking capabilities for the Bespoke AI Oven.
In-Depth Smart Kitchen Appliances Industry Market Outlook
The smart kitchen appliances market is poised for continued robust growth, driven by technological innovation, evolving consumer preferences, and expansion into new markets. Strategic partnerships, focus on sustainable solutions, and the development of innovative features will be crucial for success. The market offers significant opportunities for companies that can effectively integrate smart technology with consumer needs and lifestyle preferences. The forecast suggests a strong potential for market expansion, particularly in emerging economies and within the commercial sector.
Smart Kitchen Appliances Industry Segmentation
-
1. Product Type
- 1.1. Smart Ovens
- 1.2. Smart Dishwashers
- 1.3. Smart Refrigerators
- 1.4. Smart Cookware and Cooktops
- 1.5. Smart Scale and Thermometers
- 1.6. Other Product Types
-
2. Distribution Channel
- 2.1. Multi-brand Stores
- 2.2. Exclusive Stores
- 2.3. Online
- 2.4. Other Distribution Channels
-
3. End User
- 3.1. Residential
- 3.2. Commercial
Smart Kitchen Appliances Industry Segmentation By Geography
- 1. North America
- 2. Europe
- 3. Asia Pacific
- 4. South America
- 5. Middle East
Smart Kitchen Appliances Industry REPORT HIGHLIGHTS
| Aspects | Details |
|---|---|
| Study Period | 2019-2033 |
| Base Year | 2024 |
| Estimated Year | 2025 |
| Forecast Period | 2025-2033 |
| Historical Period | 2019-2024 |
| Growth Rate | CAGR of 16.83% from 2019-2033 |
| Segmentation |
|
Table of Contents
- 1. Introduction
- 1.1. Research Scope
- 1.2. Market Segmentation
- 1.3. Research Methodology
- 1.4. Definitions and Assumptions
- 2. Executive Summary
- 2.1. Introduction
- 3. Market Dynamics
- 3.1. Introduction
- 3.2. Market Drivers
- 3.2.1. The Growth in the Hospitality Sector is Shifting to Commercial Smart Kitchen Appliances; Surge in Urban Population and Rise in Expenditure on Home Renovations Driving Market Growth
- 3.3. Market Restrains
- 3.3.1. Concerns About Data Privacy Among End Users Can Impedes Market Growth; High Cost of Maintenance and Upkeep
- 3.4. Market Trends
- 3.4.1. The Rising Adoption of Artificial Intelligence in Smart Kitchen Appliances
- 4. Market Factor Analysis
- 4.1. Porters Five Forces
- 4.2. Supply/Value Chain
- 4.3. PESTEL analysis
- 4.4. Market Entropy
- 4.5. Patent/Trademark Analysis
- 5. Global Smart Kitchen Appliances Industry Analysis, Insights and Forecast, 2019-2031
- 5.1. Market Analysis, Insights and Forecast - by Product Type
- 5.1.1. Smart Ovens
- 5.1.2. Smart Dishwashers
- 5.1.3. Smart Refrigerators
- 5.1.4. Smart Cookware and Cooktops
- 5.1.5. Smart Scale and Thermometers
- 5.1.6. Other Product Types
- 5.2. Market Analysis, Insights and Forecast - by Distribution Channel
- 5.2.1. Multi-brand Stores
- 5.2.2. Exclusive Stores
- 5.2.3. Online
- 5.2.4. Other Distribution Channels
- 5.3. Market Analysis, Insights and Forecast - by End User
- 5.3.1. Residential
- 5.3.2. Commercial
- 5.4. Market Analysis, Insights and Forecast - by Region
- 5.4.1. North America
- 5.4.2. Europe
- 5.4.3. Asia Pacific
- 5.4.4. South America
- 5.4.5. Middle East
- 5.1. Market Analysis, Insights and Forecast - by Product Type
- 6. North America Smart Kitchen Appliances Industry Analysis, Insights and Forecast, 2019-2031
- 6.1. Market Analysis, Insights and Forecast - by Product Type
- 6.1.1. Smart Ovens
- 6.1.2. Smart Dishwashers
- 6.1.3. Smart Refrigerators
- 6.1.4. Smart Cookware and Cooktops
- 6.1.5. Smart Scale and Thermometers
- 6.1.6. Other Product Types
- 6.2. Market Analysis, Insights and Forecast - by Distribution Channel
- 6.2.1. Multi-brand Stores
- 6.2.2. Exclusive Stores
- 6.2.3. Online
- 6.2.4. Other Distribution Channels
- 6.3. Market Analysis, Insights and Forecast - by End User
- 6.3.1. Residential
- 6.3.2. Commercial
- 6.1. Market Analysis, Insights and Forecast - by Product Type
- 7. Europe Smart Kitchen Appliances Industry Analysis, Insights and Forecast, 2019-2031
- 7.1. Market Analysis, Insights and Forecast - by Product Type
- 7.1.1. Smart Ovens
- 7.1.2. Smart Dishwashers
- 7.1.3. Smart Refrigerators
- 7.1.4. Smart Cookware and Cooktops
- 7.1.5. Smart Scale and Thermometers
- 7.1.6. Other Product Types
- 7.2. Market Analysis, Insights and Forecast - by Distribution Channel
- 7.2.1. Multi-brand Stores
- 7.2.2. Exclusive Stores
- 7.2.3. Online
- 7.2.4. Other Distribution Channels
- 7.3. Market Analysis, Insights and Forecast - by End User
- 7.3.1. Residential
- 7.3.2. Commercial
- 7.1. Market Analysis, Insights and Forecast - by Product Type
- 8. Asia Pacific Smart Kitchen Appliances Industry Analysis, Insights and Forecast, 2019-2031
- 8.1. Market Analysis, Insights and Forecast - by Product Type
- 8.1.1. Smart Ovens
- 8.1.2. Smart Dishwashers
- 8.1.3. Smart Refrigerators
- 8.1.4. Smart Cookware and Cooktops
- 8.1.5. Smart Scale and Thermometers
- 8.1.6. Other Product Types
- 8.2. Market Analysis, Insights and Forecast - by Distribution Channel
- 8.2.1. Multi-brand Stores
- 8.2.2. Exclusive Stores
- 8.2.3. Online
- 8.2.4. Other Distribution Channels
- 8.3. Market Analysis, Insights and Forecast - by End User
- 8.3.1. Residential
- 8.3.2. Commercial
- 8.1. Market Analysis, Insights and Forecast - by Product Type
- 9. South America Smart Kitchen Appliances Industry Analysis, Insights and Forecast, 2019-2031
- 9.1. Market Analysis, Insights and Forecast - by Product Type
- 9.1.1. Smart Ovens
- 9.1.2. Smart Dishwashers
- 9.1.3. Smart Refrigerators
- 9.1.4. Smart Cookware and Cooktops
- 9.1.5. Smart Scale and Thermometers
- 9.1.6. Other Product Types
- 9.2. Market Analysis, Insights and Forecast - by Distribution Channel
- 9.2.1. Multi-brand Stores
- 9.2.2. Exclusive Stores
- 9.2.3. Online
- 9.2.4. Other Distribution Channels
- 9.3. Market Analysis, Insights and Forecast - by End User
- 9.3.1. Residential
- 9.3.2. Commercial
- 9.1. Market Analysis, Insights and Forecast - by Product Type
- 10. Middle East Smart Kitchen Appliances Industry Analysis, Insights and Forecast, 2019-2031
- 10.1. Market Analysis, Insights and Forecast - by Product Type
- 10.1.1. Smart Ovens
- 10.1.2. Smart Dishwashers
- 10.1.3. Smart Refrigerators
- 10.1.4. Smart Cookware and Cooktops
- 10.1.5. Smart Scale and Thermometers
- 10.1.6. Other Product Types
- 10.2. Market Analysis, Insights and Forecast - by Distribution Channel
- 10.2.1. Multi-brand Stores
- 10.2.2. Exclusive Stores
- 10.2.3. Online
- 10.2.4. Other Distribution Channels
- 10.3. Market Analysis, Insights and Forecast - by End User
- 10.3.1. Residential
- 10.3.2. Commercial
- 10.1. Market Analysis, Insights and Forecast - by Product Type
- 11. North America Smart Kitchen Appliances Industry Analysis, Insights and Forecast, 2019-2031
- 11.1. Market Analysis, Insights and Forecast - By Country/Sub-region
- 11.1.1 United States
- 11.1.2 Canada
- 11.1.3 Mexico
- 12. Europe Smart Kitchen Appliances Industry Analysis, Insights and Forecast, 2019-2031
- 12.1. Market Analysis, Insights and Forecast - By Country/Sub-region
- 12.1.1 Germany
- 12.1.2 United Kingdom
- 12.1.3 France
- 12.1.4 Spain
- 12.1.5 Italy
- 12.1.6 Spain
- 12.1.7 Belgium
- 12.1.8 Netherland
- 12.1.9 Nordics
- 12.1.10 Rest of Europe
- 13. Asia Pacific Smart Kitchen Appliances Industry Analysis, Insights and Forecast, 2019-2031
- 13.1. Market Analysis, Insights and Forecast - By Country/Sub-region
- 13.1.1 China
- 13.1.2 Japan
- 13.1.3 India
- 13.1.4 South Korea
- 13.1.5 Southeast Asia
- 13.1.6 Australia
- 13.1.7 Indonesia
- 13.1.8 Phillipes
- 13.1.9 Singapore
- 13.1.10 Thailandc
- 13.1.11 Rest of Asia Pacific
- 14. South America Smart Kitchen Appliances Industry Analysis, Insights and Forecast, 2019-2031
- 14.1. Market Analysis, Insights and Forecast - By Country/Sub-region
- 14.1.1 Brazil
- 14.1.2 Argentina
- 14.1.3 Peru
- 14.1.4 Chile
- 14.1.5 Colombia
- 14.1.6 Ecuador
- 14.1.7 Venezuela
- 14.1.8 Rest of South America
- 15. MEA Smart Kitchen Appliances Industry Analysis, Insights and Forecast, 2019-2031
- 15.1. Market Analysis, Insights and Forecast - By Country/Sub-region
- 15.1.1 United Arab Emirates
- 15.1.2 Saudi Arabia
- 15.1.3 South Africa
- 15.1.4 Rest of Middle East and Africa
- 16. Competitive Analysis
- 16.1. Global Market Share Analysis 2024
- 16.2. Company Profiles
- 16.2.1 Whirlpool Corporation
- 16.2.1.1. Overview
- 16.2.1.2. Products
- 16.2.1.3. SWOT Analysis
- 16.2.1.4. Recent Developments
- 16.2.1.5. Financials (Based on Availability)
- 16.2.2 AB Electrolux
- 16.2.2.1. Overview
- 16.2.2.2. Products
- 16.2.2.3. SWOT Analysis
- 16.2.2.4. Recent Developments
- 16.2.2.5. Financials (Based on Availability)
- 16.2.3 BSH Home Appliances Corporation
- 16.2.3.1. Overview
- 16.2.3.2. Products
- 16.2.3.3. SWOT Analysis
- 16.2.3.4. Recent Developments
- 16.2.3.5. Financials (Based on Availability)
- 16.2.4 LG Electronics Inc
- 16.2.4.1. Overview
- 16.2.4.2. Products
- 16.2.4.3. SWOT Analysis
- 16.2.4.4. Recent Developments
- 16.2.4.5. Financials (Based on Availability)
- 16.2.5 Breville Group Limited
- 16.2.5.1. Overview
- 16.2.5.2. Products
- 16.2.5.3. SWOT Analysis
- 16.2.5.4. Recent Developments
- 16.2.5.5. Financials (Based on Availability)
- 16.2.6 Miele
- 16.2.6.1. Overview
- 16.2.6.2. Products
- 16.2.6.3. SWOT Analysis
- 16.2.6.4. Recent Developments
- 16.2.6.5. Financials (Based on Availability)
- 16.2.7 Samsung Electronics Co Ltd
- 16.2.7.1. Overview
- 16.2.7.2. Products
- 16.2.7.3. SWOT Analysis
- 16.2.7.4. Recent Developments
- 16.2.7.5. Financials (Based on Availability)
- 16.2.8 Haier Group
- 16.2.8.1. Overview
- 16.2.8.2. Products
- 16.2.8.3. SWOT Analysis
- 16.2.8.4. Recent Developments
- 16.2.8.5. Financials (Based on Availability)
- 16.2.9 Philips
- 16.2.9.1. Overview
- 16.2.9.2. Products
- 16.2.9.3. SWOT Analysis
- 16.2.9.4. Recent Developments
- 16.2.9.5. Financials (Based on Availability)
- 16.2.10 Panasonic Corporation
- 16.2.10.1. Overview
- 16.2.10.2. Products
- 16.2.10.3. SWOT Analysis
- 16.2.10.4. Recent Developments
- 16.2.10.5. Financials (Based on Availability)
- 16.2.1 Whirlpool Corporation
List of Figures
- Figure 1: Global Smart Kitchen Appliances Industry Revenue Breakdown (Million, %) by Region 2024 & 2032
- Figure 2: North America Smart Kitchen Appliances Industry Revenue (Million), by Country 2024 & 2032
- Figure 3: North America Smart Kitchen Appliances Industry Revenue Share (%), by Country 2024 & 2032
- Figure 4: Europe Smart Kitchen Appliances Industry Revenue (Million), by Country 2024 & 2032
- Figure 5: Europe Smart Kitchen Appliances Industry Revenue Share (%), by Country 2024 & 2032
- Figure 6: Asia Pacific Smart Kitchen Appliances Industry Revenue (Million), by Country 2024 & 2032
- Figure 7: Asia Pacific Smart Kitchen Appliances Industry Revenue Share (%), by Country 2024 & 2032
- Figure 8: South America Smart Kitchen Appliances Industry Revenue (Million), by Country 2024 & 2032
- Figure 9: South America Smart Kitchen Appliances Industry Revenue Share (%), by Country 2024 & 2032
- Figure 10: MEA Smart Kitchen Appliances Industry Revenue (Million), by Country 2024 & 2032
- Figure 11: MEA Smart Kitchen Appliances Industry Revenue Share (%), by Country 2024 & 2032
- Figure 12: North America Smart Kitchen Appliances Industry Revenue (Million), by Product Type 2024 & 2032
- Figure 13: North America Smart Kitchen Appliances Industry Revenue Share (%), by Product Type 2024 & 2032
- Figure 14: North America Smart Kitchen Appliances Industry Revenue (Million), by Distribution Channel 2024 & 2032
- Figure 15: North America Smart Kitchen Appliances Industry Revenue Share (%), by Distribution Channel 2024 & 2032
- Figure 16: North America Smart Kitchen Appliances Industry Revenue (Million), by End User 2024 & 2032
- Figure 17: North America Smart Kitchen Appliances Industry Revenue Share (%), by End User 2024 & 2032
- Figure 18: North America Smart Kitchen Appliances Industry Revenue (Million), by Country 2024 & 2032
- Figure 19: North America Smart Kitchen Appliances Industry Revenue Share (%), by Country 2024 & 2032
- Figure 20: Europe Smart Kitchen Appliances Industry Revenue (Million), by Product Type 2024 & 2032
- Figure 21: Europe Smart Kitchen Appliances Industry Revenue Share (%), by Product Type 2024 & 2032
- Figure 22: Europe Smart Kitchen Appliances Industry Revenue (Million), by Distribution Channel 2024 & 2032
- Figure 23: Europe Smart Kitchen Appliances Industry Revenue Share (%), by Distribution Channel 2024 & 2032
- Figure 24: Europe Smart Kitchen Appliances Industry Revenue (Million), by End User 2024 & 2032
- Figure 25: Europe Smart Kitchen Appliances Industry Revenue Share (%), by End User 2024 & 2032
- Figure 26: Europe Smart Kitchen Appliances Industry Revenue (Million), by Country 2024 & 2032
- Figure 27: Europe Smart Kitchen Appliances Industry Revenue Share (%), by Country 2024 & 2032
- Figure 28: Asia Pacific Smart Kitchen Appliances Industry Revenue (Million), by Product Type 2024 & 2032
- Figure 29: Asia Pacific Smart Kitchen Appliances Industry Revenue Share (%), by Product Type 2024 & 2032
- Figure 30: Asia Pacific Smart Kitchen Appliances Industry Revenue (Million), by Distribution Channel 2024 & 2032
- Figure 31: Asia Pacific Smart Kitchen Appliances Industry Revenue Share (%), by Distribution Channel 2024 & 2032
- Figure 32: Asia Pacific Smart Kitchen Appliances Industry Revenue (Million), by End User 2024 & 2032
- Figure 33: Asia Pacific Smart Kitchen Appliances Industry Revenue Share (%), by End User 2024 & 2032
- Figure 34: Asia Pacific Smart Kitchen Appliances Industry Revenue (Million), by Country 2024 & 2032
- Figure 35: Asia Pacific Smart Kitchen Appliances Industry Revenue Share (%), by Country 2024 & 2032
- Figure 36: South America Smart Kitchen Appliances Industry Revenue (Million), by Product Type 2024 & 2032
- Figure 37: South America Smart Kitchen Appliances Industry Revenue Share (%), by Product Type 2024 & 2032
- Figure 38: South America Smart Kitchen Appliances Industry Revenue (Million), by Distribution Channel 2024 & 2032
- Figure 39: South America Smart Kitchen Appliances Industry Revenue Share (%), by Distribution Channel 2024 & 2032
- Figure 40: South America Smart Kitchen Appliances Industry Revenue (Million), by End User 2024 & 2032
- Figure 41: South America Smart Kitchen Appliances Industry Revenue Share (%), by End User 2024 & 2032
- Figure 42: South America Smart Kitchen Appliances Industry Revenue (Million), by Country 2024 & 2032
- Figure 43: South America Smart Kitchen Appliances Industry Revenue Share (%), by Country 2024 & 2032
- Figure 44: Middle East Smart Kitchen Appliances Industry Revenue (Million), by Product Type 2024 & 2032
- Figure 45: Middle East Smart Kitchen Appliances Industry Revenue Share (%), by Product Type 2024 & 2032
- Figure 46: Middle East Smart Kitchen Appliances Industry Revenue (Million), by Distribution Channel 2024 & 2032
- Figure 47: Middle East Smart Kitchen Appliances Industry Revenue Share (%), by Distribution Channel 2024 & 2032
- Figure 48: Middle East Smart Kitchen Appliances Industry Revenue (Million), by End User 2024 & 2032
- Figure 49: Middle East Smart Kitchen Appliances Industry Revenue Share (%), by End User 2024 & 2032
- Figure 50: Middle East Smart Kitchen Appliances Industry Revenue (Million), by Country 2024 & 2032
- Figure 51: Middle East Smart Kitchen Appliances Industry Revenue Share (%), by Country 2024 & 2032
List of Tables
- Table 1: Global Smart Kitchen Appliances Industry Revenue Million Forecast, by Region 2019 & 2032
- Table 2: Global Smart Kitchen Appliances Industry Revenue Million Forecast, by Product Type 2019 & 2032
- Table 3: Global Smart Kitchen Appliances Industry Revenue Million Forecast, by Distribution Channel 2019 & 2032
- Table 4: Global Smart Kitchen Appliances Industry Revenue Million Forecast, by End User 2019 & 2032
- Table 5: Global Smart Kitchen Appliances Industry Revenue Million Forecast, by Region 2019 & 2032
- Table 6: Global Smart Kitchen Appliances Industry Revenue Million Forecast, by Country 2019 & 2032
- Table 7: United States Smart Kitchen Appliances Industry Revenue (Million) Forecast, by Application 2019 & 2032
- Table 8: Canada Smart Kitchen Appliances Industry Revenue (Million) Forecast, by Application 2019 & 2032
- Table 9: Mexico Smart Kitchen Appliances Industry Revenue (Million) Forecast, by Application 2019 & 2032
- Table 10: Global Smart Kitchen Appliances Industry Revenue Million Forecast, by Country 2019 & 2032
- Table 11: Germany Smart Kitchen Appliances Industry Revenue (Million) Forecast, by Application 2019 & 2032
- Table 12: United Kingdom Smart Kitchen Appliances Industry Revenue (Million) Forecast, by Application 2019 & 2032
- Table 13: France Smart Kitchen Appliances Industry Revenue (Million) Forecast, by Application 2019 & 2032
- Table 14: Spain Smart Kitchen Appliances Industry Revenue (Million) Forecast, by Application 2019 & 2032
- Table 15: Italy Smart Kitchen Appliances Industry Revenue (Million) Forecast, by Application 2019 & 2032
- Table 16: Spain Smart Kitchen Appliances Industry Revenue (Million) Forecast, by Application 2019 & 2032
- Table 17: Belgium Smart Kitchen Appliances Industry Revenue (Million) Forecast, by Application 2019 & 2032
- Table 18: Netherland Smart Kitchen Appliances Industry Revenue (Million) Forecast, by Application 2019 & 2032
- Table 19: Nordics Smart Kitchen Appliances Industry Revenue (Million) Forecast, by Application 2019 & 2032
- Table 20: Rest of Europe Smart Kitchen Appliances Industry Revenue (Million) Forecast, by Application 2019 & 2032
- Table 21: Global Smart Kitchen Appliances Industry Revenue Million Forecast, by Country 2019 & 2032
- Table 22: China Smart Kitchen Appliances Industry Revenue (Million) Forecast, by Application 2019 & 2032
- Table 23: Japan Smart Kitchen Appliances Industry Revenue (Million) Forecast, by Application 2019 & 2032
- Table 24: India Smart Kitchen Appliances Industry Revenue (Million) Forecast, by Application 2019 & 2032
- Table 25: South Korea Smart Kitchen Appliances Industry Revenue (Million) Forecast, by Application 2019 & 2032
- Table 26: Southeast Asia Smart Kitchen Appliances Industry Revenue (Million) Forecast, by Application 2019 & 2032
- Table 27: Australia Smart Kitchen Appliances Industry Revenue (Million) Forecast, by Application 2019 & 2032
- Table 28: Indonesia Smart Kitchen Appliances Industry Revenue (Million) Forecast, by Application 2019 & 2032
- Table 29: Phillipes Smart Kitchen Appliances Industry Revenue (Million) Forecast, by Application 2019 & 2032
- Table 30: Singapore Smart Kitchen Appliances Industry Revenue (Million) Forecast, by Application 2019 & 2032
- Table 31: Thailandc Smart Kitchen Appliances Industry Revenue (Million) Forecast, by Application 2019 & 2032
- Table 32: Rest of Asia Pacific Smart Kitchen Appliances Industry Revenue (Million) Forecast, by Application 2019 & 2032
- Table 33: Global Smart Kitchen Appliances Industry Revenue Million Forecast, by Country 2019 & 2032
- Table 34: Brazil Smart Kitchen Appliances Industry Revenue (Million) Forecast, by Application 2019 & 2032
- Table 35: Argentina Smart Kitchen Appliances Industry Revenue (Million) Forecast, by Application 2019 & 2032
- Table 36: Peru Smart Kitchen Appliances Industry Revenue (Million) Forecast, by Application 2019 & 2032
- Table 37: Chile Smart Kitchen Appliances Industry Revenue (Million) Forecast, by Application 2019 & 2032
- Table 38: Colombia Smart Kitchen Appliances Industry Revenue (Million) Forecast, by Application 2019 & 2032
- Table 39: Ecuador Smart Kitchen Appliances Industry Revenue (Million) Forecast, by Application 2019 & 2032
- Table 40: Venezuela Smart Kitchen Appliances Industry Revenue (Million) Forecast, by Application 2019 & 2032
- Table 41: Rest of South America Smart Kitchen Appliances Industry Revenue (Million) Forecast, by Application 2019 & 2032
- Table 42: Global Smart Kitchen Appliances Industry Revenue Million Forecast, by Country 2019 & 2032
- Table 43: United Arab Emirates Smart Kitchen Appliances Industry Revenue (Million) Forecast, by Application 2019 & 2032
- Table 44: Saudi Arabia Smart Kitchen Appliances Industry Revenue (Million) Forecast, by Application 2019 & 2032
- Table 45: South Africa Smart Kitchen Appliances Industry Revenue (Million) Forecast, by Application 2019 & 2032
- Table 46: Rest of Middle East and Africa Smart Kitchen Appliances Industry Revenue (Million) Forecast, by Application 2019 & 2032
- Table 47: Global Smart Kitchen Appliances Industry Revenue Million Forecast, by Product Type 2019 & 2032
- Table 48: Global Smart Kitchen Appliances Industry Revenue Million Forecast, by Distribution Channel 2019 & 2032
- Table 49: Global Smart Kitchen Appliances Industry Revenue Million Forecast, by End User 2019 & 2032
- Table 50: Global Smart Kitchen Appliances Industry Revenue Million Forecast, by Country 2019 & 2032
- Table 51: Global Smart Kitchen Appliances Industry Revenue Million Forecast, by Product Type 2019 & 2032
- Table 52: Global Smart Kitchen Appliances Industry Revenue Million Forecast, by Distribution Channel 2019 & 2032
- Table 53: Global Smart Kitchen Appliances Industry Revenue Million Forecast, by End User 2019 & 2032
- Table 54: Global Smart Kitchen Appliances Industry Revenue Million Forecast, by Country 2019 & 2032
- Table 55: Global Smart Kitchen Appliances Industry Revenue Million Forecast, by Product Type 2019 & 2032
- Table 56: Global Smart Kitchen Appliances Industry Revenue Million Forecast, by Distribution Channel 2019 & 2032
- Table 57: Global Smart Kitchen Appliances Industry Revenue Million Forecast, by End User 2019 & 2032
- Table 58: Global Smart Kitchen Appliances Industry Revenue Million Forecast, by Country 2019 & 2032
- Table 59: Global Smart Kitchen Appliances Industry Revenue Million Forecast, by Product Type 2019 & 2032
- Table 60: Global Smart Kitchen Appliances Industry Revenue Million Forecast, by Distribution Channel 2019 & 2032
- Table 61: Global Smart Kitchen Appliances Industry Revenue Million Forecast, by End User 2019 & 2032
- Table 62: Global Smart Kitchen Appliances Industry Revenue Million Forecast, by Country 2019 & 2032
- Table 63: Global Smart Kitchen Appliances Industry Revenue Million Forecast, by Product Type 2019 & 2032
- Table 64: Global Smart Kitchen Appliances Industry Revenue Million Forecast, by Distribution Channel 2019 & 2032
- Table 65: Global Smart Kitchen Appliances Industry Revenue Million Forecast, by End User 2019 & 2032
- Table 66: Global Smart Kitchen Appliances Industry Revenue Million Forecast, by Country 2019 & 2032
Frequently Asked Questions
1. What is the projected Compound Annual Growth Rate (CAGR) of the Smart Kitchen Appliances Industry?
The projected CAGR is approximately 16.83%.
2. Which companies are prominent players in the Smart Kitchen Appliances Industry?
Key companies in the market include Whirlpool Corporation, AB Electrolux, BSH Home Appliances Corporation, LG Electronics Inc, Breville Group Limited, Miele, Samsung Electronics Co Ltd, Haier Group, Philips, Panasonic Corporation.
3. What are the main segments of the Smart Kitchen Appliances Industry?
The market segments include Product Type, Distribution Channel, End User.
4. Can you provide details about the market size?
The market size is estimated to be USD 20.44 Million as of 2022.
5. What are some drivers contributing to market growth?
The Growth in the Hospitality Sector is Shifting to Commercial Smart Kitchen Appliances; Surge in Urban Population and Rise in Expenditure on Home Renovations Driving Market Growth.
6. What are the notable trends driving market growth?
The Rising Adoption of Artificial Intelligence in Smart Kitchen Appliances.
7. Are there any restraints impacting market growth?
Concerns About Data Privacy Among End Users Can Impedes Market Growth; High Cost of Maintenance and Upkeep.
8. Can you provide examples of recent developments in the market?
May 2023: LG Electronics released the InstaView refrigerator featuring door panels that can change colors, offering enhanced customization. Users can alter the colors according to their mood, with the LED panels providing access to an impressive selection of up to 190,0001 color combinations.
9. What pricing options are available for accessing the report?
Pricing options include single-user, multi-user, and enterprise licenses priced at USD 4750, USD 5250, and USD 8750 respectively.
10. Is the market size provided in terms of value or volume?
The market size is provided in terms of value, measured in Million.
11. Are there any specific market keywords associated with the report?
Yes, the market keyword associated with the report is "Smart Kitchen Appliances Industry," which aids in identifying and referencing the specific market segment covered.
12. How do I determine which pricing option suits my needs best?
The pricing options vary based on user requirements and access needs. Individual users may opt for single-user licenses, while businesses requiring broader access may choose multi-user or enterprise licenses for cost-effective access to the report.
13. Are there any additional resources or data provided in the Smart Kitchen Appliances Industry report?
While the report offers comprehensive insights, it's advisable to review the specific contents or supplementary materials provided to ascertain if additional resources or data are available.
14. How can I stay updated on further developments or reports in the Smart Kitchen Appliances Industry?
To stay informed about further developments, trends, and reports in the Smart Kitchen Appliances Industry, consider subscribing to industry newsletters, following relevant companies and organizations, or regularly checking reputable industry news sources and publications.
Methodology
Step 1 - Identification of Relevant Samples Size from Population Database


Step 2 - Approaches for Defining Global Market Size (Value, Volume* & Price*)

Note*: In applicable scenarios
Step 3 - Data Sources
Primary Research
- Web Analytics
- Survey Reports
- Research Institute
- Latest Research Reports
- Opinion Leaders
Secondary Research
- Annual Reports
- White Paper
- Latest Press Release
- Industry Association
- Paid Database
- Investor Presentations

Step 4 - Data Triangulation
Involves using different sources of information in order to increase the validity of a study
These sources are likely to be stakeholders in a program - participants, other researchers, program staff, other community members, and so on.
Then we put all data in single framework & apply various statistical tools to find out the dynamic on the market.
During the analysis stage, feedback from the stakeholder groups would be compared to determine areas of agreement as well as areas of divergence
