

Key Insights
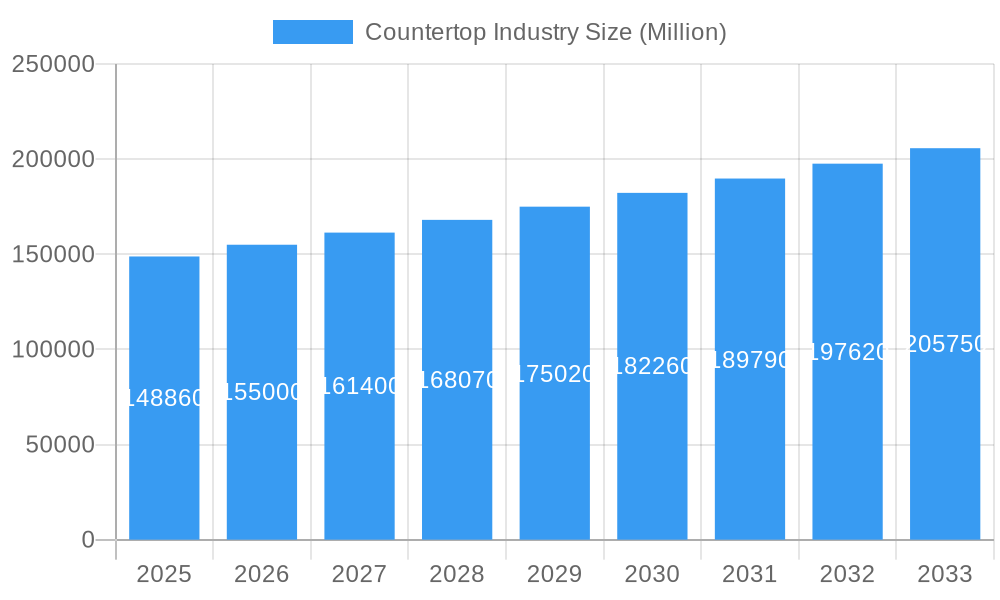
The global countertop market, valued at $148.86 billion in 2025, is projected to experience robust growth, driven by a Compound Annual Growth Rate (CAGR) of 4.22% from 2025 to 2033. This expansion is fueled by several key factors. The burgeoning construction industry, particularly in residential and commercial sectors, significantly boosts demand for countertops. Furthermore, a rising preference for aesthetically pleasing and durable kitchen and bathroom designs is driving the adoption of premium materials like quartz and granite. The increasing disposable incomes in emerging economies, coupled with a growing middle class, further fuels market expansion. Technological advancements in countertop manufacturing, leading to improved designs, enhanced performance, and cost-effectiveness, contribute to the market's positive trajectory. While fluctuating raw material prices and economic downturns pose potential restraints, the overall market outlook remains optimistic. The segment analysis reveals strong performance across various materials, with quartz and granite leading the market share, followed by solid surface and laminate. The residential sector currently dominates the end-user segment but commercial applications are steadily gaining traction, indicating diversification potential. Geographically, North America and Europe hold significant market shares, however, Asia-Pacific is expected to witness the most rapid growth, driven by urbanization and infrastructure development.
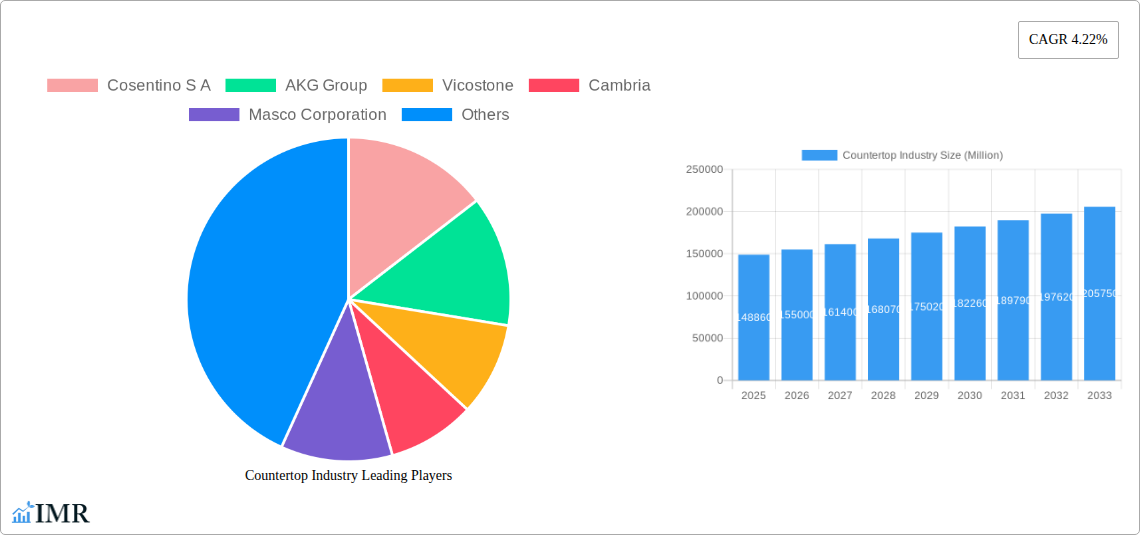
Countertop Industry Market Size (In Billion)
The competitive landscape is characterized by a mix of global giants and regional players. Companies like Cosentino, Cambria, and Caesarstone lead the market through established brand recognition, diversified product portfolios, and robust distribution networks. However, the market also features several smaller, specialized manufacturers focusing on niche material types or regional markets. This signifies opportunities for both established players through expansion and innovation and for emerging players by capitalizing on regional or material-specific demands. The increasing demand for sustainable and eco-friendly countertop options is creating further opportunities for manufacturers to develop innovative materials and processes aligned with green building practices. Future market growth will likely be influenced by factors such as technological innovation, consumer preferences for sustainability, and the global economic climate. Overall, the countertop industry displays a positive trajectory with opportunities for growth and diversification across multiple segments and geographic regions.
Countertop Industry Company Market Share
Countertop Industry Market Report: 2019-2033
This comprehensive report provides a detailed analysis of the countertop industry, encompassing market dynamics, growth trends, regional dominance, product landscape, key players, and future outlook. The report covers the period from 2019 to 2033, with a focus on the base year 2025 and a forecast period of 2025-2033. The study examines various segments, including material type (Granite, Solid Surface, Laminate, Marble, Quartz Surfaces, Other Materials), end-user (Residential, Commercial), and application type (Kitchen, Bathroom, Other Types). The analysis incorporates data on key players like Cosentino S.A., AKG Group, Vicostone, Cambria, Masco Corporation, and others, offering invaluable insights for industry professionals and investors. The total market value in 2025 is estimated at xx Million Units and is projected to reach xx Million Units by 2033.
Countertop Industry Market Dynamics & Structure
The countertop industry is characterized by moderate market concentration, with a few major players holding significant market share. Technological innovation, particularly in materials science and manufacturing processes, is a key driver. Regulatory frameworks concerning material safety and environmental impact play a crucial role. Competitive substitutes include alternative materials like wood or tile. End-user demographics, including increasing household incomes and home renovation trends, significantly influence demand. M&A activity has been moderate, with a focus on expanding product portfolios and geographical reach.
- Market Concentration: The top 5 players hold approximately xx% of the market share in 2025.
- Technological Innovation: Focus on sustainable materials, improved durability, and aesthetic designs.
- Regulatory Frameworks: Compliance with safety and environmental standards impacts production costs.
- Competitive Substitutes: The availability of alternatives limits market growth.
- M&A Activity: xx major M&A deals were recorded in the historical period (2019-2024).
Countertop Industry Growth Trends & Insights
The countertop market has witnessed consistent growth during the historical period (2019-2024), driven by increasing construction activity, rising disposable incomes, and a growing preference for home renovations. The market size grew from xx Million Units in 2019 to xx Million Units in 2024, exhibiting a CAGR of xx%. Technological advancements, like the introduction of innovative materials and manufacturing processes, have further fueled market expansion. Consumer behavior is shifting towards sustainable and aesthetically appealing countertops. The adoption rate of quartz surfaces has shown significant growth, surpassing other materials in recent years.
- Market Size Evolution: Steady growth observed from 2019-2024, with a projected continued increase.
- Adoption Rates: Quartz surfaces are experiencing the highest adoption rate.
- Technological Disruptions: Introduction of innovative materials and manufacturing processes driving growth.
- Consumer Behavior Shifts: Increased demand for sustainable and aesthetically pleasing options.
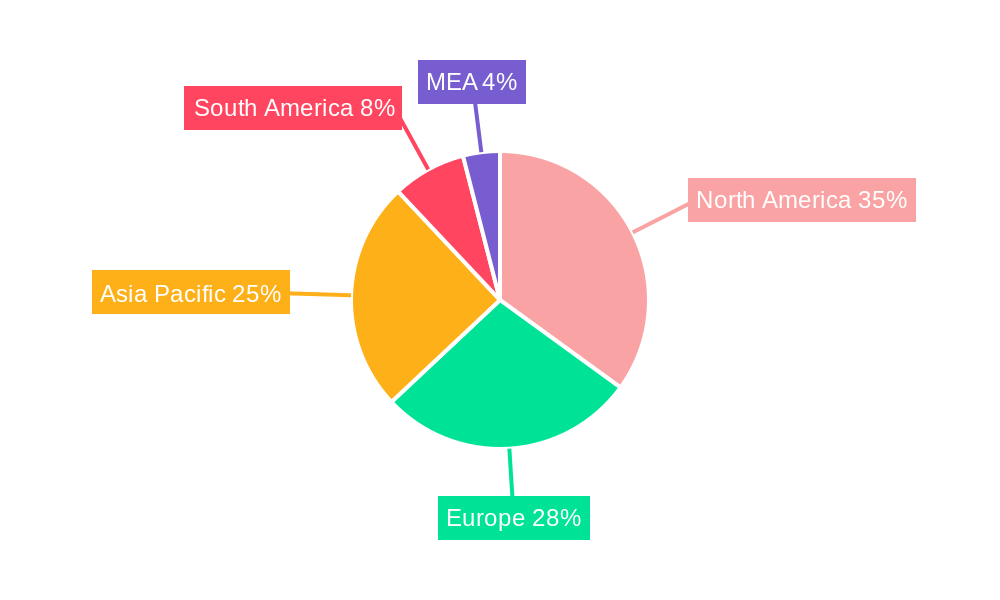
Dominant Regions, Countries, or Segments in Countertop Industry
North America and Europe represent the largest markets for countertops, driven by high construction activity and consumer spending. Within these regions, the residential segment dominates, with kitchens being the primary application. Quartz surfaces hold the largest market share among various materials due to its durability and aesthetic appeal.
- Leading Region: North America and Europe show the highest market share.
- Leading Material Segment: Quartz surfaces dominate, followed by granite and solid surfaces.
- Leading End-User Segment: The residential sector constitutes a significant portion of the market.
- Key Drivers: High disposable income, increasing construction activity, and preference for home improvement.
Countertop Industry Product Landscape
The countertop market offers a diverse range of products, each with unique features and applications. Innovations focus on enhanced durability, stain resistance, and aesthetic appeal. Advanced manufacturing techniques like digital printing enable customization and intricate designs. Unique selling propositions revolve around material properties, design flexibility, and ease of maintenance.
Key Drivers, Barriers & Challenges in Countertop Industry
Key Drivers: Rising disposable incomes, increasing construction activities (both residential and commercial), and growing preference for home renovations and kitchen/bathroom upgrades. Technological advancements in material science and manufacturing are driving the development of more durable, sustainable, and aesthetically pleasing countertops. Favorable government policies promoting sustainable building materials further boost market growth.
Key Barriers and Challenges: Fluctuations in raw material prices, supply chain disruptions, and intense competition from both domestic and international players create significant market challenges. Regulatory restrictions on certain materials and environmental concerns impact the industry. The economic slowdown can severely affect consumer spending on non-essential home improvement projects. Labor shortages and increased transportation costs add to operational challenges.
Emerging Opportunities in Countertop Industry
Untapped markets in developing economies present significant growth potential. The increasing demand for smart home technologies and integration with other smart appliances opens up new avenues for innovation. Focus on eco-friendly and recycled materials will attract environmentally conscious consumers.
Growth Accelerators in the Countertop Industry
Technological breakthroughs in materials science continue to expand possibilities, creating stronger, more durable, and aesthetically advanced countertops. Strategic partnerships between manufacturers and designers enhance product innovation and market reach. Expansion into new geographic markets, particularly developing countries with growing middle classes, offers significant growth opportunities.
Key Players Shaping the Countertop Industry Market
- Cosentino S.A.
- AKG Group
- Vicostone
- Cambria
- Masco Corporation
- ROSSKOPF + PARTNER AG
- DuPont de Nemours Inc
- ARISTECH SURFACES LLC
- STRASSER Steine GmbH
- Caesarstone Ltd
- Daltile
- Wilsonart LLC
- Asian Granito India Limited
- Pokarna Ltd
- Aro Granite Industries Ltd
Notable Milestones in Countertop Industry Sector
- August 2022: Wilsonart LLC wins KBB magazine's Readers' Choice Award for the second consecutive year.
- February 2022: Caesarstone Ltd. unveils eight new nature-inspired surfaces at KBIS.
- January 2022: Cambria introduces four new colors to its quartz countertop selection.
In-Depth Countertop Industry Market Outlook
The countertop industry is poised for continued growth driven by ongoing technological advancements, increasing consumer demand for high-quality and aesthetically pleasing surfaces, and expansion into new markets. Strategic collaborations and innovative product launches will play a significant role in shaping future market dynamics. The increasing adoption of sustainable and eco-friendly materials will further drive market expansion, creating significant opportunities for players focused on sustainability.
Countertop Industry Segmentation
-
1. Material
- 1.1. Granite
- 1.2. Solid Surface
- 1.3. Laminate
- 1.4. Marble
- 1.5. Quartz Surfaces
- 1.6. Other Materials
-
2. End User
- 2.1. Residential
- 2.2. Commercial
-
3. Type
- 3.1. Kitchen
- 3.2. Bathroom
- 3.3. Other Types
Countertop Industry Segmentation By Geography
- 1. North America
- 2. Europe
- 3. Asia Pacific
- 4. Latin America
- 5. Middle East and Africa
Countertop Industry Regional Market Share
Geographic Coverage of Countertop Industry
Countertop Industry REPORT HIGHLIGHTS
| Aspects | Details |
|---|---|
| Study Period | 2020-2034 |
| Base Year | 2025 |
| Estimated Year | 2026 |
| Forecast Period | 2026-2034 |
| Historical Period | 2020-2025 |
| Growth Rate | CAGR of 4.22% from 2020-2034 |
| Segmentation |
|
Table of Contents
- 1. Introduction
- 1.1. Research Scope
- 1.2. Market Segmentation
- 1.3. Research Objective
- 1.4. Definitions and Assumptions
- 2. Executive Summary
- 2.1. Market Snapshot
- 3. Market Dynamics
- 3.1. Market Drivers
- 3.2. Market Restrains
- 3.3. Market Trends
- 3.4. Market Opportunities
- 4. Market Factor Analysis
- 4.1. Porters Five Forces
- 4.1.1. Bargaining Power of Suppliers
- 4.1.2. Bargaining Power of Buyers
- 4.1.3. Threat of New Entrants
- 4.1.4. Threat of Substitutes
- 4.1.5. Competitive Rivalry
- 4.2. PESTEL analysis
- 4.3. BCG Analysis
- 4.3.1. Stars (High Growth, High Market Share)
- 4.3.2. Cash Cows (Low Growth, High Market Share)
- 4.3.3. Question Mark (High Growth, Low Market Share)
- 4.3.4. Dogs (Low Growth, Low Market Share)
- 4.4. Ansoff Matrix Analysis
- 4.5. Supply Chain Analysis
- 4.6. Regulatory Landscape
- 4.7. Current Market Potential and Opportunity Assessment (TAM–SAM–SOM Framework)
- 4.8. IMR Analyst Note
- 4.1. Porters Five Forces
- 5. Market Analysis, Insights and Forecast 2021-2033
- 5.1. Market Analysis, Insights and Forecast - by Material
- 5.1.1. Granite
- 5.1.2. Solid Surface
- 5.1.3. Laminate
- 5.1.4. Marble
- 5.1.5. Quartz Surfaces
- 5.1.6. Other Materials
- 5.2. Market Analysis, Insights and Forecast - by End User
- 5.2.1. Residential
- 5.2.2. Commercial
- 5.3. Market Analysis, Insights and Forecast - by Type
- 5.3.1. Kitchen
- 5.3.2. Bathroom
- 5.3.3. Other Types
- 5.4. Market Analysis, Insights and Forecast - by Region
- 5.4.1. North America
- 5.4.2. Europe
- 5.4.3. Asia Pacific
- 5.4.4. Latin America
- 5.4.5. Middle East and Africa
- 5.1. Market Analysis, Insights and Forecast - by Material
- 6. Global Countertop Industry Analysis, Insights and Forecast, 2021-2033
- 6.1. Market Analysis, Insights and Forecast - by Material
- 6.1.1. Granite
- 6.1.2. Solid Surface
- 6.1.3. Laminate
- 6.1.4. Marble
- 6.1.5. Quartz Surfaces
- 6.1.6. Other Materials
- 6.2. Market Analysis, Insights and Forecast - by End User
- 6.2.1. Residential
- 6.2.2. Commercial
- 6.3. Market Analysis, Insights and Forecast - by Type
- 6.3.1. Kitchen
- 6.3.2. Bathroom
- 6.3.3. Other Types
- 6.1. Market Analysis, Insights and Forecast - by Material
- 7. North America Countertop Industry Analysis, Insights and Forecast, 2020-2032
- 7.1. Market Analysis, Insights and Forecast - by Material
- 7.1.1. Granite
- 7.1.2. Solid Surface
- 7.1.3. Laminate
- 7.1.4. Marble
- 7.1.5. Quartz Surfaces
- 7.1.6. Other Materials
- 7.2. Market Analysis, Insights and Forecast - by End User
- 7.2.1. Residential
- 7.2.2. Commercial
- 7.3. Market Analysis, Insights and Forecast - by Type
- 7.3.1. Kitchen
- 7.3.2. Bathroom
- 7.3.3. Other Types
- 7.1. Market Analysis, Insights and Forecast - by Material
- 8. Europe Countertop Industry Analysis, Insights and Forecast, 2020-2032
- 8.1. Market Analysis, Insights and Forecast - by Material
- 8.1.1. Granite
- 8.1.2. Solid Surface
- 8.1.3. Laminate
- 8.1.4. Marble
- 8.1.5. Quartz Surfaces
- 8.1.6. Other Materials
- 8.2. Market Analysis, Insights and Forecast - by End User
- 8.2.1. Residential
- 8.2.2. Commercial
- 8.3. Market Analysis, Insights and Forecast - by Type
- 8.3.1. Kitchen
- 8.3.2. Bathroom
- 8.3.3. Other Types
- 8.1. Market Analysis, Insights and Forecast - by Material
- 9. Asia Pacific Countertop Industry Analysis, Insights and Forecast, 2020-2032
- 9.1. Market Analysis, Insights and Forecast - by Material
- 9.1.1. Granite
- 9.1.2. Solid Surface
- 9.1.3. Laminate
- 9.1.4. Marble
- 9.1.5. Quartz Surfaces
- 9.1.6. Other Materials
- 9.2. Market Analysis, Insights and Forecast - by End User
- 9.2.1. Residential
- 9.2.2. Commercial
- 9.3. Market Analysis, Insights and Forecast - by Type
- 9.3.1. Kitchen
- 9.3.2. Bathroom
- 9.3.3. Other Types
- 9.1. Market Analysis, Insights and Forecast - by Material
- 10. Latin America Countertop Industry Analysis, Insights and Forecast, 2020-2032
- 10.1. Market Analysis, Insights and Forecast - by Material
- 10.1.1. Granite
- 10.1.2. Solid Surface
- 10.1.3. Laminate
- 10.1.4. Marble
- 10.1.5. Quartz Surfaces
- 10.1.6. Other Materials
- 10.2. Market Analysis, Insights and Forecast - by End User
- 10.2.1. Residential
- 10.2.2. Commercial
- 10.3. Market Analysis, Insights and Forecast - by Type
- 10.3.1. Kitchen
- 10.3.2. Bathroom
- 10.3.3. Other Types
- 10.1. Market Analysis, Insights and Forecast - by Material
- 11. Middle East and Africa Countertop Industry Analysis, Insights and Forecast, 2020-2032
- 11.1. Market Analysis, Insights and Forecast - by Material
- 11.1.1. Granite
- 11.1.2. Solid Surface
- 11.1.3. Laminate
- 11.1.4. Marble
- 11.1.5. Quartz Surfaces
- 11.1.6. Other Materials
- 11.2. Market Analysis, Insights and Forecast - by End User
- 11.2.1. Residential
- 11.2.2. Commercial
- 11.3. Market Analysis, Insights and Forecast - by Type
- 11.3.1. Kitchen
- 11.3.2. Bathroom
- 11.3.3. Other Types
- 11.1. Market Analysis, Insights and Forecast - by Material
- 12. Competitive Analysis
- 12.1. Company Profiles
- 12.1.1 Cosentino S A
- 12.1.1.1. Company Overview
- 12.1.1.2. Products
- 12.1.1.3. Company Financials
- 12.1.1.4. SWOT Analysis
- 12.1.2 AKG Group
- 12.1.2.1. Company Overview
- 12.1.2.2. Products
- 12.1.2.3. Company Financials
- 12.1.2.4. SWOT Analysis
- 12.1.3 Vicostone
- 12.1.3.1. Company Overview
- 12.1.3.2. Products
- 12.1.3.3. Company Financials
- 12.1.3.4. SWOT Analysis
- 12.1.4 Cambria
- 12.1.4.1. Company Overview
- 12.1.4.2. Products
- 12.1.4.3. Company Financials
- 12.1.4.4. SWOT Analysis
- 12.1.5 Masco Corporation
- 12.1.5.1. Company Overview
- 12.1.5.2. Products
- 12.1.5.3. Company Financials
- 12.1.5.4. SWOT Analysis
- 12.1.6 ROSSKOPF + PARTNER AG
- 12.1.6.1. Company Overview
- 12.1.6.2. Products
- 12.1.6.3. Company Financials
- 12.1.6.4. SWOT Analysis
- 12.1.7 DuPont de Nemours Inc
- 12.1.7.1. Company Overview
- 12.1.7.2. Products
- 12.1.7.3. Company Financials
- 12.1.7.4. SWOT Analysis
- 12.1.8 ARISTECH SURFACES LLC
- 12.1.8.1. Company Overview
- 12.1.8.2. Products
- 12.1.8.3. Company Financials
- 12.1.8.4. SWOT Analysis
- 12.1.9 STRASSER Steine GmbH
- 12.1.9.1. Company Overview
- 12.1.9.2. Products
- 12.1.9.3. Company Financials
- 12.1.9.4. SWOT Analysis
- 12.1.10 Caesarstone Ltd
- 12.1.10.1. Company Overview
- 12.1.10.2. Products
- 12.1.10.3. Company Financials
- 12.1.10.4. SWOT Analysis
- 12.1.11 Daltile
- 12.1.11.1. Company Overview
- 12.1.11.2. Products
- 12.1.11.3. Company Financials
- 12.1.11.4. SWOT Analysis
- 12.1.12 Wilsonart LLC
- 12.1.12.1. Company Overview
- 12.1.12.2. Products
- 12.1.12.3. Company Financials
- 12.1.12.4. SWOT Analysis
- 12.1.13 Asian Granito India Limited
- 12.1.13.1. Company Overview
- 12.1.13.2. Products
- 12.1.13.3. Company Financials
- 12.1.13.4. SWOT Analysis
- 12.1.14 Pokarna Ltd
- 12.1.14.1. Company Overview
- 12.1.14.2. Products
- 12.1.14.3. Company Financials
- 12.1.14.4. SWOT Analysis
- 12.1.15 Aro Granite Industries Ltd
- 12.1.15.1. Company Overview
- 12.1.15.2. Products
- 12.1.15.3. Company Financials
- 12.1.15.4. SWOT Analysis
- 12.1.1 Cosentino S A
- 12.2. Market Entropy
- 12.2.1 Company's Key Areas Served
- 12.2.2 Recent Developments
- 12.3. Company Market Share Analysis 2025
- 12.3.1 Top 5 Companies Market Share Analysis
- 12.3.2 Top 3 Companies Market Share Analysis
- 12.4. List of Potential Customers
- 13. Research Methodology
List of Figures
- Figure 1: Global Countertop Industry Revenue Breakdown (Million, %) by Region 2025 & 2033
- Figure 2: Global Countertop Industry Volume Breakdown (K Unit, %) by Region 2025 & 2033
- Figure 3: North America Countertop Industry Revenue (Million), by Material 2025 & 2033
- Figure 4: North America Countertop Industry Volume (K Unit), by Material 2025 & 2033
- Figure 5: North America Countertop Industry Revenue Share (%), by Material 2025 & 2033
- Figure 6: North America Countertop Industry Volume Share (%), by Material 2025 & 2033
- Figure 7: North America Countertop Industry Revenue (Million), by End User 2025 & 2033
- Figure 8: North America Countertop Industry Volume (K Unit), by End User 2025 & 2033
- Figure 9: North America Countertop Industry Revenue Share (%), by End User 2025 & 2033
- Figure 10: North America Countertop Industry Volume Share (%), by End User 2025 & 2033
- Figure 11: North America Countertop Industry Revenue (Million), by Type 2025 & 2033
- Figure 12: North America Countertop Industry Volume (K Unit), by Type 2025 & 2033
- Figure 13: North America Countertop Industry Revenue Share (%), by Type 2025 & 2033
- Figure 14: North America Countertop Industry Volume Share (%), by Type 2025 & 2033
- Figure 15: North America Countertop Industry Revenue (Million), by Country 2025 & 2033
- Figure 16: North America Countertop Industry Volume (K Unit), by Country 2025 & 2033
- Figure 17: North America Countertop Industry Revenue Share (%), by Country 2025 & 2033
- Figure 18: North America Countertop Industry Volume Share (%), by Country 2025 & 2033
- Figure 19: Europe Countertop Industry Revenue (Million), by Material 2025 & 2033
- Figure 20: Europe Countertop Industry Volume (K Unit), by Material 2025 & 2033
- Figure 21: Europe Countertop Industry Revenue Share (%), by Material 2025 & 2033
- Figure 22: Europe Countertop Industry Volume Share (%), by Material 2025 & 2033
- Figure 23: Europe Countertop Industry Revenue (Million), by End User 2025 & 2033
- Figure 24: Europe Countertop Industry Volume (K Unit), by End User 2025 & 2033
- Figure 25: Europe Countertop Industry Revenue Share (%), by End User 2025 & 2033
- Figure 26: Europe Countertop Industry Volume Share (%), by End User 2025 & 2033
- Figure 27: Europe Countertop Industry Revenue (Million), by Type 2025 & 2033
- Figure 28: Europe Countertop Industry Volume (K Unit), by Type 2025 & 2033
- Figure 29: Europe Countertop Industry Revenue Share (%), by Type 2025 & 2033
- Figure 30: Europe Countertop Industry Volume Share (%), by Type 2025 & 2033
- Figure 31: Europe Countertop Industry Revenue (Million), by Country 2025 & 2033
- Figure 32: Europe Countertop Industry Volume (K Unit), by Country 2025 & 2033
- Figure 33: Europe Countertop Industry Revenue Share (%), by Country 2025 & 2033
- Figure 34: Europe Countertop Industry Volume Share (%), by Country 2025 & 2033
- Figure 35: Asia Pacific Countertop Industry Revenue (Million), by Material 2025 & 2033
- Figure 36: Asia Pacific Countertop Industry Volume (K Unit), by Material 2025 & 2033
- Figure 37: Asia Pacific Countertop Industry Revenue Share (%), by Material 2025 & 2033
- Figure 38: Asia Pacific Countertop Industry Volume Share (%), by Material 2025 & 2033
- Figure 39: Asia Pacific Countertop Industry Revenue (Million), by End User 2025 & 2033
- Figure 40: Asia Pacific Countertop Industry Volume (K Unit), by End User 2025 & 2033
- Figure 41: Asia Pacific Countertop Industry Revenue Share (%), by End User 2025 & 2033
- Figure 42: Asia Pacific Countertop Industry Volume Share (%), by End User 2025 & 2033
- Figure 43: Asia Pacific Countertop Industry Revenue (Million), by Type 2025 & 2033
- Figure 44: Asia Pacific Countertop Industry Volume (K Unit), by Type 2025 & 2033
- Figure 45: Asia Pacific Countertop Industry Revenue Share (%), by Type 2025 & 2033
- Figure 46: Asia Pacific Countertop Industry Volume Share (%), by Type 2025 & 2033
- Figure 47: Asia Pacific Countertop Industry Revenue (Million), by Country 2025 & 2033
- Figure 48: Asia Pacific Countertop Industry Volume (K Unit), by Country 2025 & 2033
- Figure 49: Asia Pacific Countertop Industry Revenue Share (%), by Country 2025 & 2033
- Figure 50: Asia Pacific Countertop Industry Volume Share (%), by Country 2025 & 2033
- Figure 51: Latin America Countertop Industry Revenue (Million), by Material 2025 & 2033
- Figure 52: Latin America Countertop Industry Volume (K Unit), by Material 2025 & 2033
- Figure 53: Latin America Countertop Industry Revenue Share (%), by Material 2025 & 2033
- Figure 54: Latin America Countertop Industry Volume Share (%), by Material 2025 & 2033
- Figure 55: Latin America Countertop Industry Revenue (Million), by End User 2025 & 2033
- Figure 56: Latin America Countertop Industry Volume (K Unit), by End User 2025 & 2033
- Figure 57: Latin America Countertop Industry Revenue Share (%), by End User 2025 & 2033
- Figure 58: Latin America Countertop Industry Volume Share (%), by End User 2025 & 2033
- Figure 59: Latin America Countertop Industry Revenue (Million), by Type 2025 & 2033
- Figure 60: Latin America Countertop Industry Volume (K Unit), by Type 2025 & 2033
- Figure 61: Latin America Countertop Industry Revenue Share (%), by Type 2025 & 2033
- Figure 62: Latin America Countertop Industry Volume Share (%), by Type 2025 & 2033
- Figure 63: Latin America Countertop Industry Revenue (Million), by Country 2025 & 2033
- Figure 64: Latin America Countertop Industry Volume (K Unit), by Country 2025 & 2033
- Figure 65: Latin America Countertop Industry Revenue Share (%), by Country 2025 & 2033
- Figure 66: Latin America Countertop Industry Volume Share (%), by Country 2025 & 2033
- Figure 67: Middle East and Africa Countertop Industry Revenue (Million), by Material 2025 & 2033
- Figure 68: Middle East and Africa Countertop Industry Volume (K Unit), by Material 2025 & 2033
- Figure 69: Middle East and Africa Countertop Industry Revenue Share (%), by Material 2025 & 2033
- Figure 70: Middle East and Africa Countertop Industry Volume Share (%), by Material 2025 & 2033
- Figure 71: Middle East and Africa Countertop Industry Revenue (Million), by End User 2025 & 2033
- Figure 72: Middle East and Africa Countertop Industry Volume (K Unit), by End User 2025 & 2033
- Figure 73: Middle East and Africa Countertop Industry Revenue Share (%), by End User 2025 & 2033
- Figure 74: Middle East and Africa Countertop Industry Volume Share (%), by End User 2025 & 2033
- Figure 75: Middle East and Africa Countertop Industry Revenue (Million), by Type 2025 & 2033
- Figure 76: Middle East and Africa Countertop Industry Volume (K Unit), by Type 2025 & 2033
- Figure 77: Middle East and Africa Countertop Industry Revenue Share (%), by Type 2025 & 2033
- Figure 78: Middle East and Africa Countertop Industry Volume Share (%), by Type 2025 & 2033
- Figure 79: Middle East and Africa Countertop Industry Revenue (Million), by Country 2025 & 2033
- Figure 80: Middle East and Africa Countertop Industry Volume (K Unit), by Country 2025 & 2033
- Figure 81: Middle East and Africa Countertop Industry Revenue Share (%), by Country 2025 & 2033
- Figure 82: Middle East and Africa Countertop Industry Volume Share (%), by Country 2025 & 2033
List of Tables
- Table 1: Global Countertop Industry Revenue Million Forecast, by Material 2020 & 2033
- Table 2: Global Countertop Industry Volume K Unit Forecast, by Material 2020 & 2033
- Table 3: Global Countertop Industry Revenue Million Forecast, by End User 2020 & 2033
- Table 4: Global Countertop Industry Volume K Unit Forecast, by End User 2020 & 2033
- Table 5: Global Countertop Industry Revenue Million Forecast, by Type 2020 & 2033
- Table 6: Global Countertop Industry Volume K Unit Forecast, by Type 2020 & 2033
- Table 7: Global Countertop Industry Revenue Million Forecast, by Region 2020 & 2033
- Table 8: Global Countertop Industry Volume K Unit Forecast, by Region 2020 & 2033
- Table 9: Global Countertop Industry Revenue Million Forecast, by Material 2020 & 2033
- Table 10: Global Countertop Industry Volume K Unit Forecast, by Material 2020 & 2033
- Table 11: Global Countertop Industry Revenue Million Forecast, by End User 2020 & 2033
- Table 12: Global Countertop Industry Volume K Unit Forecast, by End User 2020 & 2033
- Table 13: Global Countertop Industry Revenue Million Forecast, by Type 2020 & 2033
- Table 14: Global Countertop Industry Volume K Unit Forecast, by Type 2020 & 2033
- Table 15: Global Countertop Industry Revenue Million Forecast, by Country 2020 & 2033
- Table 16: Global Countertop Industry Volume K Unit Forecast, by Country 2020 & 2033
- Table 17: Global Countertop Industry Revenue Million Forecast, by Material 2020 & 2033
- Table 18: Global Countertop Industry Volume K Unit Forecast, by Material 2020 & 2033
- Table 19: Global Countertop Industry Revenue Million Forecast, by End User 2020 & 2033
- Table 20: Global Countertop Industry Volume K Unit Forecast, by End User 2020 & 2033
- Table 21: Global Countertop Industry Revenue Million Forecast, by Type 2020 & 2033
- Table 22: Global Countertop Industry Volume K Unit Forecast, by Type 2020 & 2033
- Table 23: Global Countertop Industry Revenue Million Forecast, by Country 2020 & 2033
- Table 24: Global Countertop Industry Volume K Unit Forecast, by Country 2020 & 2033
- Table 25: Global Countertop Industry Revenue Million Forecast, by Material 2020 & 2033
- Table 26: Global Countertop Industry Volume K Unit Forecast, by Material 2020 & 2033
- Table 27: Global Countertop Industry Revenue Million Forecast, by End User 2020 & 2033
- Table 28: Global Countertop Industry Volume K Unit Forecast, by End User 2020 & 2033
- Table 29: Global Countertop Industry Revenue Million Forecast, by Type 2020 & 2033
- Table 30: Global Countertop Industry Volume K Unit Forecast, by Type 2020 & 2033
- Table 31: Global Countertop Industry Revenue Million Forecast, by Country 2020 & 2033
- Table 32: Global Countertop Industry Volume K Unit Forecast, by Country 2020 & 2033
- Table 33: Global Countertop Industry Revenue Million Forecast, by Material 2020 & 2033
- Table 34: Global Countertop Industry Volume K Unit Forecast, by Material 2020 & 2033
- Table 35: Global Countertop Industry Revenue Million Forecast, by End User 2020 & 2033
- Table 36: Global Countertop Industry Volume K Unit Forecast, by End User 2020 & 2033
- Table 37: Global Countertop Industry Revenue Million Forecast, by Type 2020 & 2033
- Table 38: Global Countertop Industry Volume K Unit Forecast, by Type 2020 & 2033
- Table 39: Global Countertop Industry Revenue Million Forecast, by Country 2020 & 2033
- Table 40: Global Countertop Industry Volume K Unit Forecast, by Country 2020 & 2033
- Table 41: Global Countertop Industry Revenue Million Forecast, by Material 2020 & 2033
- Table 42: Global Countertop Industry Volume K Unit Forecast, by Material 2020 & 2033
- Table 43: Global Countertop Industry Revenue Million Forecast, by End User 2020 & 2033
- Table 44: Global Countertop Industry Volume K Unit Forecast, by End User 2020 & 2033
- Table 45: Global Countertop Industry Revenue Million Forecast, by Type 2020 & 2033
- Table 46: Global Countertop Industry Volume K Unit Forecast, by Type 2020 & 2033
- Table 47: Global Countertop Industry Revenue Million Forecast, by Country 2020 & 2033
- Table 48: Global Countertop Industry Volume K Unit Forecast, by Country 2020 & 2033
Frequently Asked Questions
1. What is the projected Compound Annual Growth Rate (CAGR) of the Countertop Industry?
The projected CAGR is approximately 4.22%.
2. Which companies are prominent players in the Countertop Industry?
Key companies in the market include Cosentino S A, AKG Group, Vicostone, Cambria, Masco Corporation, ROSSKOPF + PARTNER AG, DuPont de Nemours Inc, ARISTECH SURFACES LLC, STRASSER Steine GmbH, Caesarstone Ltd, Daltile, Wilsonart LLC, Asian Granito India Limited, Pokarna Ltd, Aro Granite Industries Ltd.
3. What are the main segments of the Countertop Industry?
The market segments include Material, End User, Type.
4. Can you provide details about the market size?
The market size is estimated to be USD 148.86 Million as of 2022.
5. What are some drivers contributing to market growth?
Safety and Security of Documents Drives the Market Growth; Facility Of Large Storage Space Drives the Market Growth.
6. What are the notable trends driving market growth?
Granite is the Most Popular Choice for Countertops.
7. Are there any restraints impacting market growth?
Complex Registration Restrictions; Poor Resistance To Water And Chemical Damage.
8. Can you provide examples of recent developments in the market?
In August 2022: Wilsonart LLC, a world-class innovator of engineered surfaces, was named a winner of Kitchen & Bath Business (KBB) magazine's 2022 Readers' Choice Awards. The company has been voted as the top kitchen countertop brand in the Readers' Choice Awards for the second consecutive year.
9. What pricing options are available for accessing the report?
Pricing options include single-user, multi-user, and enterprise licenses priced at USD 4750, USD 5250, and USD 8750 respectively.
10. Is the market size provided in terms of value or volume?
The market size is provided in terms of value, measured in Million and volume, measured in K Unit.
11. Are there any specific market keywords associated with the report?
Yes, the market keyword associated with the report is "Countertop Industry," which aids in identifying and referencing the specific market segment covered.
12. How do I determine which pricing option suits my needs best?
The pricing options vary based on user requirements and access needs. Individual users may opt for single-user licenses, while businesses requiring broader access may choose multi-user or enterprise licenses for cost-effective access to the report.
13. Are there any additional resources or data provided in the Countertop Industry report?
While the report offers comprehensive insights, it's advisable to review the specific contents or supplementary materials provided to ascertain if additional resources or data are available.
14. How can I stay updated on further developments or reports in the Countertop Industry?
To stay informed about further developments, trends, and reports in the Countertop Industry, consider subscribing to industry newsletters, following relevant companies and organizations, or regularly checking reputable industry news sources and publications.
Methodology
Step 1 - Identification of Relevant Samples Size from Population Database


Step 2 - Approaches for Defining Global Market Size (Value, Volume* & Price*)

Note*: In applicable scenarios
Step 3 - Data Sources
Primary Research
- Web Analytics
- Survey Reports
- Research Institute
- Latest Research Reports
- Opinion Leaders
Secondary Research
- Annual Reports
- White Paper
- Latest Press Release
- Industry Association
- Paid Database
- Investor Presentations

Step 4 - Data Triangulation
Involves using different sources of information in order to increase the validity of a study
These sources are likely to be stakeholders in a program - participants, other researchers, program staff, other community members, and so on.
Then we put all data in single framework & apply various statistical tools to find out the dynamic on the market.
During the analysis stage, feedback from the stakeholder groups would be compared to determine areas of agreement as well as areas of divergence