

Key Insights
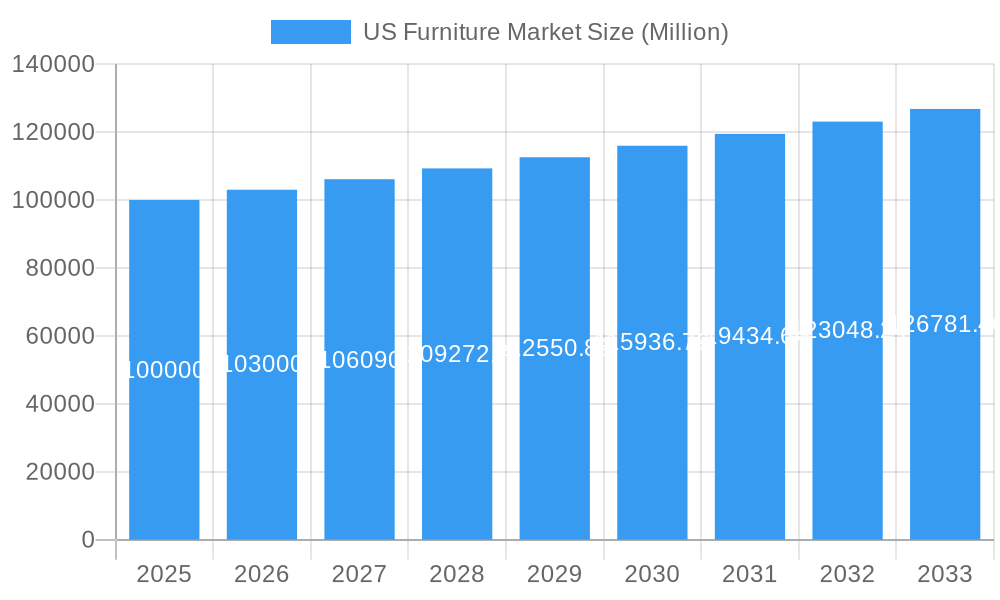
The U.S. furniture market is poised for significant expansion, fueled by population growth, rising disposable income, and a heightened emphasis on home improvement and interior design. The market is segmented by product type, including kitchen, living room, bedroom, bathroom, outdoor, and other furniture, and by distribution channel, such as home centers, flagship stores, specialty stores, and online platforms. E-commerce channels are exhibiting accelerated growth, aligning with broader digital retail trends and consumer demand for convenience. With a projected Compound Annual Growth Rate (CAGR) of 2.3%, the U.S. furniture market is estimated to reach $172.5 billion by the base year 2025. Key industry players, including IKEA, Wayfair, and Ashley Furniture, are driving innovation through new designs, materials, and delivery strategies. Potential challenges include volatile raw material costs, supply chain vulnerabilities, and economic fluctuations impacting discretionary spending.
US Furniture Market Market Size (In Billion)
The competitive environment is highly dynamic, characterized by established brands like IKEA and Ashley Furniture leveraging extensive retail networks and product portfolios, alongside agile online retailers such as Wayfair capitalizing on digital marketing and seamless online experiences. The ongoing shift towards omnichannel retail strategies, integrating online and offline touchpoints, is expected to continue. Growth is anticipated across all segments, with particular strength projected in the outdoor and kitchen furniture categories, driven by home improvement initiatives and evolving lifestyle preferences. Regional growth disparities may arise from varying economic conditions, housing markets, and demographic patterns across the Northeast, Southeast, Midwest, Southwest, and West. Continued market expansion is forecast through 2033, contingent on detailed market data.
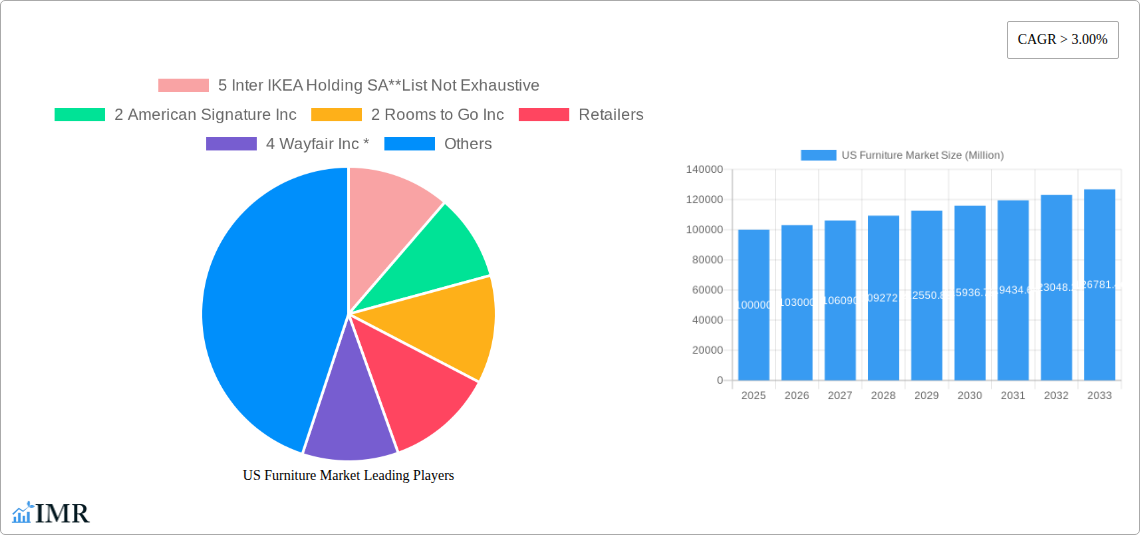
US Furniture Market Company Market Share
US Furniture Market: A Comprehensive Report (2019-2033)
This in-depth report provides a comprehensive analysis of the US furniture market, encompassing market dynamics, growth trends, regional dominance, product landscape, key players, and future outlook. The study covers the period from 2019 to 2033, with 2025 serving as the base and estimated year. This report is essential for industry professionals, investors, and strategic decision-makers seeking a thorough understanding of this dynamic market. The total market size in 2025 is estimated at xx Million units.
US Furniture Market Market Dynamics & Structure
The US furniture market is characterized by a moderately consolidated structure, with a few dominant players and numerous smaller businesses. Market concentration is influenced by factors like brand recognition, distribution networks, and economies of scale. Technological innovation, particularly in materials and manufacturing processes, is a key driver, alongside evolving consumer preferences towards sustainable and customizable furniture. Regulatory frameworks, including safety standards and environmental regulations, significantly impact market operations. The rise of e-commerce has created a strong competitive landscape, with online retailers challenging traditional brick-and-mortar stores. Furthermore, the market is witnessing a growing number of M&A activities as large companies aim to expand their market share and product portfolios.
- Market Concentration: Moderately consolidated, with top 5 players holding xx% market share (2025).
- Technological Innovation: Focus on sustainable materials, smart furniture, and automated manufacturing.
- Regulatory Framework: Compliance with safety and environmental standards is crucial.
- Competitive Substitutes: Growing competition from online retailers and imported furniture.
- End-User Demographics: Millennials and Gen Z are driving demand for modern and functional designs.
- M&A Trends: Increasing consolidation through acquisitions and mergers, estimated xx deals in the last 5 years.
US Furniture Market Growth Trends & Insights
The US furniture market experienced significant growth during the historical period (2019-2024), driven by factors such as increasing household formation, rising disposable incomes, and home improvement trends. The market is expected to continue its growth trajectory during the forecast period (2025-2033), albeit at a moderated pace compared to the historical period. Technological disruptions, including the rise of e-commerce and the adoption of smart home technology, are reshaping consumer behavior. Consumers are increasingly seeking personalized experiences, convenience, and value for money, prompting furniture retailers to adapt their strategies to meet evolving demands. The CAGR for the forecast period is estimated at xx%. Market penetration of online furniture sales is projected to reach xx% by 2033.
Dominant Regions, Countries, or Segments in US Furniture Market
The largest segment within the US furniture market by product is Living and Bedroom Furniture, accounting for approximately xx Million units in 2025. This segment's dominance stems from its essential nature in household furnishing. The online distribution channel is experiencing rapid growth, driven by consumer preference for convenience and a wider selection. However, flagship stores continue to maintain a significant market share, especially for high-end furniture.
- By Product: Living and Bedroom Furniture (xx Million units), Kitchen Furniture (xx Million units), Other Furniture (xx Million units), Outdoor Furniture (xx Million units), Bathroom Furniture (xx Million units).
- By Distribution Channel: Online Stores (xx Million units), Flagship Stores (xx Million units), Specialty Stores (xx Million units), Home Centers (xx Million units), Other Distribution Channels (xx Million units)
- Key Drivers: Rising disposable incomes, increasing urbanization, and home renovation activities.
- Dominance Factors: Strong brand recognition, wide distribution networks, and innovative product offerings.
US Furniture Market Product Landscape
The US furniture market showcases a wide array of products, characterized by increasing innovation in materials, designs, and functionalities. Smart furniture integrating technology for enhanced convenience and personalization is gaining traction. Sustainable and eco-friendly furniture options are also becoming increasingly popular, reflecting growing consumer awareness of environmental issues. Manufacturers are focusing on improving product durability, ergonomics, and aesthetic appeal to meet diverse consumer preferences. Unique selling propositions often involve superior comfort, customizable options, and innovative design features.
Key Drivers, Barriers & Challenges in US Furniture Market
Key Drivers: Rising disposable incomes, increasing urbanization, and a growing preference for home improvement projects are propelling market growth. Technological advancements are driving innovation in product design and manufacturing processes. Government initiatives promoting sustainable building practices are also contributing positively.
Key Challenges: Fluctuations in raw material prices, supply chain disruptions, and intense competition from both domestic and international players are major challenges. Stringent environmental regulations and increasing labor costs also pose hurdles for the industry. Estimated xx% increase in raw material costs in the last year impacted profitability.
Emerging Opportunities in US Furniture Market
The increasing demand for multi-functional furniture, sustainable and eco-friendly options, and personalized furniture solutions presents significant opportunities. The integration of technology into furniture, including smart features and augmented reality applications, offers considerable growth potential. Focus on niche markets, such as ergonomic furniture or furniture for specific lifestyles, can also yield significant returns.
Growth Accelerators in the US Furniture Market Industry
Technological advancements, strategic partnerships between manufacturers and retailers, and expansion into untapped markets are key catalysts driving long-term growth. Investing in research and development of innovative materials and manufacturing processes is crucial for maintaining a competitive edge. Strategic collaborations can enhance product distribution and reach a broader customer base.
Key Players Shaping the US Furniture Market Market
- 5 Inter IKEA Holding SA
- 2 American Signature Inc
- 2 Rooms to Go Inc
- 4 Wayfair Inc *
- 3 Crate and Barrel
- 3 Williams-Sonoma Inc
- 4 La-Z-Boy
- 1 Ashley Furniture Store
- 1 Bed Bath & Beyond Inc
Notable Milestones in US Furniture Market Sector
- 2021-Q3: Wayfair Inc. launched a new augmented reality app for furniture visualization.
- 2022-Q1: American Signature Inc. expanded its distribution network through strategic partnerships.
- 2023-Q2: A significant merger occurred in the industry, resulting in increased market consolidation. (Specific details are dependent on data availability)
- 2024-Q4: Launch of a new sustainable furniture line by a major manufacturer. (Specific details are dependent on data availability)
In-Depth US Furniture Market Market Outlook
The US furniture market is poised for continued growth driven by technological advancements, evolving consumer preferences, and economic factors. Strategic opportunities lie in investing in innovative product development, strengthening supply chain resilience, and expanding into emerging market segments. Further consolidation through mergers and acquisitions is expected, shaping the competitive landscape in the years to come. The market is anticipated to reach xx Million units by 2033.
US Furniture Market Segmentation
- 1. Production Analysis
- 2. Consumption Analysis
- 3. Import Market Analysis (Value & Volume)
- 4. Export Market Analysis (Value & Volume)
- 5. Price Trend Analysis
US Furniture Market Segmentation By Geography
-
1. North America
- 1.1. United States
- 1.2. Canada
- 1.3. Mexico
-
2. South America
- 2.1. Brazil
- 2.2. Argentina
- 2.3. Rest of South America
-
3. Europe
- 3.1. United Kingdom
- 3.2. Germany
- 3.3. France
- 3.4. Italy
- 3.5. Spain
- 3.6. Russia
- 3.7. Benelux
- 3.8. Nordics
- 3.9. Rest of Europe
-
4. Middle East & Africa
- 4.1. Turkey
- 4.2. Israel
- 4.3. GCC
- 4.4. North Africa
- 4.5. South Africa
- 4.6. Rest of Middle East & Africa
-
5. Asia Pacific
- 5.1. China
- 5.2. India
- 5.3. Japan
- 5.4. South Korea
- 5.5. ASEAN
- 5.6. Oceania
- 5.7. Rest of Asia Pacific
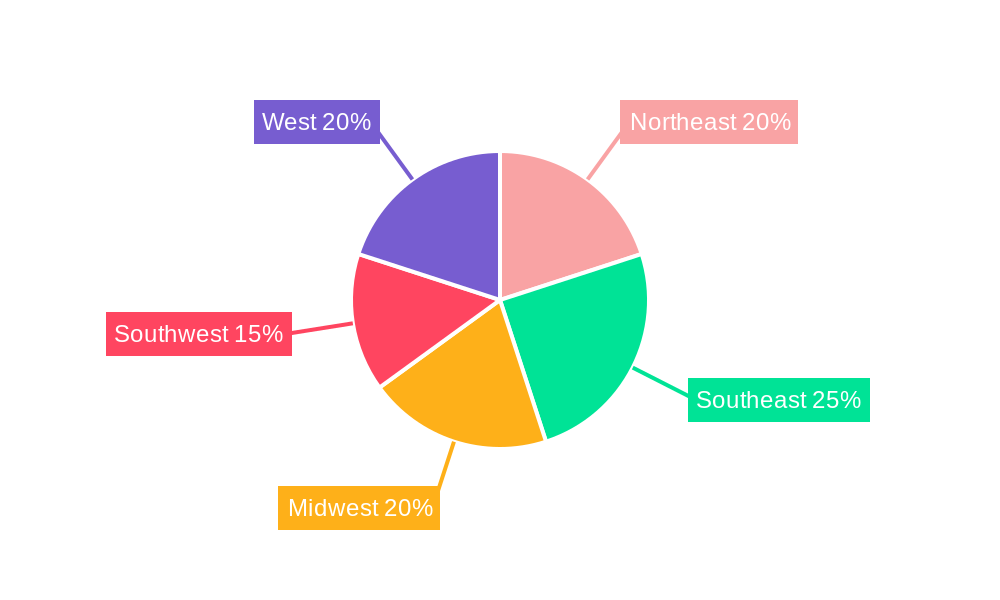
US Furniture Market Regional Market Share
Geographic Coverage of US Furniture Market
US Furniture Market REPORT HIGHLIGHTS
| Aspects | Details |
|---|---|
| Study Period | 2020-2034 |
| Base Year | 2025 |
| Estimated Year | 2026 |
| Forecast Period | 2026-2034 |
| Historical Period | 2020-2025 |
| Growth Rate | CAGR of 2.3% from 2020-2034 |
| Segmentation |
|
Table of Contents
- 1. Introduction
- 1.1. Research Scope
- 1.2. Market Segmentation
- 1.3. Research Objective
- 1.4. Definitions and Assumptions
- 2. Executive Summary
- 2.1. Market Snapshot
- 3. Market Dynamics
- 3.1. Market Drivers
- 3.2. Market Restrains
- 3.3. Market Trends
- 3.4. Market Opportunities
- 4. Market Factor Analysis
- 4.1. Porters Five Forces
- 4.1.1. Bargaining Power of Suppliers
- 4.1.2. Bargaining Power of Buyers
- 4.1.3. Threat of New Entrants
- 4.1.4. Threat of Substitutes
- 4.1.5. Competitive Rivalry
- 4.2. PESTEL analysis
- 4.3. BCG Analysis
- 4.3.1. Stars (High Growth, High Market Share)
- 4.3.2. Cash Cows (Low Growth, High Market Share)
- 4.3.3. Question Mark (High Growth, Low Market Share)
- 4.3.4. Dogs (Low Growth, Low Market Share)
- 4.4. Ansoff Matrix Analysis
- 4.5. Supply Chain Analysis
- 4.6. Regulatory Landscape
- 4.7. Current Market Potential and Opportunity Assessment (TAM–SAM–SOM Framework)
- 4.8. IMR Analyst Note
- 4.1. Porters Five Forces
- 5. Market Analysis, Insights and Forecast 2021-2033
- 5.1. Market Analysis, Insights and Forecast - by Production Analysis
- 5.2. Market Analysis, Insights and Forecast - by Consumption Analysis
- 5.3. Market Analysis, Insights and Forecast - by Import Market Analysis (Value & Volume)
- 5.4. Market Analysis, Insights and Forecast - by Export Market Analysis (Value & Volume)
- 5.5. Market Analysis, Insights and Forecast - by Price Trend Analysis
- 5.6. Market Analysis, Insights and Forecast - by Region
- 5.6.1. North America
- 5.6.2. South America
- 5.6.3. Europe
- 5.6.4. Middle East & Africa
- 5.6.5. Asia Pacific
- 6. Global US Furniture Market Analysis, Insights and Forecast, 2021-2033
- 6.1. Market Analysis, Insights and Forecast - by Production Analysis
- 6.2. Market Analysis, Insights and Forecast - by Consumption Analysis
- 6.3. Market Analysis, Insights and Forecast - by Import Market Analysis (Value & Volume)
- 6.4. Market Analysis, Insights and Forecast - by Export Market Analysis (Value & Volume)
- 6.5. Market Analysis, Insights and Forecast - by Price Trend Analysis
- 7. North America US Furniture Market Analysis, Insights and Forecast, 2020-2032
- 7.1. Market Analysis, Insights and Forecast - by Production Analysis
- 7.2. Market Analysis, Insights and Forecast - by Consumption Analysis
- 7.3. Market Analysis, Insights and Forecast - by Import Market Analysis (Value & Volume)
- 7.4. Market Analysis, Insights and Forecast - by Export Market Analysis (Value & Volume)
- 7.5. Market Analysis, Insights and Forecast - by Price Trend Analysis
- 8. South America US Furniture Market Analysis, Insights and Forecast, 2020-2032
- 8.1. Market Analysis, Insights and Forecast - by Production Analysis
- 8.2. Market Analysis, Insights and Forecast - by Consumption Analysis
- 8.3. Market Analysis, Insights and Forecast - by Import Market Analysis (Value & Volume)
- 8.4. Market Analysis, Insights and Forecast - by Export Market Analysis (Value & Volume)
- 8.5. Market Analysis, Insights and Forecast - by Price Trend Analysis
- 9. Europe US Furniture Market Analysis, Insights and Forecast, 2020-2032
- 9.1. Market Analysis, Insights and Forecast - by Production Analysis
- 9.2. Market Analysis, Insights and Forecast - by Consumption Analysis
- 9.3. Market Analysis, Insights and Forecast - by Import Market Analysis (Value & Volume)
- 9.4. Market Analysis, Insights and Forecast - by Export Market Analysis (Value & Volume)
- 9.5. Market Analysis, Insights and Forecast - by Price Trend Analysis
- 10. Middle East & Africa US Furniture Market Analysis, Insights and Forecast, 2020-2032
- 10.1. Market Analysis, Insights and Forecast - by Production Analysis
- 10.2. Market Analysis, Insights and Forecast - by Consumption Analysis
- 10.3. Market Analysis, Insights and Forecast - by Import Market Analysis (Value & Volume)
- 10.4. Market Analysis, Insights and Forecast - by Export Market Analysis (Value & Volume)
- 10.5. Market Analysis, Insights and Forecast - by Price Trend Analysis
- 11. Asia Pacific US Furniture Market Analysis, Insights and Forecast, 2020-2032
- 11.1. Market Analysis, Insights and Forecast - by Production Analysis
- 11.2. Market Analysis, Insights and Forecast - by Consumption Analysis
- 11.3. Market Analysis, Insights and Forecast - by Import Market Analysis (Value & Volume)
- 11.4. Market Analysis, Insights and Forecast - by Export Market Analysis (Value & Volume)
- 11.5. Market Analysis, Insights and Forecast - by Price Trend Analysis
- 12. Competitive Analysis
- 12.1. Company Profiles
- 12.1.1 5 Inter IKEA Holding SA**List Not Exhaustive
- 12.1.1.1. Company Overview
- 12.1.1.2. Products
- 12.1.1.3. Company Financials
- 12.1.1.4. SWOT Analysis
- 12.1.2 2 American Signature Inc
- 12.1.2.1. Company Overview
- 12.1.2.2. Products
- 12.1.2.3. Company Financials
- 12.1.2.4. SWOT Analysis
- 12.1.3 2 Rooms to Go Inc
- 12.1.3.1. Company Overview
- 12.1.3.2. Products
- 12.1.3.3. Company Financials
- 12.1.3.4. SWOT Analysis
- 12.1.4 Retailers
- 12.1.4.1. Company Overview
- 12.1.4.2. Products
- 12.1.4.3. Company Financials
- 12.1.4.4. SWOT Analysis
- 12.1.5 4 Wayfair Inc *
- 12.1.5.1. Company Overview
- 12.1.5.2. Products
- 12.1.5.3. Company Financials
- 12.1.5.4. SWOT Analysis
- 12.1.6 3 Crate and Barrel
- 12.1.6.1. Company Overview
- 12.1.6.2. Products
- 12.1.6.3. Company Financials
- 12.1.6.4. SWOT Analysis
- 12.1.7 3 Williams-Sonoma Inc
- 12.1.7.1. Company Overview
- 12.1.7.2. Products
- 12.1.7.3. Company Financials
- 12.1.7.4. SWOT Analysis
- 12.1.8 4 La-Z-Boy
- 12.1.8.1. Company Overview
- 12.1.8.2. Products
- 12.1.8.3. Company Financials
- 12.1.8.4. SWOT Analysis
- 12.1.9 1 Ashley Furniture Store
- 12.1.9.1. Company Overview
- 12.1.9.2. Products
- 12.1.9.3. Company Financials
- 12.1.9.4. SWOT Analysis
- 12.1.10 1 Bed Bath & Beyond Inc
- 12.1.10.1. Company Overview
- 12.1.10.2. Products
- 12.1.10.3. Company Financials
- 12.1.10.4. SWOT Analysis
- 12.1.11 Manufacturers
- 12.1.11.1. Company Overview
- 12.1.11.2. Products
- 12.1.11.3. Company Financials
- 12.1.11.4. SWOT Analysis
- 12.1.1 5 Inter IKEA Holding SA**List Not Exhaustive
- 12.2. Market Entropy
- 12.2.1 Company's Key Areas Served
- 12.2.2 Recent Developments
- 12.3. Company Market Share Analysis 2025
- 12.3.1 Top 5 Companies Market Share Analysis
- 12.3.2 Top 3 Companies Market Share Analysis
- 12.4. List of Potential Customers
- 13. Research Methodology
List of Figures
- Figure 1: Global US Furniture Market Revenue Breakdown (billion, %) by Region 2025 & 2033
- Figure 2: North America US Furniture Market Revenue (billion), by Production Analysis 2025 & 2033
- Figure 3: North America US Furniture Market Revenue Share (%), by Production Analysis 2025 & 2033
- Figure 4: North America US Furniture Market Revenue (billion), by Consumption Analysis 2025 & 2033
- Figure 5: North America US Furniture Market Revenue Share (%), by Consumption Analysis 2025 & 2033
- Figure 6: North America US Furniture Market Revenue (billion), by Import Market Analysis (Value & Volume) 2025 & 2033
- Figure 7: North America US Furniture Market Revenue Share (%), by Import Market Analysis (Value & Volume) 2025 & 2033
- Figure 8: North America US Furniture Market Revenue (billion), by Export Market Analysis (Value & Volume) 2025 & 2033
- Figure 9: North America US Furniture Market Revenue Share (%), by Export Market Analysis (Value & Volume) 2025 & 2033
- Figure 10: North America US Furniture Market Revenue (billion), by Price Trend Analysis 2025 & 2033
- Figure 11: North America US Furniture Market Revenue Share (%), by Price Trend Analysis 2025 & 2033
- Figure 12: North America US Furniture Market Revenue (billion), by Country 2025 & 2033
- Figure 13: North America US Furniture Market Revenue Share (%), by Country 2025 & 2033
- Figure 14: South America US Furniture Market Revenue (billion), by Production Analysis 2025 & 2033
- Figure 15: South America US Furniture Market Revenue Share (%), by Production Analysis 2025 & 2033
- Figure 16: South America US Furniture Market Revenue (billion), by Consumption Analysis 2025 & 2033
- Figure 17: South America US Furniture Market Revenue Share (%), by Consumption Analysis 2025 & 2033
- Figure 18: South America US Furniture Market Revenue (billion), by Import Market Analysis (Value & Volume) 2025 & 2033
- Figure 19: South America US Furniture Market Revenue Share (%), by Import Market Analysis (Value & Volume) 2025 & 2033
- Figure 20: South America US Furniture Market Revenue (billion), by Export Market Analysis (Value & Volume) 2025 & 2033
- Figure 21: South America US Furniture Market Revenue Share (%), by Export Market Analysis (Value & Volume) 2025 & 2033
- Figure 22: South America US Furniture Market Revenue (billion), by Price Trend Analysis 2025 & 2033
- Figure 23: South America US Furniture Market Revenue Share (%), by Price Trend Analysis 2025 & 2033
- Figure 24: South America US Furniture Market Revenue (billion), by Country 2025 & 2033
- Figure 25: South America US Furniture Market Revenue Share (%), by Country 2025 & 2033
- Figure 26: Europe US Furniture Market Revenue (billion), by Production Analysis 2025 & 2033
- Figure 27: Europe US Furniture Market Revenue Share (%), by Production Analysis 2025 & 2033
- Figure 28: Europe US Furniture Market Revenue (billion), by Consumption Analysis 2025 & 2033
- Figure 29: Europe US Furniture Market Revenue Share (%), by Consumption Analysis 2025 & 2033
- Figure 30: Europe US Furniture Market Revenue (billion), by Import Market Analysis (Value & Volume) 2025 & 2033
- Figure 31: Europe US Furniture Market Revenue Share (%), by Import Market Analysis (Value & Volume) 2025 & 2033
- Figure 32: Europe US Furniture Market Revenue (billion), by Export Market Analysis (Value & Volume) 2025 & 2033
- Figure 33: Europe US Furniture Market Revenue Share (%), by Export Market Analysis (Value & Volume) 2025 & 2033
- Figure 34: Europe US Furniture Market Revenue (billion), by Price Trend Analysis 2025 & 2033
- Figure 35: Europe US Furniture Market Revenue Share (%), by Price Trend Analysis 2025 & 2033
- Figure 36: Europe US Furniture Market Revenue (billion), by Country 2025 & 2033
- Figure 37: Europe US Furniture Market Revenue Share (%), by Country 2025 & 2033
- Figure 38: Middle East & Africa US Furniture Market Revenue (billion), by Production Analysis 2025 & 2033
- Figure 39: Middle East & Africa US Furniture Market Revenue Share (%), by Production Analysis 2025 & 2033
- Figure 40: Middle East & Africa US Furniture Market Revenue (billion), by Consumption Analysis 2025 & 2033
- Figure 41: Middle East & Africa US Furniture Market Revenue Share (%), by Consumption Analysis 2025 & 2033
- Figure 42: Middle East & Africa US Furniture Market Revenue (billion), by Import Market Analysis (Value & Volume) 2025 & 2033
- Figure 43: Middle East & Africa US Furniture Market Revenue Share (%), by Import Market Analysis (Value & Volume) 2025 & 2033
- Figure 44: Middle East & Africa US Furniture Market Revenue (billion), by Export Market Analysis (Value & Volume) 2025 & 2033
- Figure 45: Middle East & Africa US Furniture Market Revenue Share (%), by Export Market Analysis (Value & Volume) 2025 & 2033
- Figure 46: Middle East & Africa US Furniture Market Revenue (billion), by Price Trend Analysis 2025 & 2033
- Figure 47: Middle East & Africa US Furniture Market Revenue Share (%), by Price Trend Analysis 2025 & 2033
- Figure 48: Middle East & Africa US Furniture Market Revenue (billion), by Country 2025 & 2033
- Figure 49: Middle East & Africa US Furniture Market Revenue Share (%), by Country 2025 & 2033
- Figure 50: Asia Pacific US Furniture Market Revenue (billion), by Production Analysis 2025 & 2033
- Figure 51: Asia Pacific US Furniture Market Revenue Share (%), by Production Analysis 2025 & 2033
- Figure 52: Asia Pacific US Furniture Market Revenue (billion), by Consumption Analysis 2025 & 2033
- Figure 53: Asia Pacific US Furniture Market Revenue Share (%), by Consumption Analysis 2025 & 2033
- Figure 54: Asia Pacific US Furniture Market Revenue (billion), by Import Market Analysis (Value & Volume) 2025 & 2033
- Figure 55: Asia Pacific US Furniture Market Revenue Share (%), by Import Market Analysis (Value & Volume) 2025 & 2033
- Figure 56: Asia Pacific US Furniture Market Revenue (billion), by Export Market Analysis (Value & Volume) 2025 & 2033
- Figure 57: Asia Pacific US Furniture Market Revenue Share (%), by Export Market Analysis (Value & Volume) 2025 & 2033
- Figure 58: Asia Pacific US Furniture Market Revenue (billion), by Price Trend Analysis 2025 & 2033
- Figure 59: Asia Pacific US Furniture Market Revenue Share (%), by Price Trend Analysis 2025 & 2033
- Figure 60: Asia Pacific US Furniture Market Revenue (billion), by Country 2025 & 2033
- Figure 61: Asia Pacific US Furniture Market Revenue Share (%), by Country 2025 & 2033
List of Tables
- Table 1: Global US Furniture Market Revenue billion Forecast, by Production Analysis 2020 & 2033
- Table 2: Global US Furniture Market Revenue billion Forecast, by Consumption Analysis 2020 & 2033
- Table 3: Global US Furniture Market Revenue billion Forecast, by Import Market Analysis (Value & Volume) 2020 & 2033
- Table 4: Global US Furniture Market Revenue billion Forecast, by Export Market Analysis (Value & Volume) 2020 & 2033
- Table 5: Global US Furniture Market Revenue billion Forecast, by Price Trend Analysis 2020 & 2033
- Table 6: Global US Furniture Market Revenue billion Forecast, by Region 2020 & 2033
- Table 7: Global US Furniture Market Revenue billion Forecast, by Production Analysis 2020 & 2033
- Table 8: Global US Furniture Market Revenue billion Forecast, by Consumption Analysis 2020 & 2033
- Table 9: Global US Furniture Market Revenue billion Forecast, by Import Market Analysis (Value & Volume) 2020 & 2033
- Table 10: Global US Furniture Market Revenue billion Forecast, by Export Market Analysis (Value & Volume) 2020 & 2033
- Table 11: Global US Furniture Market Revenue billion Forecast, by Price Trend Analysis 2020 & 2033
- Table 12: Global US Furniture Market Revenue billion Forecast, by Country 2020 & 2033
- Table 13: United States US Furniture Market Revenue (billion) Forecast, by Application 2020 & 2033
- Table 14: Canada US Furniture Market Revenue (billion) Forecast, by Application 2020 & 2033
- Table 15: Mexico US Furniture Market Revenue (billion) Forecast, by Application 2020 & 2033
- Table 16: Global US Furniture Market Revenue billion Forecast, by Production Analysis 2020 & 2033
- Table 17: Global US Furniture Market Revenue billion Forecast, by Consumption Analysis 2020 & 2033
- Table 18: Global US Furniture Market Revenue billion Forecast, by Import Market Analysis (Value & Volume) 2020 & 2033
- Table 19: Global US Furniture Market Revenue billion Forecast, by Export Market Analysis (Value & Volume) 2020 & 2033
- Table 20: Global US Furniture Market Revenue billion Forecast, by Price Trend Analysis 2020 & 2033
- Table 21: Global US Furniture Market Revenue billion Forecast, by Country 2020 & 2033
- Table 22: Brazil US Furniture Market Revenue (billion) Forecast, by Application 2020 & 2033
- Table 23: Argentina US Furniture Market Revenue (billion) Forecast, by Application 2020 & 2033
- Table 24: Rest of South America US Furniture Market Revenue (billion) Forecast, by Application 2020 & 2033
- Table 25: Global US Furniture Market Revenue billion Forecast, by Production Analysis 2020 & 2033
- Table 26: Global US Furniture Market Revenue billion Forecast, by Consumption Analysis 2020 & 2033
- Table 27: Global US Furniture Market Revenue billion Forecast, by Import Market Analysis (Value & Volume) 2020 & 2033
- Table 28: Global US Furniture Market Revenue billion Forecast, by Export Market Analysis (Value & Volume) 2020 & 2033
- Table 29: Global US Furniture Market Revenue billion Forecast, by Price Trend Analysis 2020 & 2033
- Table 30: Global US Furniture Market Revenue billion Forecast, by Country 2020 & 2033
- Table 31: United Kingdom US Furniture Market Revenue (billion) Forecast, by Application 2020 & 2033
- Table 32: Germany US Furniture Market Revenue (billion) Forecast, by Application 2020 & 2033
- Table 33: France US Furniture Market Revenue (billion) Forecast, by Application 2020 & 2033
- Table 34: Italy US Furniture Market Revenue (billion) Forecast, by Application 2020 & 2033
- Table 35: Spain US Furniture Market Revenue (billion) Forecast, by Application 2020 & 2033
- Table 36: Russia US Furniture Market Revenue (billion) Forecast, by Application 2020 & 2033
- Table 37: Benelux US Furniture Market Revenue (billion) Forecast, by Application 2020 & 2033
- Table 38: Nordics US Furniture Market Revenue (billion) Forecast, by Application 2020 & 2033
- Table 39: Rest of Europe US Furniture Market Revenue (billion) Forecast, by Application 2020 & 2033
- Table 40: Global US Furniture Market Revenue billion Forecast, by Production Analysis 2020 & 2033
- Table 41: Global US Furniture Market Revenue billion Forecast, by Consumption Analysis 2020 & 2033
- Table 42: Global US Furniture Market Revenue billion Forecast, by Import Market Analysis (Value & Volume) 2020 & 2033
- Table 43: Global US Furniture Market Revenue billion Forecast, by Export Market Analysis (Value & Volume) 2020 & 2033
- Table 44: Global US Furniture Market Revenue billion Forecast, by Price Trend Analysis 2020 & 2033
- Table 45: Global US Furniture Market Revenue billion Forecast, by Country 2020 & 2033
- Table 46: Turkey US Furniture Market Revenue (billion) Forecast, by Application 2020 & 2033
- Table 47: Israel US Furniture Market Revenue (billion) Forecast, by Application 2020 & 2033
- Table 48: GCC US Furniture Market Revenue (billion) Forecast, by Application 2020 & 2033
- Table 49: North Africa US Furniture Market Revenue (billion) Forecast, by Application 2020 & 2033
- Table 50: South Africa US Furniture Market Revenue (billion) Forecast, by Application 2020 & 2033
- Table 51: Rest of Middle East & Africa US Furniture Market Revenue (billion) Forecast, by Application 2020 & 2033
- Table 52: Global US Furniture Market Revenue billion Forecast, by Production Analysis 2020 & 2033
- Table 53: Global US Furniture Market Revenue billion Forecast, by Consumption Analysis 2020 & 2033
- Table 54: Global US Furniture Market Revenue billion Forecast, by Import Market Analysis (Value & Volume) 2020 & 2033
- Table 55: Global US Furniture Market Revenue billion Forecast, by Export Market Analysis (Value & Volume) 2020 & 2033
- Table 56: Global US Furniture Market Revenue billion Forecast, by Price Trend Analysis 2020 & 2033
- Table 57: Global US Furniture Market Revenue billion Forecast, by Country 2020 & 2033
- Table 58: China US Furniture Market Revenue (billion) Forecast, by Application 2020 & 2033
- Table 59: India US Furniture Market Revenue (billion) Forecast, by Application 2020 & 2033
- Table 60: Japan US Furniture Market Revenue (billion) Forecast, by Application 2020 & 2033
- Table 61: South Korea US Furniture Market Revenue (billion) Forecast, by Application 2020 & 2033
- Table 62: ASEAN US Furniture Market Revenue (billion) Forecast, by Application 2020 & 2033
- Table 63: Oceania US Furniture Market Revenue (billion) Forecast, by Application 2020 & 2033
- Table 64: Rest of Asia Pacific US Furniture Market Revenue (billion) Forecast, by Application 2020 & 2033
Frequently Asked Questions
1. What is the projected Compound Annual Growth Rate (CAGR) of the US Furniture Market?
The projected CAGR is approximately 2.3%.
2. Which companies are prominent players in the US Furniture Market?
Key companies in the market include 5 Inter IKEA Holding SA**List Not Exhaustive, 2 American Signature Inc, 2 Rooms to Go Inc, Retailers, 4 Wayfair Inc *, 3 Crate and Barrel, 3 Williams-Sonoma Inc, 4 La-Z-Boy, 1 Ashley Furniture Store, 1 Bed Bath & Beyond Inc, Manufacturers.
3. What are the main segments of the US Furniture Market?
The market segments include Production Analysis, Consumption Analysis, Import Market Analysis (Value & Volume), Export Market Analysis (Value & Volume), Price Trend Analysis.
4. Can you provide details about the market size?
The market size is estimated to be USD 172.5 billion as of 2022.
5. What are some drivers contributing to market growth?
Rising Urbanization and Population Growth; Growth in the Construction Industry is Driving the Market.
6. What are the notable trends driving market growth?
Growing Sales of Bedroom Furniture is Driving the Market.
7. Are there any restraints impacting market growth?
Economic Uncertainty; Increasing Competition in the Market.
8. Can you provide examples of recent developments in the market?
N/A
9. What pricing options are available for accessing the report?
Pricing options include single-user, multi-user, and enterprise licenses priced at USD 3800, USD 4500, and USD 5800 respectively.
10. Is the market size provided in terms of value or volume?
The market size is provided in terms of value, measured in billion.
11. Are there any specific market keywords associated with the report?
Yes, the market keyword associated with the report is "US Furniture Market," which aids in identifying and referencing the specific market segment covered.
12. How do I determine which pricing option suits my needs best?
The pricing options vary based on user requirements and access needs. Individual users may opt for single-user licenses, while businesses requiring broader access may choose multi-user or enterprise licenses for cost-effective access to the report.
13. Are there any additional resources or data provided in the US Furniture Market report?
While the report offers comprehensive insights, it's advisable to review the specific contents or supplementary materials provided to ascertain if additional resources or data are available.
14. How can I stay updated on further developments or reports in the US Furniture Market?
To stay informed about further developments, trends, and reports in the US Furniture Market, consider subscribing to industry newsletters, following relevant companies and organizations, or regularly checking reputable industry news sources and publications.
Methodology
Step 1 - Identification of Relevant Samples Size from Population Database


Step 2 - Approaches for Defining Global Market Size (Value, Volume* & Price*)

Note*: In applicable scenarios
Step 3 - Data Sources
Primary Research
- Web Analytics
- Survey Reports
- Research Institute
- Latest Research Reports
- Opinion Leaders
Secondary Research
- Annual Reports
- White Paper
- Latest Press Release
- Industry Association
- Paid Database
- Investor Presentations

Step 4 - Data Triangulation
Involves using different sources of information in order to increase the validity of a study
These sources are likely to be stakeholders in a program - participants, other researchers, program staff, other community members, and so on.
Then we put all data in single framework & apply various statistical tools to find out the dynamic on the market.
During the analysis stage, feedback from the stakeholder groups would be compared to determine areas of agreement as well as areas of divergence