

Key Insights
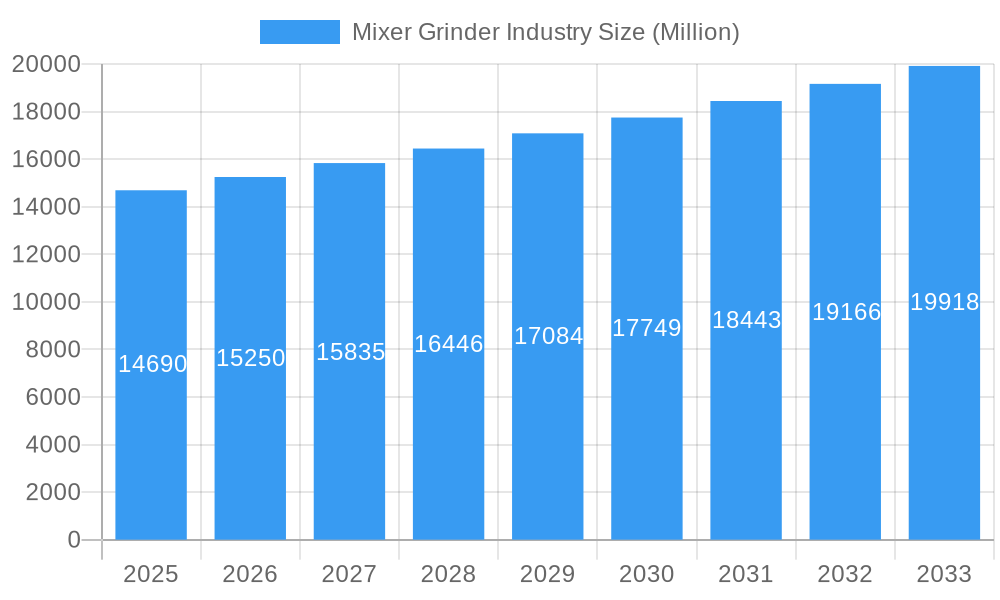
The global mixer grinder market, valued at $14.69 billion in 2025, is projected to experience steady growth, driven by increasing urbanization, rising disposable incomes, and a shift towards convenient kitchen appliances. The 3.71% CAGR indicates a consistent market expansion throughout the forecast period (2025-2033). Key growth drivers include the rising popularity of blended foods and smoothies, particularly among health-conscious consumers, along with the increasing demand for time-saving kitchen appliances in busy lifestyles. Market segmentation reveals that the residential end-user segment currently holds a significant share, although the commercial sector is expected to witness notable growth, fueled by the expansion of the food service industry. Product-wise, stand mixers are currently leading the market but traditional mixers remain a significant segment, especially in price-sensitive markets. Distribution channels are evolving, with online stores gaining traction alongside multi-brand stores. Leading brands such as Panasonic, Whirlpool, LG, and Bosch are leveraging technological advancements, introducing smart features and improved designs to enhance consumer appeal and maintain their market positions. Competitive pricing strategies and focused marketing campaigns are also playing crucial roles in shaping market dynamics.
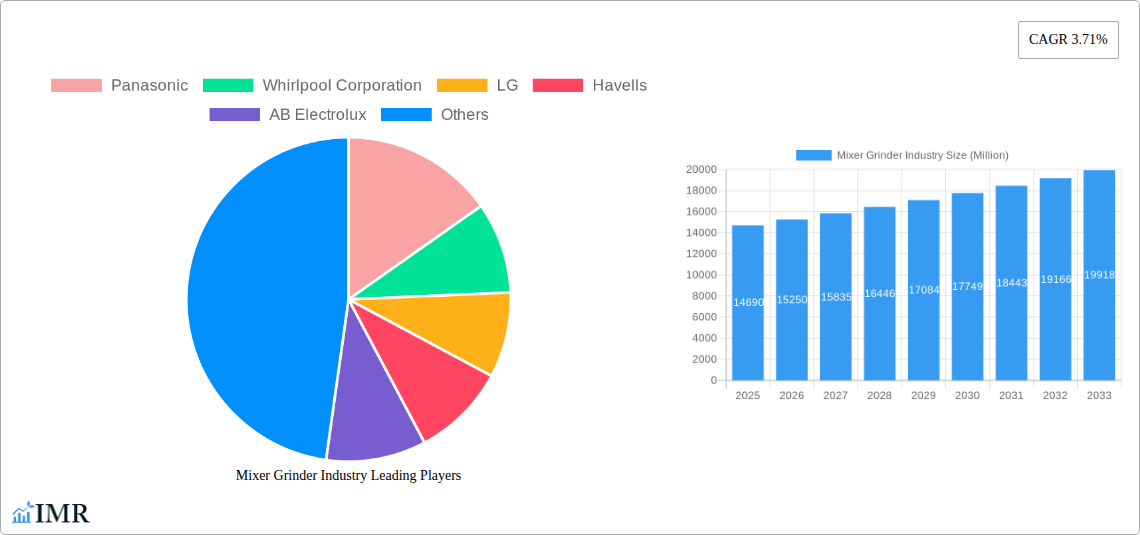
Mixer Grinder Industry Market Size (In Billion)
Geographic segmentation reveals strong market presence across North America and Europe, with significant growth potential in the Asia-Pacific region, particularly in rapidly developing economies like India and China. However, fluctuating raw material prices and increasing manufacturing costs pose potential restraints on market growth. Furthermore, the entry of new players with innovative products and competitive pricing strategies is expected to intensify competition in the coming years. The market's future success will depend on manufacturers' ability to adapt to evolving consumer preferences, introduce innovative products, and establish efficient distribution networks to cater to the diverse needs of global consumers across various regions and segments.
Mixer Grinder Industry Company Market Share
Mixer Grinder Industry Market Report: 2019-2033
This comprehensive report provides an in-depth analysis of the global mixer grinder industry, encompassing market dynamics, growth trends, competitive landscape, and future outlook. With a study period spanning 2019-2033, a base year of 2025, and a forecast period of 2025-2033, this report is an invaluable resource for industry professionals, investors, and strategic decision-makers. The report utilizes a robust methodology to analyze market size (in million units) across various segments and geographies. Key players like Panasonic, Whirlpool Corporation, LG, Havells, AB Electrolux, Bosch Global, Philips, Samsung, Haier Inc, and Morphy Richards are examined in detail.
Mixer Grinder Industry Market Dynamics & Structure
The global mixer grinder market is characterized by moderate concentration, with key players holding significant market share but facing pressure from emerging brands. Technological innovation, primarily focused on enhanced motor efficiency, safety features, and multi-functional capabilities, is a major driver. Stringent safety regulations concerning electrical appliances influence design and manufacturing. Competitive substitutes include food processors and hand blenders, impacting market penetration. The residential segment dominates, fueled by rising disposable incomes and changing lifestyles in developing economies. Mergers and acquisitions (M&A) activity has been moderate; however, recent deals highlight the industry’s consolidation trends.
- Market Concentration: Moderately concentrated, with top 10 players holding approximately xx% market share in 2024.
- Technological Innovation: Focus on energy efficiency, safety features (e.g., overload protection), and multi-functionality (e.g., juicing, grinding, blending).
- Regulatory Framework: Compliance with safety and electrical standards is paramount, influencing product design and manufacturing.
- Competitive Substitutes: Food processors and hand blenders pose significant competition, particularly in developed markets.
- End-User Demographics: Residential segment accounts for approximately xx% of the market, with significant growth potential in developing nations.
- M&A Trends: Moderate activity observed; recent acquisitions include Bosch’s acquisition of TSI Semiconductors assets and Electrolux Professional’s acquisition of Tosei Corporation. An estimated xx M&A deals occurred between 2019 and 2024.
Mixer Grinder Industry Growth Trends & Insights
The global mixer grinder market experienced a compound annual growth rate (CAGR) of xx% during the historical period (2019-2024), reaching a market size of xx million units in 2024. This growth is primarily driven by rising urbanization, increasing disposable incomes, especially in emerging economies, and a shift towards convenience in food preparation. Technological disruptions, such as the introduction of smart features and improved materials, are further fueling market expansion. Consumer behavior is shifting towards premium products with advanced functionalities and durability. The forecast period (2025-2033) anticipates continued growth, with a projected CAGR of xx%, driven by sustained demand in developing nations and the ongoing adoption of technologically advanced models. Market penetration is expected to reach xx% by 2033, particularly in previously underserved markets.
Dominant Regions, Countries, or Segments in Mixer Grinder Industry
The Asia-Pacific region, particularly India and China, dominates the global mixer grinder market, driven by large populations, rising disposable incomes, and increasing urbanization. The residential segment is the most dominant, accounting for xx% of the overall market share in 2024. Within product types, traditional mixer grinders hold a larger market share (xx%) compared to stand mixers (xx%). Multi-brand stores remain the primary distribution channel, though online sales are steadily increasing.
Key Drivers:
- Rising Disposable Incomes: Significant growth in emerging economies like India and China fuels demand for kitchen appliances.
- Urbanization: Increased population density in urban areas creates greater demand for space-saving and efficient kitchen appliances.
- Changing Lifestyles: Busy lifestyles and a preference for convenience are driving the adoption of mixer grinders.
Dominance Factors:
- High Population Density: Large populations in Asia-Pacific countries contribute to significant market volume.
- Favorable Economic Policies: Government initiatives supporting infrastructure development and consumer spending further enhance market growth.
- Strong Local Manufacturing: Established domestic manufacturing bases in key regions contribute to affordability and accessibility.
Mixer Grinder Industry Product Landscape
The mixer grinder market showcases a diverse range of products, from basic traditional models to advanced stand mixers with multiple functionalities. Innovations focus on improved motor efficiency, enhanced safety features (e.g., overload protection, overheat protection), and more durable materials. Unique selling propositions often include variable speed settings, pulse functions, multiple jars for varied tasks, and compact designs. Technological advancements have led to the incorporation of smart features in some models, offering connectivity and remote control functionalities.
Key Drivers, Barriers & Challenges in Mixer Grinder Industry
Key Drivers: Rising disposable incomes, increasing urbanization, changing lifestyles (demand for convenience), technological advancements (improved motor efficiency, safety features), and government initiatives promoting consumer spending in developing economies.
Key Challenges & Restraints: Intense competition, fluctuating raw material prices ( impacting manufacturing costs), stringent safety regulations (adding to compliance costs), potential supply chain disruptions (affecting product availability), and the growth of competitive substitutes like food processors. These factors could negatively impact profitability by approximately xx% by 2033.
Emerging Opportunities in Mixer Grinder Industry
Untapped market potential exists in Africa and Latin America. Opportunities lie in developing specialized mixer grinders for specific food preparations (e.g., nut butter, spice grinding) and integrating smart functionalities for enhanced user experience. Growing consumer awareness of health and nutrition creates opportunities for models designed for healthy food preparation.
Growth Accelerators in the Mixer Grinder Industry
Technological breakthroughs, such as improved motor technology and smart features, are driving growth. Strategic partnerships, like collaborations between manufacturers and retailers, expand market reach and distribution efficiency. Market expansion strategies targeting underserved regions, including Africa and Latin America, create significant growth potential.
Key Players Shaping the Mixer Grinder Industry Market
- Panasonic
- Whirlpool Corporation
- LG
- Havells
- AB Electrolux
- Bosch Global
- Philips
- Samsung
- Haier Inc
- Morphy Richards
Notable Milestones in Mixer Grinder Industry Sector
- April 2023: Bosch announced plans to acquire TSI Semiconductors assets.
- August 2023: Bosch finalized the acquisition of TSI Semiconductors, forming Robert Bosch Semiconductor LLC.
- December 2023: Electrolux Professional completed the acquisition of Tosei Corporation.
In-Depth Mixer Grinder Industry Market Outlook
The mixer grinder market is poised for sustained growth, driven by technological advancements, strategic partnerships, and expansion into new markets. The increasing demand for convenience and the rising popularity of healthy eating habits will further fuel market expansion. Strategic players should focus on product innovation, robust distribution networks, and targeted marketing campaigns to capitalize on this market potential. Opportunities exist in creating niche products and expanding into underserved markets, especially in Africa and Latin America.
Mixer Grinder Industry Segmentation
-
1. Product Type
- 1.1. Stand Mixer
- 1.2. Traditional Mixer
-
2. Distribution Channel
- 2.1. Multi-brands Stores
- 2.2. Exclusive Stores
- 2.3. Online Stores
- 2.4. Other Distribution Channels
-
3. End User
- 3.1. Residential
- 3.2. Commercial
Mixer Grinder Industry Segmentation By Geography
- 1. North America
- 2. Europe
- 3. Asia Pacific
- 4. Latin America
- 5. Middle East and Africa
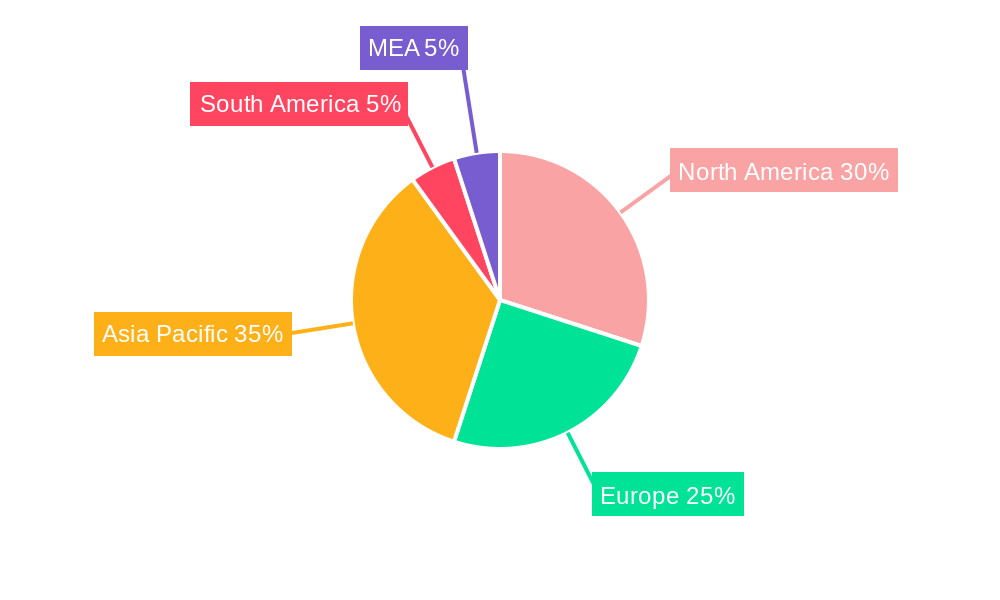
Mixer Grinder Industry Regional Market Share
Geographic Coverage of Mixer Grinder Industry
Mixer Grinder Industry REPORT HIGHLIGHTS
| Aspects | Details |
|---|---|
| Study Period | 2020-2034 |
| Base Year | 2025 |
| Estimated Year | 2026 |
| Forecast Period | 2026-2034 |
| Historical Period | 2020-2025 |
| Growth Rate | CAGR of 3.71% from 2020-2034 |
| Segmentation |
|
Table of Contents
- 1. Introduction
- 1.1. Research Scope
- 1.2. Market Segmentation
- 1.3. Research Objective
- 1.4. Definitions and Assumptions
- 2. Executive Summary
- 2.1. Market Snapshot
- 3. Market Dynamics
- 3.1. Market Drivers
- 3.2. Market Restrains
- 3.3. Market Trends
- 3.4. Market Opportunities
- 4. Market Factor Analysis
- 4.1. Porters Five Forces
- 4.1.1. Bargaining Power of Suppliers
- 4.1.2. Bargaining Power of Buyers
- 4.1.3. Threat of New Entrants
- 4.1.4. Threat of Substitutes
- 4.1.5. Competitive Rivalry
- 4.2. PESTEL analysis
- 4.3. BCG Analysis
- 4.3.1. Stars (High Growth, High Market Share)
- 4.3.2. Cash Cows (Low Growth, High Market Share)
- 4.3.3. Question Mark (High Growth, Low Market Share)
- 4.3.4. Dogs (Low Growth, Low Market Share)
- 4.4. Ansoff Matrix Analysis
- 4.5. Supply Chain Analysis
- 4.6. Regulatory Landscape
- 4.7. Current Market Potential and Opportunity Assessment (TAM–SAM–SOM Framework)
- 4.8. IMR Analyst Note
- 4.1. Porters Five Forces
- 5. Market Analysis, Insights and Forecast 2021-2033
- 5.1. Market Analysis, Insights and Forecast - by Product Type
- 5.1.1. Stand Mixer
- 5.1.2. Traditional Mixer
- 5.2. Market Analysis, Insights and Forecast - by Distribution Channel
- 5.2.1. Multi-brands Stores
- 5.2.2. Exclusive Stores
- 5.2.3. Online Stores
- 5.2.4. Other Distribution Channels
- 5.3. Market Analysis, Insights and Forecast - by End User
- 5.3.1. Residential
- 5.3.2. Commercial
- 5.4. Market Analysis, Insights and Forecast - by Region
- 5.4.1. North America
- 5.4.2. Europe
- 5.4.3. Asia Pacific
- 5.4.4. Latin America
- 5.4.5. Middle East and Africa
- 5.1. Market Analysis, Insights and Forecast - by Product Type
- 6. Global Mixer Grinder Industry Analysis, Insights and Forecast, 2021-2033
- 6.1. Market Analysis, Insights and Forecast - by Product Type
- 6.1.1. Stand Mixer
- 6.1.2. Traditional Mixer
- 6.2. Market Analysis, Insights and Forecast - by Distribution Channel
- 6.2.1. Multi-brands Stores
- 6.2.2. Exclusive Stores
- 6.2.3. Online Stores
- 6.2.4. Other Distribution Channels
- 6.3. Market Analysis, Insights and Forecast - by End User
- 6.3.1. Residential
- 6.3.2. Commercial
- 6.1. Market Analysis, Insights and Forecast - by Product Type
- 7. North America Mixer Grinder Industry Analysis, Insights and Forecast, 2020-2032
- 7.1. Market Analysis, Insights and Forecast - by Product Type
- 7.1.1. Stand Mixer
- 7.1.2. Traditional Mixer
- 7.2. Market Analysis, Insights and Forecast - by Distribution Channel
- 7.2.1. Multi-brands Stores
- 7.2.2. Exclusive Stores
- 7.2.3. Online Stores
- 7.2.4. Other Distribution Channels
- 7.3. Market Analysis, Insights and Forecast - by End User
- 7.3.1. Residential
- 7.3.2. Commercial
- 7.1. Market Analysis, Insights and Forecast - by Product Type
- 8. Europe Mixer Grinder Industry Analysis, Insights and Forecast, 2020-2032
- 8.1. Market Analysis, Insights and Forecast - by Product Type
- 8.1.1. Stand Mixer
- 8.1.2. Traditional Mixer
- 8.2. Market Analysis, Insights and Forecast - by Distribution Channel
- 8.2.1. Multi-brands Stores
- 8.2.2. Exclusive Stores
- 8.2.3. Online Stores
- 8.2.4. Other Distribution Channels
- 8.3. Market Analysis, Insights and Forecast - by End User
- 8.3.1. Residential
- 8.3.2. Commercial
- 8.1. Market Analysis, Insights and Forecast - by Product Type
- 9. Asia Pacific Mixer Grinder Industry Analysis, Insights and Forecast, 2020-2032
- 9.1. Market Analysis, Insights and Forecast - by Product Type
- 9.1.1. Stand Mixer
- 9.1.2. Traditional Mixer
- 9.2. Market Analysis, Insights and Forecast - by Distribution Channel
- 9.2.1. Multi-brands Stores
- 9.2.2. Exclusive Stores
- 9.2.3. Online Stores
- 9.2.4. Other Distribution Channels
- 9.3. Market Analysis, Insights and Forecast - by End User
- 9.3.1. Residential
- 9.3.2. Commercial
- 9.1. Market Analysis, Insights and Forecast - by Product Type
- 10. Latin America Mixer Grinder Industry Analysis, Insights and Forecast, 2020-2032
- 10.1. Market Analysis, Insights and Forecast - by Product Type
- 10.1.1. Stand Mixer
- 10.1.2. Traditional Mixer
- 10.2. Market Analysis, Insights and Forecast - by Distribution Channel
- 10.2.1. Multi-brands Stores
- 10.2.2. Exclusive Stores
- 10.2.3. Online Stores
- 10.2.4. Other Distribution Channels
- 10.3. Market Analysis, Insights and Forecast - by End User
- 10.3.1. Residential
- 10.3.2. Commercial
- 10.1. Market Analysis, Insights and Forecast - by Product Type
- 11. Middle East and Africa Mixer Grinder Industry Analysis, Insights and Forecast, 2020-2032
- 11.1. Market Analysis, Insights and Forecast - by Product Type
- 11.1.1. Stand Mixer
- 11.1.2. Traditional Mixer
- 11.2. Market Analysis, Insights and Forecast - by Distribution Channel
- 11.2.1. Multi-brands Stores
- 11.2.2. Exclusive Stores
- 11.2.3. Online Stores
- 11.2.4. Other Distribution Channels
- 11.3. Market Analysis, Insights and Forecast - by End User
- 11.3.1. Residential
- 11.3.2. Commercial
- 11.1. Market Analysis, Insights and Forecast - by Product Type
- 12. Competitive Analysis
- 12.1. Company Profiles
- 12.1.1 Panasonic
- 12.1.1.1. Company Overview
- 12.1.1.2. Products
- 12.1.1.3. Company Financials
- 12.1.1.4. SWOT Analysis
- 12.1.2 Whirlpool Corporation
- 12.1.2.1. Company Overview
- 12.1.2.2. Products
- 12.1.2.3. Company Financials
- 12.1.2.4. SWOT Analysis
- 12.1.3 LG
- 12.1.3.1. Company Overview
- 12.1.3.2. Products
- 12.1.3.3. Company Financials
- 12.1.3.4. SWOT Analysis
- 12.1.4 Havells
- 12.1.4.1. Company Overview
- 12.1.4.2. Products
- 12.1.4.3. Company Financials
- 12.1.4.4. SWOT Analysis
- 12.1.5 AB Electrolux
- 12.1.5.1. Company Overview
- 12.1.5.2. Products
- 12.1.5.3. Company Financials
- 12.1.5.4. SWOT Analysis
- 12.1.6 Bosch Global
- 12.1.6.1. Company Overview
- 12.1.6.2. Products
- 12.1.6.3. Company Financials
- 12.1.6.4. SWOT Analysis
- 12.1.7 Philips
- 12.1.7.1. Company Overview
- 12.1.7.2. Products
- 12.1.7.3. Company Financials
- 12.1.7.4. SWOT Analysis
- 12.1.8 Samsung
- 12.1.8.1. Company Overview
- 12.1.8.2. Products
- 12.1.8.3. Company Financials
- 12.1.8.4. SWOT Analysis
- 12.1.9 Haier Inc
- 12.1.9.1. Company Overview
- 12.1.9.2. Products
- 12.1.9.3. Company Financials
- 12.1.9.4. SWOT Analysis
- 12.1.10 Morphy Richards
- 12.1.10.1. Company Overview
- 12.1.10.2. Products
- 12.1.10.3. Company Financials
- 12.1.10.4. SWOT Analysis
- 12.1.1 Panasonic
- 12.2. Market Entropy
- 12.2.1 Company's Key Areas Served
- 12.2.2 Recent Developments
- 12.3. Company Market Share Analysis 2025
- 12.3.1 Top 5 Companies Market Share Analysis
- 12.3.2 Top 3 Companies Market Share Analysis
- 12.4. List of Potential Customers
- 13. Research Methodology
List of Figures
- Figure 1: Global Mixer Grinder Industry Revenue Breakdown (Million, %) by Region 2025 & 2033
- Figure 2: Global Mixer Grinder Industry Volume Breakdown (K Unit, %) by Region 2025 & 2033
- Figure 3: North America Mixer Grinder Industry Revenue (Million), by Product Type 2025 & 2033
- Figure 4: North America Mixer Grinder Industry Volume (K Unit), by Product Type 2025 & 2033
- Figure 5: North America Mixer Grinder Industry Revenue Share (%), by Product Type 2025 & 2033
- Figure 6: North America Mixer Grinder Industry Volume Share (%), by Product Type 2025 & 2033
- Figure 7: North America Mixer Grinder Industry Revenue (Million), by Distribution Channel 2025 & 2033
- Figure 8: North America Mixer Grinder Industry Volume (K Unit), by Distribution Channel 2025 & 2033
- Figure 9: North America Mixer Grinder Industry Revenue Share (%), by Distribution Channel 2025 & 2033
- Figure 10: North America Mixer Grinder Industry Volume Share (%), by Distribution Channel 2025 & 2033
- Figure 11: North America Mixer Grinder Industry Revenue (Million), by End User 2025 & 2033
- Figure 12: North America Mixer Grinder Industry Volume (K Unit), by End User 2025 & 2033
- Figure 13: North America Mixer Grinder Industry Revenue Share (%), by End User 2025 & 2033
- Figure 14: North America Mixer Grinder Industry Volume Share (%), by End User 2025 & 2033
- Figure 15: North America Mixer Grinder Industry Revenue (Million), by Country 2025 & 2033
- Figure 16: North America Mixer Grinder Industry Volume (K Unit), by Country 2025 & 2033
- Figure 17: North America Mixer Grinder Industry Revenue Share (%), by Country 2025 & 2033
- Figure 18: North America Mixer Grinder Industry Volume Share (%), by Country 2025 & 2033
- Figure 19: Europe Mixer Grinder Industry Revenue (Million), by Product Type 2025 & 2033
- Figure 20: Europe Mixer Grinder Industry Volume (K Unit), by Product Type 2025 & 2033
- Figure 21: Europe Mixer Grinder Industry Revenue Share (%), by Product Type 2025 & 2033
- Figure 22: Europe Mixer Grinder Industry Volume Share (%), by Product Type 2025 & 2033
- Figure 23: Europe Mixer Grinder Industry Revenue (Million), by Distribution Channel 2025 & 2033
- Figure 24: Europe Mixer Grinder Industry Volume (K Unit), by Distribution Channel 2025 & 2033
- Figure 25: Europe Mixer Grinder Industry Revenue Share (%), by Distribution Channel 2025 & 2033
- Figure 26: Europe Mixer Grinder Industry Volume Share (%), by Distribution Channel 2025 & 2033
- Figure 27: Europe Mixer Grinder Industry Revenue (Million), by End User 2025 & 2033
- Figure 28: Europe Mixer Grinder Industry Volume (K Unit), by End User 2025 & 2033
- Figure 29: Europe Mixer Grinder Industry Revenue Share (%), by End User 2025 & 2033
- Figure 30: Europe Mixer Grinder Industry Volume Share (%), by End User 2025 & 2033
- Figure 31: Europe Mixer Grinder Industry Revenue (Million), by Country 2025 & 2033
- Figure 32: Europe Mixer Grinder Industry Volume (K Unit), by Country 2025 & 2033
- Figure 33: Europe Mixer Grinder Industry Revenue Share (%), by Country 2025 & 2033
- Figure 34: Europe Mixer Grinder Industry Volume Share (%), by Country 2025 & 2033
- Figure 35: Asia Pacific Mixer Grinder Industry Revenue (Million), by Product Type 2025 & 2033
- Figure 36: Asia Pacific Mixer Grinder Industry Volume (K Unit), by Product Type 2025 & 2033
- Figure 37: Asia Pacific Mixer Grinder Industry Revenue Share (%), by Product Type 2025 & 2033
- Figure 38: Asia Pacific Mixer Grinder Industry Volume Share (%), by Product Type 2025 & 2033
- Figure 39: Asia Pacific Mixer Grinder Industry Revenue (Million), by Distribution Channel 2025 & 2033
- Figure 40: Asia Pacific Mixer Grinder Industry Volume (K Unit), by Distribution Channel 2025 & 2033
- Figure 41: Asia Pacific Mixer Grinder Industry Revenue Share (%), by Distribution Channel 2025 & 2033
- Figure 42: Asia Pacific Mixer Grinder Industry Volume Share (%), by Distribution Channel 2025 & 2033
- Figure 43: Asia Pacific Mixer Grinder Industry Revenue (Million), by End User 2025 & 2033
- Figure 44: Asia Pacific Mixer Grinder Industry Volume (K Unit), by End User 2025 & 2033
- Figure 45: Asia Pacific Mixer Grinder Industry Revenue Share (%), by End User 2025 & 2033
- Figure 46: Asia Pacific Mixer Grinder Industry Volume Share (%), by End User 2025 & 2033
- Figure 47: Asia Pacific Mixer Grinder Industry Revenue (Million), by Country 2025 & 2033
- Figure 48: Asia Pacific Mixer Grinder Industry Volume (K Unit), by Country 2025 & 2033
- Figure 49: Asia Pacific Mixer Grinder Industry Revenue Share (%), by Country 2025 & 2033
- Figure 50: Asia Pacific Mixer Grinder Industry Volume Share (%), by Country 2025 & 2033
- Figure 51: Latin America Mixer Grinder Industry Revenue (Million), by Product Type 2025 & 2033
- Figure 52: Latin America Mixer Grinder Industry Volume (K Unit), by Product Type 2025 & 2033
- Figure 53: Latin America Mixer Grinder Industry Revenue Share (%), by Product Type 2025 & 2033
- Figure 54: Latin America Mixer Grinder Industry Volume Share (%), by Product Type 2025 & 2033
- Figure 55: Latin America Mixer Grinder Industry Revenue (Million), by Distribution Channel 2025 & 2033
- Figure 56: Latin America Mixer Grinder Industry Volume (K Unit), by Distribution Channel 2025 & 2033
- Figure 57: Latin America Mixer Grinder Industry Revenue Share (%), by Distribution Channel 2025 & 2033
- Figure 58: Latin America Mixer Grinder Industry Volume Share (%), by Distribution Channel 2025 & 2033
- Figure 59: Latin America Mixer Grinder Industry Revenue (Million), by End User 2025 & 2033
- Figure 60: Latin America Mixer Grinder Industry Volume (K Unit), by End User 2025 & 2033
- Figure 61: Latin America Mixer Grinder Industry Revenue Share (%), by End User 2025 & 2033
- Figure 62: Latin America Mixer Grinder Industry Volume Share (%), by End User 2025 & 2033
- Figure 63: Latin America Mixer Grinder Industry Revenue (Million), by Country 2025 & 2033
- Figure 64: Latin America Mixer Grinder Industry Volume (K Unit), by Country 2025 & 2033
- Figure 65: Latin America Mixer Grinder Industry Revenue Share (%), by Country 2025 & 2033
- Figure 66: Latin America Mixer Grinder Industry Volume Share (%), by Country 2025 & 2033
- Figure 67: Middle East and Africa Mixer Grinder Industry Revenue (Million), by Product Type 2025 & 2033
- Figure 68: Middle East and Africa Mixer Grinder Industry Volume (K Unit), by Product Type 2025 & 2033
- Figure 69: Middle East and Africa Mixer Grinder Industry Revenue Share (%), by Product Type 2025 & 2033
- Figure 70: Middle East and Africa Mixer Grinder Industry Volume Share (%), by Product Type 2025 & 2033
- Figure 71: Middle East and Africa Mixer Grinder Industry Revenue (Million), by Distribution Channel 2025 & 2033
- Figure 72: Middle East and Africa Mixer Grinder Industry Volume (K Unit), by Distribution Channel 2025 & 2033
- Figure 73: Middle East and Africa Mixer Grinder Industry Revenue Share (%), by Distribution Channel 2025 & 2033
- Figure 74: Middle East and Africa Mixer Grinder Industry Volume Share (%), by Distribution Channel 2025 & 2033
- Figure 75: Middle East and Africa Mixer Grinder Industry Revenue (Million), by End User 2025 & 2033
- Figure 76: Middle East and Africa Mixer Grinder Industry Volume (K Unit), by End User 2025 & 2033
- Figure 77: Middle East and Africa Mixer Grinder Industry Revenue Share (%), by End User 2025 & 2033
- Figure 78: Middle East and Africa Mixer Grinder Industry Volume Share (%), by End User 2025 & 2033
- Figure 79: Middle East and Africa Mixer Grinder Industry Revenue (Million), by Country 2025 & 2033
- Figure 80: Middle East and Africa Mixer Grinder Industry Volume (K Unit), by Country 2025 & 2033
- Figure 81: Middle East and Africa Mixer Grinder Industry Revenue Share (%), by Country 2025 & 2033
- Figure 82: Middle East and Africa Mixer Grinder Industry Volume Share (%), by Country 2025 & 2033
List of Tables
- Table 1: Global Mixer Grinder Industry Revenue Million Forecast, by Product Type 2020 & 2033
- Table 2: Global Mixer Grinder Industry Volume K Unit Forecast, by Product Type 2020 & 2033
- Table 3: Global Mixer Grinder Industry Revenue Million Forecast, by Distribution Channel 2020 & 2033
- Table 4: Global Mixer Grinder Industry Volume K Unit Forecast, by Distribution Channel 2020 & 2033
- Table 5: Global Mixer Grinder Industry Revenue Million Forecast, by End User 2020 & 2033
- Table 6: Global Mixer Grinder Industry Volume K Unit Forecast, by End User 2020 & 2033
- Table 7: Global Mixer Grinder Industry Revenue Million Forecast, by Region 2020 & 2033
- Table 8: Global Mixer Grinder Industry Volume K Unit Forecast, by Region 2020 & 2033
- Table 9: Global Mixer Grinder Industry Revenue Million Forecast, by Product Type 2020 & 2033
- Table 10: Global Mixer Grinder Industry Volume K Unit Forecast, by Product Type 2020 & 2033
- Table 11: Global Mixer Grinder Industry Revenue Million Forecast, by Distribution Channel 2020 & 2033
- Table 12: Global Mixer Grinder Industry Volume K Unit Forecast, by Distribution Channel 2020 & 2033
- Table 13: Global Mixer Grinder Industry Revenue Million Forecast, by End User 2020 & 2033
- Table 14: Global Mixer Grinder Industry Volume K Unit Forecast, by End User 2020 & 2033
- Table 15: Global Mixer Grinder Industry Revenue Million Forecast, by Country 2020 & 2033
- Table 16: Global Mixer Grinder Industry Volume K Unit Forecast, by Country 2020 & 2033
- Table 17: Global Mixer Grinder Industry Revenue Million Forecast, by Product Type 2020 & 2033
- Table 18: Global Mixer Grinder Industry Volume K Unit Forecast, by Product Type 2020 & 2033
- Table 19: Global Mixer Grinder Industry Revenue Million Forecast, by Distribution Channel 2020 & 2033
- Table 20: Global Mixer Grinder Industry Volume K Unit Forecast, by Distribution Channel 2020 & 2033
- Table 21: Global Mixer Grinder Industry Revenue Million Forecast, by End User 2020 & 2033
- Table 22: Global Mixer Grinder Industry Volume K Unit Forecast, by End User 2020 & 2033
- Table 23: Global Mixer Grinder Industry Revenue Million Forecast, by Country 2020 & 2033
- Table 24: Global Mixer Grinder Industry Volume K Unit Forecast, by Country 2020 & 2033
- Table 25: Global Mixer Grinder Industry Revenue Million Forecast, by Product Type 2020 & 2033
- Table 26: Global Mixer Grinder Industry Volume K Unit Forecast, by Product Type 2020 & 2033
- Table 27: Global Mixer Grinder Industry Revenue Million Forecast, by Distribution Channel 2020 & 2033
- Table 28: Global Mixer Grinder Industry Volume K Unit Forecast, by Distribution Channel 2020 & 2033
- Table 29: Global Mixer Grinder Industry Revenue Million Forecast, by End User 2020 & 2033
- Table 30: Global Mixer Grinder Industry Volume K Unit Forecast, by End User 2020 & 2033
- Table 31: Global Mixer Grinder Industry Revenue Million Forecast, by Country 2020 & 2033
- Table 32: Global Mixer Grinder Industry Volume K Unit Forecast, by Country 2020 & 2033
- Table 33: Global Mixer Grinder Industry Revenue Million Forecast, by Product Type 2020 & 2033
- Table 34: Global Mixer Grinder Industry Volume K Unit Forecast, by Product Type 2020 & 2033
- Table 35: Global Mixer Grinder Industry Revenue Million Forecast, by Distribution Channel 2020 & 2033
- Table 36: Global Mixer Grinder Industry Volume K Unit Forecast, by Distribution Channel 2020 & 2033
- Table 37: Global Mixer Grinder Industry Revenue Million Forecast, by End User 2020 & 2033
- Table 38: Global Mixer Grinder Industry Volume K Unit Forecast, by End User 2020 & 2033
- Table 39: Global Mixer Grinder Industry Revenue Million Forecast, by Country 2020 & 2033
- Table 40: Global Mixer Grinder Industry Volume K Unit Forecast, by Country 2020 & 2033
- Table 41: Global Mixer Grinder Industry Revenue Million Forecast, by Product Type 2020 & 2033
- Table 42: Global Mixer Grinder Industry Volume K Unit Forecast, by Product Type 2020 & 2033
- Table 43: Global Mixer Grinder Industry Revenue Million Forecast, by Distribution Channel 2020 & 2033
- Table 44: Global Mixer Grinder Industry Volume K Unit Forecast, by Distribution Channel 2020 & 2033
- Table 45: Global Mixer Grinder Industry Revenue Million Forecast, by End User 2020 & 2033
- Table 46: Global Mixer Grinder Industry Volume K Unit Forecast, by End User 2020 & 2033
- Table 47: Global Mixer Grinder Industry Revenue Million Forecast, by Country 2020 & 2033
- Table 48: Global Mixer Grinder Industry Volume K Unit Forecast, by Country 2020 & 2033
Frequently Asked Questions
1. What is the projected Compound Annual Growth Rate (CAGR) of the Mixer Grinder Industry?
The projected CAGR is approximately 3.71%.
2. Which companies are prominent players in the Mixer Grinder Industry?
Key companies in the market include Panasonic, Whirlpool Corporation, LG, Havells, AB Electrolux, Bosch Global, Philips, Samsung, Haier Inc, Morphy Richards.
3. What are the main segments of the Mixer Grinder Industry?
The market segments include Product Type, Distribution Channel, End User.
4. Can you provide details about the market size?
The market size is estimated to be USD 14.69 Million as of 2022.
5. What are some drivers contributing to market growth?
Increasing Urbanization is Driving the Market; Increase in Usage of Smart Kitchen Appliances is Driving the Market.
6. What are the notable trends driving market growth?
E-commerce Emerges as a Fastest Growing Distribution Channel for Mixer Grinders.
7. Are there any restraints impacting market growth?
High Power Consumption.
8. Can you provide examples of recent developments in the market?
In April 2023, Bosch revealed plans to acquire the assets of TSI Semiconductors, including its Roseville, California campus. The acquisition was finalized on August 31, 2023, and the newly formed company will operate under the name Robert Bosch Semiconductor LLC.
9. What pricing options are available for accessing the report?
Pricing options include single-user, multi-user, and enterprise licenses priced at USD 4750, USD 5250, and USD 8750 respectively.
10. Is the market size provided in terms of value or volume?
The market size is provided in terms of value, measured in Million and volume, measured in K Unit.
11. Are there any specific market keywords associated with the report?
Yes, the market keyword associated with the report is "Mixer Grinder Industry," which aids in identifying and referencing the specific market segment covered.
12. How do I determine which pricing option suits my needs best?
The pricing options vary based on user requirements and access needs. Individual users may opt for single-user licenses, while businesses requiring broader access may choose multi-user or enterprise licenses for cost-effective access to the report.
13. Are there any additional resources or data provided in the Mixer Grinder Industry report?
While the report offers comprehensive insights, it's advisable to review the specific contents or supplementary materials provided to ascertain if additional resources or data are available.
14. How can I stay updated on further developments or reports in the Mixer Grinder Industry?
To stay informed about further developments, trends, and reports in the Mixer Grinder Industry, consider subscribing to industry newsletters, following relevant companies and organizations, or regularly checking reputable industry news sources and publications.
Methodology
Step 1 - Identification of Relevant Samples Size from Population Database


Step 2 - Approaches for Defining Global Market Size (Value, Volume* & Price*)

Note*: In applicable scenarios
Step 3 - Data Sources
Primary Research
- Web Analytics
- Survey Reports
- Research Institute
- Latest Research Reports
- Opinion Leaders
Secondary Research
- Annual Reports
- White Paper
- Latest Press Release
- Industry Association
- Paid Database
- Investor Presentations

Step 4 - Data Triangulation
Involves using different sources of information in order to increase the validity of a study
These sources are likely to be stakeholders in a program - participants, other researchers, program staff, other community members, and so on.
Then we put all data in single framework & apply various statistical tools to find out the dynamic on the market.
During the analysis stage, feedback from the stakeholder groups would be compared to determine areas of agreement as well as areas of divergence