

Key Insights
The global smart logistics market is experiencing robust expansion, poised to reach an estimated USD 32.6 billion in 2024, driven by a remarkable Compound Annual Growth Rate (CAGR) of 20.8%. This substantial growth trajectory is fueled by the increasing adoption of advanced technologies such as the Internet of Things (IoT), artificial intelligence (AI), and big data analytics, which are revolutionizing supply chain operations. Key applications within manufacturing are leading the charge, leveraging smart logistics for enhanced efficiency, reduced operational costs, and improved inventory management. The power and energy sector is also a significant contributor, utilizing smart solutions for the timely and secure delivery of critical components. Furthermore, the food and beverages industry is benefiting from improved traceability and cold chain management, while the military and defense sector demands advanced security and real-time tracking capabilities.
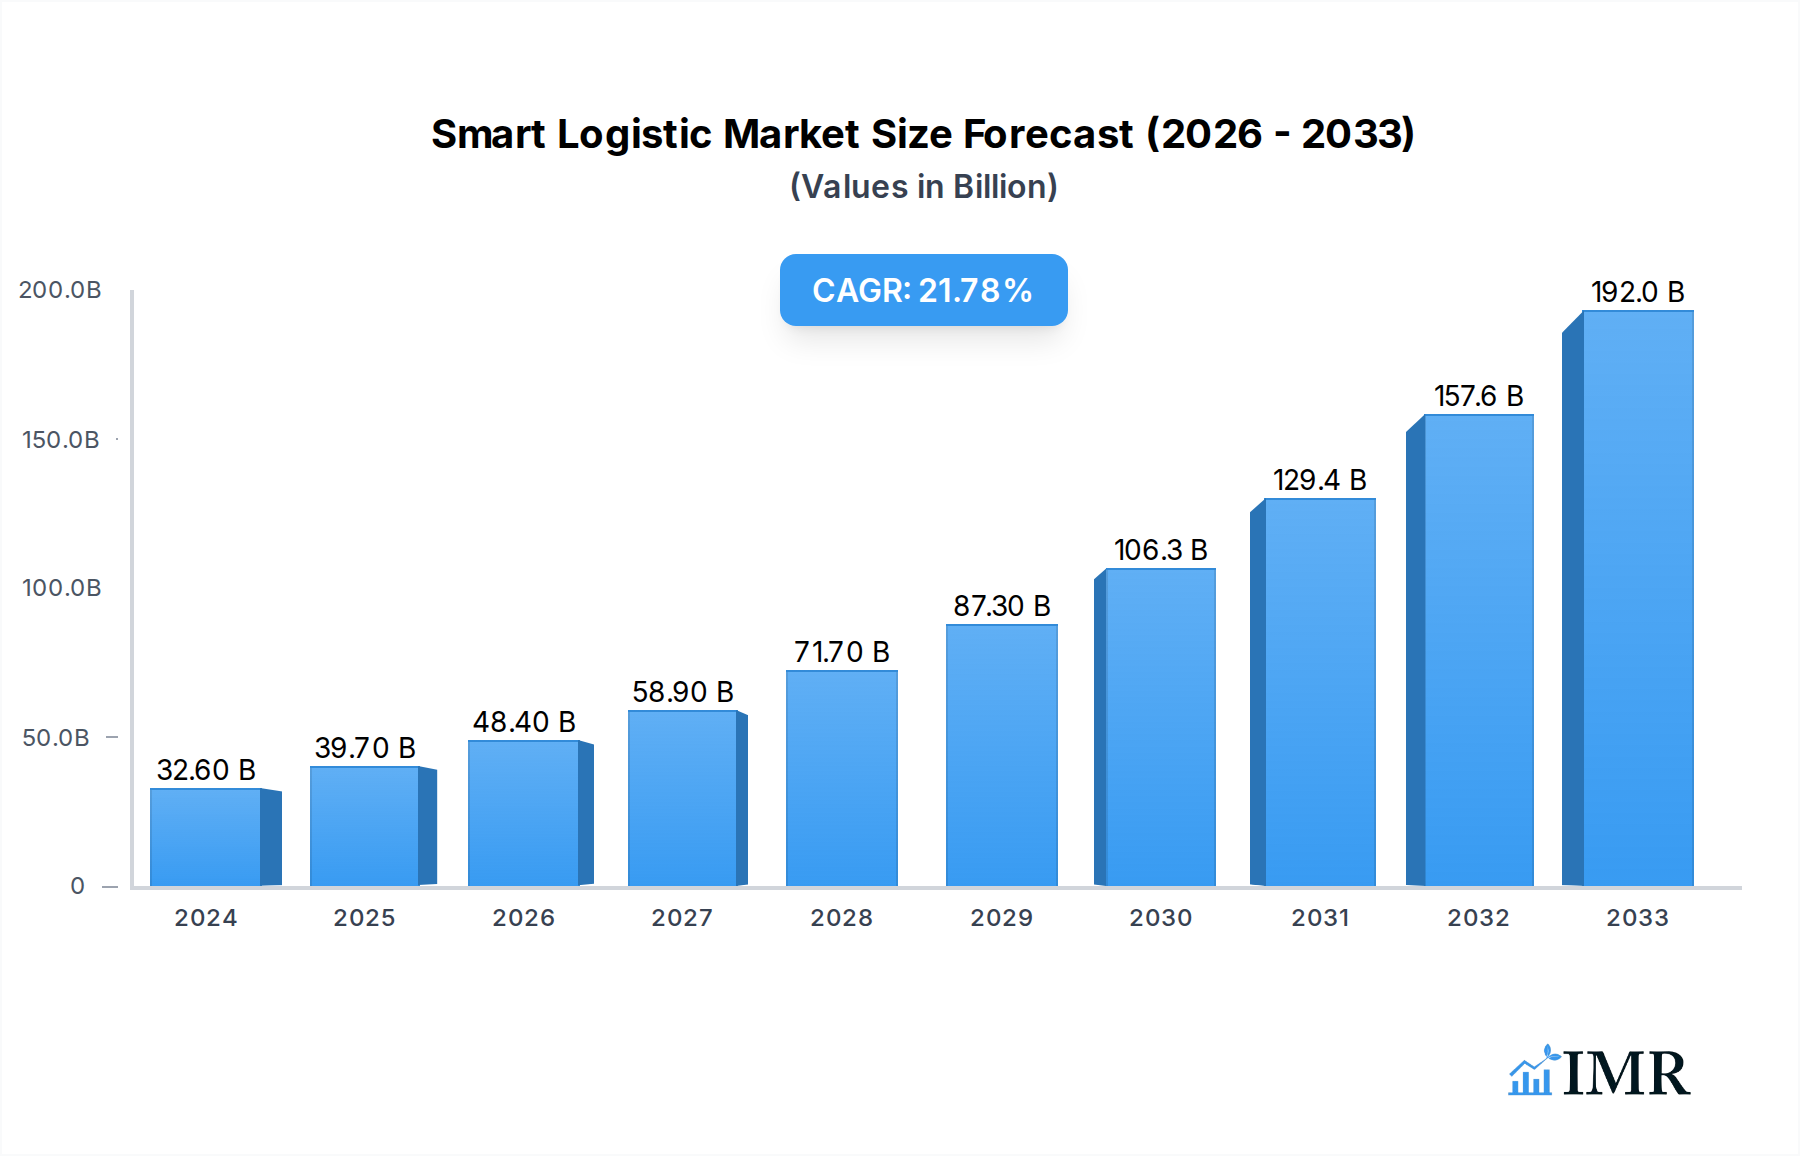
Smart Logistic Market Size (In Billion)
The escalating demand for optimized supply chains, real-time visibility, and enhanced customer experience are primary market drivers. Businesses are increasingly recognizing the strategic advantage offered by smart logistics in navigating complex global trade environments and addressing challenges such as route optimization, warehouse automation, and predictive maintenance. While the market is characterized by rapid technological innovation and a growing number of strategic collaborations between technology providers and logistics companies, it also faces certain restraints. These include the high initial investment costs for implementing sophisticated smart logistics systems and concerns surrounding data security and privacy. Nevertheless, the overarching trend towards digitalization and automation across industries suggests a sustained period of strong market performance for smart logistics solutions throughout the forecast period.

Smart Logistic Company Market Share
Smart Logistic Market: Comprehensive Analysis and Future Outlook (2019-2033)
This in-depth report offers a definitive analysis of the global Smart Logistic market, a critical sector poised for significant expansion driven by digital transformation and the increasing demand for efficient supply chain solutions. Covering the period from 2019 to 2033, with a base year of 2025, this report provides actionable insights for industry stakeholders, investors, and strategists navigating the complexities of smart logistics. We delve into the market dynamics, growth trends, regional dominance, product landscape, key drivers, barriers, emerging opportunities, and competitive strategies of leading players. This report is essential for understanding the evolving ecosystem of smart logistics, including its parent and child markets, with all quantitative values presented in billions of US dollars.
Smart Logistic Market Dynamics & Structure
The global Smart Logistic market is characterized by a moderately concentrated landscape, with key players like IBM Corporation, Intel Corporation, SAP, Cisco Systems, and Oracle Corporation actively shaping its trajectory. Technological innovation, particularly in areas of IoT, AI, blockchain, and cloud computing, serves as a primary driver, enhancing visibility, automation, and efficiency across supply chains. Regulatory frameworks, while evolving, are increasingly supportive of digital adoption, aiming to streamline cross-border logistics and ensure data security. Competitive product substitutes, such as traditional logistics solutions, are rapidly being displaced by more advanced, data-driven alternatives. End-user demographics are broad, encompassing large enterprises across various sectors, with a growing interest from SMEs seeking cost-effective and agile logistics. Mergers and Acquisitions (M&A) trends are prevalent as larger entities aim to consolidate market share, acquire innovative technologies, and expand their service portfolios. For instance, the historical period (2019-2024) saw an estimated $15.3 billion in M&A deal volumes, reflecting this consolidation.
- Market Concentration: Moderately concentrated with a few dominant global players.
- Technological Innovation Drivers: IoT, AI, Machine Learning, Blockchain, Cloud Computing, Predictive Analytics.
- Regulatory Frameworks: Increasing focus on data privacy, security, and cross-border trade facilitation.
- Competitive Product Substitutes: Traditional manual logistics systems, less integrated software solutions.
- End-User Demographics: Primarily large enterprises in manufacturing, retail, and e-commerce, with growing adoption by SMEs.
- M&A Trends: Active consolidation, acquisition of niche technology providers, and strategic partnerships.
Smart Logistic Growth Trends & Insights
The Smart Logistic market is projected to experience robust growth, with an estimated market size of $72.5 billion in the base year 2025, escalating to a projected $240.8 billion by the end of the forecast period in 2033. This represents a Compound Annual Growth Rate (CAGR) of approximately 16.2%. The historical period (2019-2024) witnessed a CAGR of around 14.5%, underscoring the accelerating adoption of smart technologies. Adoption rates are steadily increasing across industries, driven by the pressing need for supply chain resilience, cost optimization, and enhanced customer satisfaction. Technological disruptions, such as the widespread integration of AI for route optimization, predictive maintenance of fleets, and automated warehousing, are fundamentally reshaping logistical operations. Consumer behavior shifts, characterized by the demand for faster delivery times and real-time tracking, are also a significant catalyst for the adoption of smart logistic solutions. The market penetration of advanced tracking and tracing technologies has surged from approximately 45% in 2019 to an estimated 70% in 2025. Furthermore, the increasing digitalization of global trade and the proliferation of smart devices within supply chains are creating a fertile ground for sustained market expansion. The growing emphasis on sustainability and green logistics is also influencing the development and adoption of smart solutions that optimize resource utilization and reduce carbon footprints, adding another layer to the market's growth narrative. The evolution of the parent market, encompassing broader supply chain management, and the expansion of child markets, such as last-mile delivery solutions, further amplify the growth potential within the smart logistics sphere.
Dominant Regions, Countries, or Segments in Smart Logistic
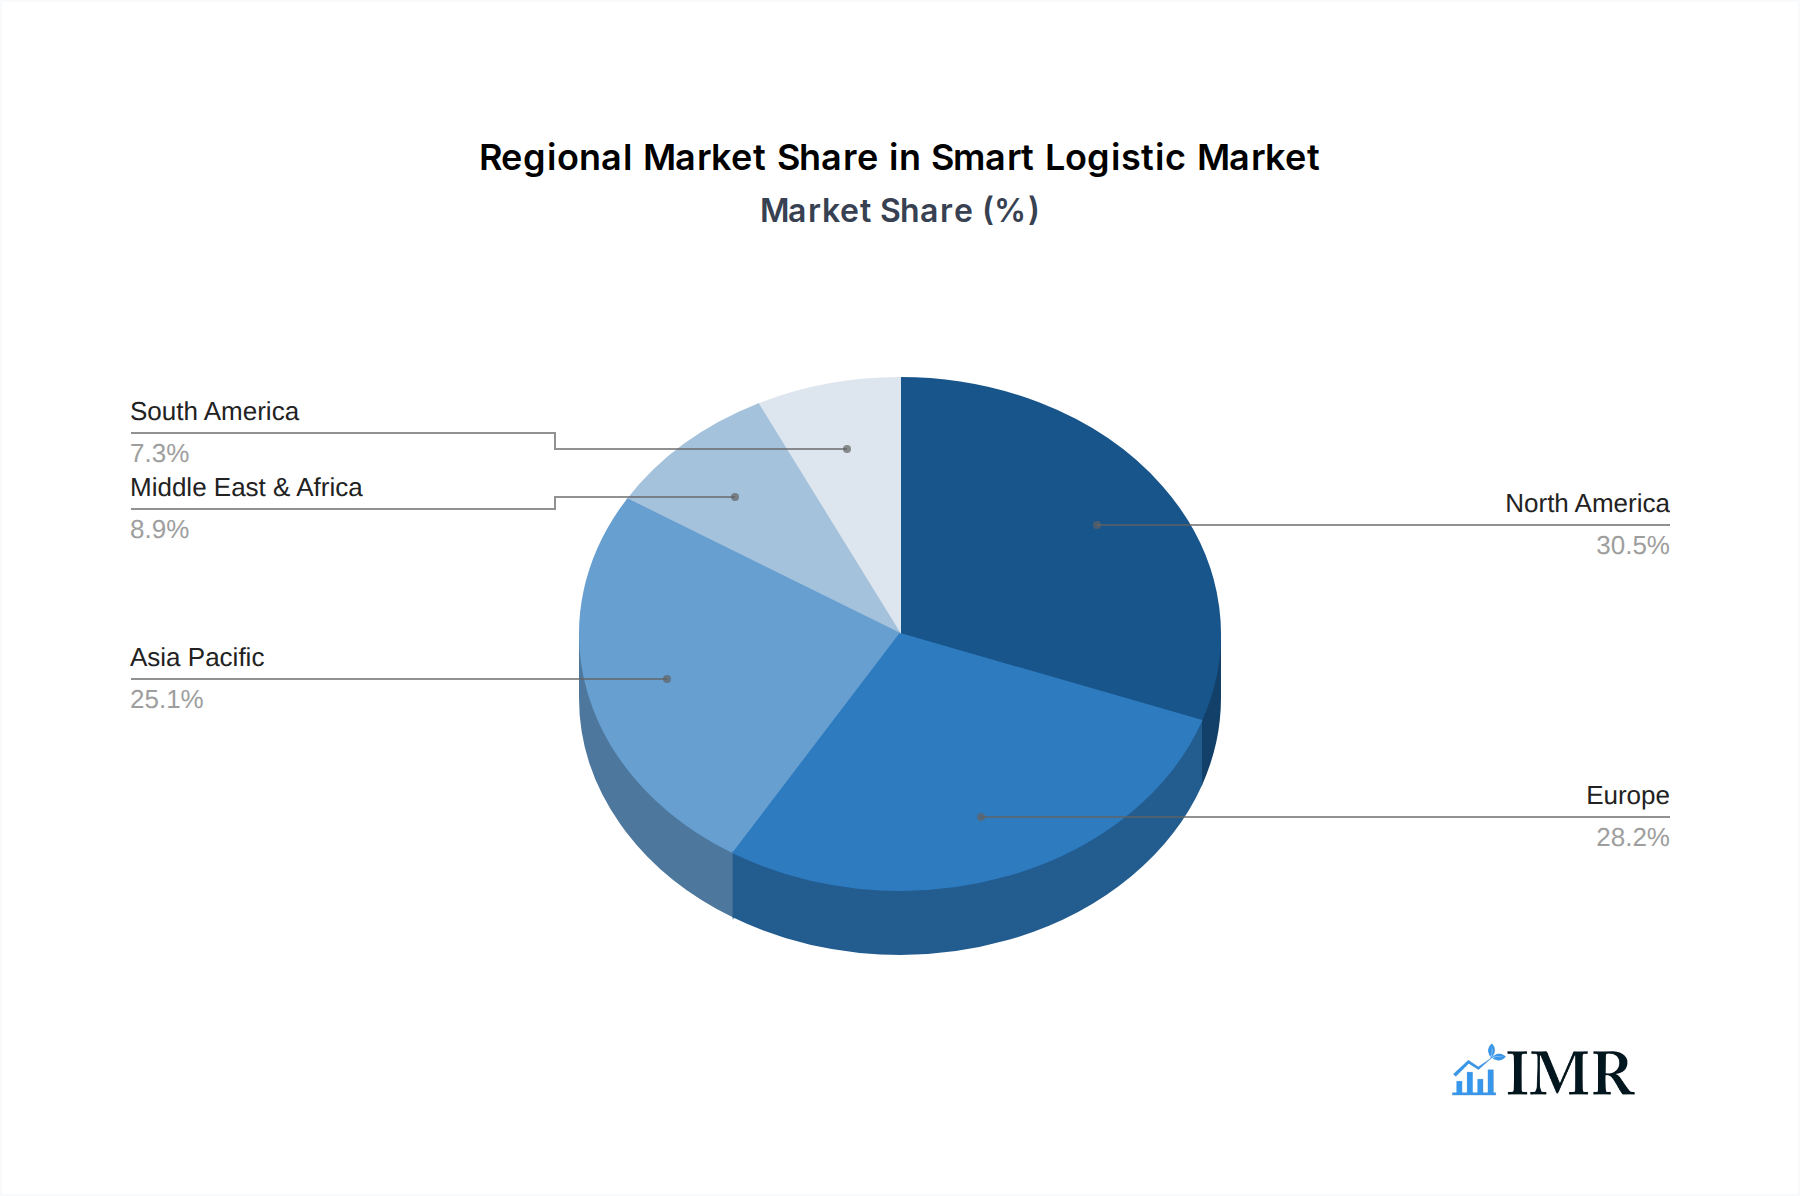
North America is currently the dominant region in the Smart Logistic market, projected to hold a market share of approximately 30% in 2025, valued at $21.8 billion. This dominance is propelled by a strong economic base, advanced technological infrastructure, and a high concentration of leading logistics and technology companies, including IBM Corporation and Honeywell International. The United States, in particular, plays a pivotal role due to its extensive transportation networks and significant investments in supply chain automation. Within the application segment, Manufacturing is expected to be the largest, accounting for an estimated 28% of the market share in 2025, valued at $20.3 billion. This is driven by the inherent need for efficient inventory management, just-in-time delivery, and optimized production flow. The integration of smart logistics in manufacturing ensures seamless integration of raw materials, work-in-progress, and finished goods, significantly reducing operational costs and lead times.
The Software segment, within the Type category, is also a significant growth driver, projected to capture a market share of 40% in 2025, valued at $29 billion. This segment encompasses advanced analytics platforms, warehouse management systems (WMS), transportation management systems (TMS), and supply chain visibility software, all crucial for the intelligent orchestration of logistics. The rapid development and adoption of AI-powered software solutions for demand forecasting and route optimization are central to this dominance.
- Leading Region: North America, driven by technological adoption and economic prowess.
- Dominant Application Segment: Manufacturing, due to its complex and integrated supply chain needs.
- Key Growth Driver (Region): High adoption of IoT and AI for supply chain visibility and automation in the US.
- Key Growth Driver (Application): Need for JIT delivery and optimized production flow in manufacturing.
- Dominant Type Segment: Software, fueled by advanced analytics and management systems.
- Key Growth Driver (Type): Proliferation of WMS, TMS, and AI-driven optimization tools.
- Market Share (North America, 2025): ~30%
- Market Share (Manufacturing Application, 2025): ~28%
- Market Share (Software Type, 2025): ~40%
Smart Logistic Product Landscape
The Smart Logistic product landscape is characterized by a proliferation of innovative solutions designed to enhance efficiency, transparency, and automation across the supply chain. This includes advanced IoT sensors for real-time tracking of goods, temperature, and humidity; AI-powered analytics platforms for predictive demand forecasting and route optimization; and blockchain-based systems for secure and transparent transaction recording. Automated guided vehicles (AGVs) and robotic systems are transforming warehouse operations, increasing throughput and reducing labor costs. Smart pallets and containers equipped with embedded technology are providing granular visibility into inventory status and movement. Performance metrics such as reduced transit times, lower fuel consumption, minimized inventory holding costs, and improved on-time delivery rates are key indicators of product effectiveness. Unique selling propositions often revolve around the seamless integration of these technologies, offering end-to-end visibility and control, thereby creating a competitive advantage for adopting companies. Technological advancements are continuously pushing the boundaries, with a focus on predictive capabilities and autonomous operations.
Key Drivers, Barriers & Challenges in Smart Logistic
Key Drivers: The smart logistics market is primarily propelled by the escalating demand for operational efficiency and cost reduction. Technological advancements, particularly in AI, IoT, and automation, enable real-time tracking, predictive analytics, and optimized routing, leading to significant improvements in supply chain performance. The growing adoption of e-commerce and the associated need for faster, more reliable last-mile delivery solutions are also crucial growth catalysts. Furthermore, increasing global trade complexities and the emphasis on supply chain resilience and visibility in the wake of recent disruptions are driving investment in smart logistics.
Barriers & Challenges: Significant challenges include the substantial initial investment required for implementing advanced smart logistics solutions, which can be a barrier for smaller enterprises. Data security and privacy concerns are paramount, as is the need for robust cybersecurity measures to protect sensitive supply chain information. Interoperability issues between different systems and technologies can hinder seamless integration. The shortage of skilled labor capable of managing and operating these sophisticated systems also poses a considerable restraint. Moreover, regulatory hurdles and the lack of standardization in certain areas can complicate widespread adoption. Supply chain disruptions, though a driver for adoption, also present ongoing challenges that require agile and adaptable smart solutions.
Emerging Opportunities in Smart Logistic
Emerging opportunities in the smart logistics sector lie in the untapped potential of AI-driven predictive maintenance for fleets, significantly reducing downtime and operational costs, estimated to offer a $12 billion opportunity by 2030. The expansion of smart logistics into emerging economies, where infrastructure development is rapidly progressing, presents a vast growth frontier. Innovative applications of blockchain technology for enhanced traceability and transparency in pharmaceutical and food supply chains are gaining traction, offering enhanced safety and compliance. The growing demand for sustainable and green logistics solutions, leveraging smart technologies to optimize routes for reduced emissions and minimize waste, is another significant area of opportunity, projected to grow by $18 billion by 2033. The integration of drone technology for last-mile delivery in urban and remote areas also holds substantial promise.
Growth Accelerators in the Smart Logistic Industry
Several catalysts are accelerating growth in the smart logistics industry. Technological breakthroughs, such as the advancement of 5G networks enabling faster and more reliable data transmission for IoT devices, are fundamental. Strategic partnerships between technology providers, logistics companies, and end-users are fostering innovation and market penetration. For instance, collaborations between software developers and hardware manufacturers are creating integrated, end-to-end solutions. Market expansion strategies, including the development of tailored solutions for specific industry verticals and geographic regions, are also driving growth. The increasing focus on data analytics and the ability to derive actionable insights from vast amounts of logistical data empower businesses to make more informed decisions, further accelerating the adoption of smart logistics. The development of digital twins for supply chains, allowing for simulation and optimization, is another key accelerator.
Key Players Shaping the Smart Logistic Market
- IBM Corporation
- Intel Corporation
- SAP
- Cisco Systems
- Oracle Corporation
- Smart Logistics Gate
- T-Systems International
- Arkessa
- Honeywell International
Notable Milestones in Smart Logistic Sector
- 2019: Increased adoption of IoT sensors for real-time asset tracking and condition monitoring.
- 2020: Widespread implementation of AI-powered demand forecasting tools to mitigate supply chain disruptions.
- 2021: Significant growth in cloud-based Transportation Management Systems (TMS) for enhanced route optimization.
- 2022: Accelerated adoption of blockchain for secure and transparent supply chain transactions in high-value industries.
- 2023: Increased investment in robotic process automation (RPA) for warehouse management and fulfillment.
- 2024: Emergence of predictive analytics for proactive maintenance of logistics fleets and infrastructure.
In-Depth Smart Logistic Market Outlook
The Smart Logistic market outlook remains exceptionally strong, driven by an irreversible trend towards digitalization and efficiency across global supply chains. Growth accelerators, including advancements in AI, IoT, and 5G, combined with strategic partnerships and market expansion initiatives, are poised to fuel sustained expansion. The increasing demand for end-to-end visibility, resilience, and sustainability will continue to be paramount. Businesses that embrace intelligent automation and data-driven decision-making will gain a significant competitive edge. The smart logistics sector is set to redefine operational paradigms, unlocking unprecedented levels of efficiency and innovation, and is projected to be a cornerstone of future global commerce.
Smart Logistic Segmentation
-
1. Application
- 1.1. Manufacturing
- 1.2. Power and Energy
- 1.3. Food and Beverages
- 1.4. Military and Defense
- 1.5. Others
-
2. Type
- 2.1. Hardware
- 2.2. Software
- 2.3. Services
Smart Logistic Segmentation By Geography
-
1. North America
- 1.1. United States
- 1.2. Canada
- 1.3. Mexico
-
2. South America
- 2.1. Brazil
- 2.2. Argentina
- 2.3. Rest of South America
-
3. Europe
- 3.1. United Kingdom
- 3.2. Germany
- 3.3. France
- 3.4. Italy
- 3.5. Spain
- 3.6. Russia
- 3.7. Benelux
- 3.8. Nordics
- 3.9. Rest of Europe
-
4. Middle East & Africa
- 4.1. Turkey
- 4.2. Israel
- 4.3. GCC
- 4.4. North Africa
- 4.5. South Africa
- 4.6. Rest of Middle East & Africa
-
5. Asia Pacific
- 5.1. China
- 5.2. India
- 5.3. Japan
- 5.4. South Korea
- 5.5. ASEAN
- 5.6. Oceania
- 5.7. Rest of Asia Pacific
Smart Logistic Regional Market Share
Geographic Coverage of Smart Logistic
Smart Logistic REPORT HIGHLIGHTS
| Aspects | Details |
|---|---|
| Study Period | 2020-2034 |
| Base Year | 2025 |
| Estimated Year | 2026 |
| Forecast Period | 2026-2034 |
| Historical Period | 2020-2025 |
| Growth Rate | CAGR of 20.8% from 2020-2034 |
| Segmentation |
|
Table of Contents
- 1. Introduction
- 1.1. Research Scope
- 1.2. Market Segmentation
- 1.3. Research Methodology
- 1.4. Definitions and Assumptions
- 2. Executive Summary
- 2.1. Introduction
- 3. Market Dynamics
- 3.1. Introduction
- 3.2. Market Drivers
- 3.3. Market Restrains
- 3.4. Market Trends
- 4. Market Factor Analysis
- 4.1. Porters Five Forces
- 4.2. Supply/Value Chain
- 4.3. PESTEL analysis
- 4.4. Market Entropy
- 4.5. Patent/Trademark Analysis
- 5. Global Smart Logistic Analysis, Insights and Forecast, 2020-2032
- 5.1. Market Analysis, Insights and Forecast - by Application
- 5.1.1. Manufacturing
- 5.1.2. Power and Energy
- 5.1.3. Food and Beverages
- 5.1.4. Military and Defense
- 5.1.5. Others
- 5.2. Market Analysis, Insights and Forecast - by Type
- 5.2.1. Hardware
- 5.2.2. Software
- 5.2.3. Services
- 5.3. Market Analysis, Insights and Forecast - by Region
- 5.3.1. North America
- 5.3.2. South America
- 5.3.3. Europe
- 5.3.4. Middle East & Africa
- 5.3.5. Asia Pacific
- 5.1. Market Analysis, Insights and Forecast - by Application
- 6. North America Smart Logistic Analysis, Insights and Forecast, 2020-2032
- 6.1. Market Analysis, Insights and Forecast - by Application
- 6.1.1. Manufacturing
- 6.1.2. Power and Energy
- 6.1.3. Food and Beverages
- 6.1.4. Military and Defense
- 6.1.5. Others
- 6.2. Market Analysis, Insights and Forecast - by Type
- 6.2.1. Hardware
- 6.2.2. Software
- 6.2.3. Services
- 6.1. Market Analysis, Insights and Forecast - by Application
- 7. South America Smart Logistic Analysis, Insights and Forecast, 2020-2032
- 7.1. Market Analysis, Insights and Forecast - by Application
- 7.1.1. Manufacturing
- 7.1.2. Power and Energy
- 7.1.3. Food and Beverages
- 7.1.4. Military and Defense
- 7.1.5. Others
- 7.2. Market Analysis, Insights and Forecast - by Type
- 7.2.1. Hardware
- 7.2.2. Software
- 7.2.3. Services
- 7.1. Market Analysis, Insights and Forecast - by Application
- 8. Europe Smart Logistic Analysis, Insights and Forecast, 2020-2032
- 8.1. Market Analysis, Insights and Forecast - by Application
- 8.1.1. Manufacturing
- 8.1.2. Power and Energy
- 8.1.3. Food and Beverages
- 8.1.4. Military and Defense
- 8.1.5. Others
- 8.2. Market Analysis, Insights and Forecast - by Type
- 8.2.1. Hardware
- 8.2.2. Software
- 8.2.3. Services
- 8.1. Market Analysis, Insights and Forecast - by Application
- 9. Middle East & Africa Smart Logistic Analysis, Insights and Forecast, 2020-2032
- 9.1. Market Analysis, Insights and Forecast - by Application
- 9.1.1. Manufacturing
- 9.1.2. Power and Energy
- 9.1.3. Food and Beverages
- 9.1.4. Military and Defense
- 9.1.5. Others
- 9.2. Market Analysis, Insights and Forecast - by Type
- 9.2.1. Hardware
- 9.2.2. Software
- 9.2.3. Services
- 9.1. Market Analysis, Insights and Forecast - by Application
- 10. Asia Pacific Smart Logistic Analysis, Insights and Forecast, 2020-2032
- 10.1. Market Analysis, Insights and Forecast - by Application
- 10.1.1. Manufacturing
- 10.1.2. Power and Energy
- 10.1.3. Food and Beverages
- 10.1.4. Military and Defense
- 10.1.5. Others
- 10.2. Market Analysis, Insights and Forecast - by Type
- 10.2.1. Hardware
- 10.2.2. Software
- 10.2.3. Services
- 10.1. Market Analysis, Insights and Forecast - by Application
- 11. Competitive Analysis
- 11.1. Global Market Share Analysis 2025
- 11.2. Company Profiles
- 11.2.1 IBM Corporation
- 11.2.1.1. Overview
- 11.2.1.2. Products
- 11.2.1.3. SWOT Analysis
- 11.2.1.4. Recent Developments
- 11.2.1.5. Financials (Based on Availability)
- 11.2.2 Intel Corporation
- 11.2.2.1. Overview
- 11.2.2.2. Products
- 11.2.2.3. SWOT Analysis
- 11.2.2.4. Recent Developments
- 11.2.2.5. Financials (Based on Availability)
- 11.2.3 SAP
- 11.2.3.1. Overview
- 11.2.3.2. Products
- 11.2.3.3. SWOT Analysis
- 11.2.3.4. Recent Developments
- 11.2.3.5. Financials (Based on Availability)
- 11.2.4 Cisco Systems
- 11.2.4.1. Overview
- 11.2.4.2. Products
- 11.2.4.3. SWOT Analysis
- 11.2.4.4. Recent Developments
- 11.2.4.5. Financials (Based on Availability)
- 11.2.5 Oracle Corporation
- 11.2.5.1. Overview
- 11.2.5.2. Products
- 11.2.5.3. SWOT Analysis
- 11.2.5.4. Recent Developments
- 11.2.5.5. Financials (Based on Availability)
- 11.2.6 Smart Logistics Gate
- 11.2.6.1. Overview
- 11.2.6.2. Products
- 11.2.6.3. SWOT Analysis
- 11.2.6.4. Recent Developments
- 11.2.6.5. Financials (Based on Availability)
- 11.2.7 T-Systems International
- 11.2.7.1. Overview
- 11.2.7.2. Products
- 11.2.7.3. SWOT Analysis
- 11.2.7.4. Recent Developments
- 11.2.7.5. Financials (Based on Availability)
- 11.2.8 Arkessa
- 11.2.8.1. Overview
- 11.2.8.2. Products
- 11.2.8.3. SWOT Analysis
- 11.2.8.4. Recent Developments
- 11.2.8.5. Financials (Based on Availability)
- 11.2.9 Honeywell International
- 11.2.9.1. Overview
- 11.2.9.2. Products
- 11.2.9.3. SWOT Analysis
- 11.2.9.4. Recent Developments
- 11.2.9.5. Financials (Based on Availability)
- 11.2.1 IBM Corporation
List of Figures
- Figure 1: Global Smart Logistic Revenue Breakdown (undefined, %) by Region 2025 & 2033
- Figure 2: North America Smart Logistic Revenue (undefined), by Application 2025 & 2033
- Figure 3: North America Smart Logistic Revenue Share (%), by Application 2025 & 2033
- Figure 4: North America Smart Logistic Revenue (undefined), by Type 2025 & 2033
- Figure 5: North America Smart Logistic Revenue Share (%), by Type 2025 & 2033
- Figure 6: North America Smart Logistic Revenue (undefined), by Country 2025 & 2033
- Figure 7: North America Smart Logistic Revenue Share (%), by Country 2025 & 2033
- Figure 8: South America Smart Logistic Revenue (undefined), by Application 2025 & 2033
- Figure 9: South America Smart Logistic Revenue Share (%), by Application 2025 & 2033
- Figure 10: South America Smart Logistic Revenue (undefined), by Type 2025 & 2033
- Figure 11: South America Smart Logistic Revenue Share (%), by Type 2025 & 2033
- Figure 12: South America Smart Logistic Revenue (undefined), by Country 2025 & 2033
- Figure 13: South America Smart Logistic Revenue Share (%), by Country 2025 & 2033
- Figure 14: Europe Smart Logistic Revenue (undefined), by Application 2025 & 2033
- Figure 15: Europe Smart Logistic Revenue Share (%), by Application 2025 & 2033
- Figure 16: Europe Smart Logistic Revenue (undefined), by Type 2025 & 2033
- Figure 17: Europe Smart Logistic Revenue Share (%), by Type 2025 & 2033
- Figure 18: Europe Smart Logistic Revenue (undefined), by Country 2025 & 2033
- Figure 19: Europe Smart Logistic Revenue Share (%), by Country 2025 & 2033
- Figure 20: Middle East & Africa Smart Logistic Revenue (undefined), by Application 2025 & 2033
- Figure 21: Middle East & Africa Smart Logistic Revenue Share (%), by Application 2025 & 2033
- Figure 22: Middle East & Africa Smart Logistic Revenue (undefined), by Type 2025 & 2033
- Figure 23: Middle East & Africa Smart Logistic Revenue Share (%), by Type 2025 & 2033
- Figure 24: Middle East & Africa Smart Logistic Revenue (undefined), by Country 2025 & 2033
- Figure 25: Middle East & Africa Smart Logistic Revenue Share (%), by Country 2025 & 2033
- Figure 26: Asia Pacific Smart Logistic Revenue (undefined), by Application 2025 & 2033
- Figure 27: Asia Pacific Smart Logistic Revenue Share (%), by Application 2025 & 2033
- Figure 28: Asia Pacific Smart Logistic Revenue (undefined), by Type 2025 & 2033
- Figure 29: Asia Pacific Smart Logistic Revenue Share (%), by Type 2025 & 2033
- Figure 30: Asia Pacific Smart Logistic Revenue (undefined), by Country 2025 & 2033
- Figure 31: Asia Pacific Smart Logistic Revenue Share (%), by Country 2025 & 2033
List of Tables
- Table 1: Global Smart Logistic Revenue undefined Forecast, by Application 2020 & 2033
- Table 2: Global Smart Logistic Revenue undefined Forecast, by Type 2020 & 2033
- Table 3: Global Smart Logistic Revenue undefined Forecast, by Region 2020 & 2033
- Table 4: Global Smart Logistic Revenue undefined Forecast, by Application 2020 & 2033
- Table 5: Global Smart Logistic Revenue undefined Forecast, by Type 2020 & 2033
- Table 6: Global Smart Logistic Revenue undefined Forecast, by Country 2020 & 2033
- Table 7: United States Smart Logistic Revenue (undefined) Forecast, by Application 2020 & 2033
- Table 8: Canada Smart Logistic Revenue (undefined) Forecast, by Application 2020 & 2033
- Table 9: Mexico Smart Logistic Revenue (undefined) Forecast, by Application 2020 & 2033
- Table 10: Global Smart Logistic Revenue undefined Forecast, by Application 2020 & 2033
- Table 11: Global Smart Logistic Revenue undefined Forecast, by Type 2020 & 2033
- Table 12: Global Smart Logistic Revenue undefined Forecast, by Country 2020 & 2033
- Table 13: Brazil Smart Logistic Revenue (undefined) Forecast, by Application 2020 & 2033
- Table 14: Argentina Smart Logistic Revenue (undefined) Forecast, by Application 2020 & 2033
- Table 15: Rest of South America Smart Logistic Revenue (undefined) Forecast, by Application 2020 & 2033
- Table 16: Global Smart Logistic Revenue undefined Forecast, by Application 2020 & 2033
- Table 17: Global Smart Logistic Revenue undefined Forecast, by Type 2020 & 2033
- Table 18: Global Smart Logistic Revenue undefined Forecast, by Country 2020 & 2033
- Table 19: United Kingdom Smart Logistic Revenue (undefined) Forecast, by Application 2020 & 2033
- Table 20: Germany Smart Logistic Revenue (undefined) Forecast, by Application 2020 & 2033
- Table 21: France Smart Logistic Revenue (undefined) Forecast, by Application 2020 & 2033
- Table 22: Italy Smart Logistic Revenue (undefined) Forecast, by Application 2020 & 2033
- Table 23: Spain Smart Logistic Revenue (undefined) Forecast, by Application 2020 & 2033
- Table 24: Russia Smart Logistic Revenue (undefined) Forecast, by Application 2020 & 2033
- Table 25: Benelux Smart Logistic Revenue (undefined) Forecast, by Application 2020 & 2033
- Table 26: Nordics Smart Logistic Revenue (undefined) Forecast, by Application 2020 & 2033
- Table 27: Rest of Europe Smart Logistic Revenue (undefined) Forecast, by Application 2020 & 2033
- Table 28: Global Smart Logistic Revenue undefined Forecast, by Application 2020 & 2033
- Table 29: Global Smart Logistic Revenue undefined Forecast, by Type 2020 & 2033
- Table 30: Global Smart Logistic Revenue undefined Forecast, by Country 2020 & 2033
- Table 31: Turkey Smart Logistic Revenue (undefined) Forecast, by Application 2020 & 2033
- Table 32: Israel Smart Logistic Revenue (undefined) Forecast, by Application 2020 & 2033
- Table 33: GCC Smart Logistic Revenue (undefined) Forecast, by Application 2020 & 2033
- Table 34: North Africa Smart Logistic Revenue (undefined) Forecast, by Application 2020 & 2033
- Table 35: South Africa Smart Logistic Revenue (undefined) Forecast, by Application 2020 & 2033
- Table 36: Rest of Middle East & Africa Smart Logistic Revenue (undefined) Forecast, by Application 2020 & 2033
- Table 37: Global Smart Logistic Revenue undefined Forecast, by Application 2020 & 2033
- Table 38: Global Smart Logistic Revenue undefined Forecast, by Type 2020 & 2033
- Table 39: Global Smart Logistic Revenue undefined Forecast, by Country 2020 & 2033
- Table 40: China Smart Logistic Revenue (undefined) Forecast, by Application 2020 & 2033
- Table 41: India Smart Logistic Revenue (undefined) Forecast, by Application 2020 & 2033
- Table 42: Japan Smart Logistic Revenue (undefined) Forecast, by Application 2020 & 2033
- Table 43: South Korea Smart Logistic Revenue (undefined) Forecast, by Application 2020 & 2033
- Table 44: ASEAN Smart Logistic Revenue (undefined) Forecast, by Application 2020 & 2033
- Table 45: Oceania Smart Logistic Revenue (undefined) Forecast, by Application 2020 & 2033
- Table 46: Rest of Asia Pacific Smart Logistic Revenue (undefined) Forecast, by Application 2020 & 2033
Frequently Asked Questions
1. What is the projected Compound Annual Growth Rate (CAGR) of the Smart Logistic?
The projected CAGR is approximately 20.8%.
2. Which companies are prominent players in the Smart Logistic?
Key companies in the market include IBM Corporation, Intel Corporation, SAP, Cisco Systems, Oracle Corporation, Smart Logistics Gate, T-Systems International, Arkessa, Honeywell International.
3. What are the main segments of the Smart Logistic?
The market segments include Application, Type.
4. Can you provide details about the market size?
The market size is estimated to be USD XXX N/A as of 2022.
5. What are some drivers contributing to market growth?
N/A
6. What are the notable trends driving market growth?
N/A
7. Are there any restraints impacting market growth?
N/A
8. Can you provide examples of recent developments in the market?
N/A
9. What pricing options are available for accessing the report?
Pricing options include single-user, multi-user, and enterprise licenses priced at USD 2900.00, USD 4350.00, and USD 5800.00 respectively.
10. Is the market size provided in terms of value or volume?
The market size is provided in terms of value, measured in N/A.
11. Are there any specific market keywords associated with the report?
Yes, the market keyword associated with the report is "Smart Logistic," which aids in identifying and referencing the specific market segment covered.
12. How do I determine which pricing option suits my needs best?
The pricing options vary based on user requirements and access needs. Individual users may opt for single-user licenses, while businesses requiring broader access may choose multi-user or enterprise licenses for cost-effective access to the report.
13. Are there any additional resources or data provided in the Smart Logistic report?
While the report offers comprehensive insights, it's advisable to review the specific contents or supplementary materials provided to ascertain if additional resources or data are available.
14. How can I stay updated on further developments or reports in the Smart Logistic?
To stay informed about further developments, trends, and reports in the Smart Logistic, consider subscribing to industry newsletters, following relevant companies and organizations, or regularly checking reputable industry news sources and publications.
Methodology
Step 1 - Identification of Relevant Samples Size from Population Database


Step 2 - Approaches for Defining Global Market Size (Value, Volume* & Price*)

Note*: In applicable scenarios
Step 3 - Data Sources
Primary Research
- Web Analytics
- Survey Reports
- Research Institute
- Latest Research Reports
- Opinion Leaders
Secondary Research
- Annual Reports
- White Paper
- Latest Press Release
- Industry Association
- Paid Database
- Investor Presentations

Step 4 - Data Triangulation
Involves using different sources of information in order to increase the validity of a study
These sources are likely to be stakeholders in a program - participants, other researchers, program staff, other community members, and so on.
Then we put all data in single framework & apply various statistical tools to find out the dynamic on the market.
During the analysis stage, feedback from the stakeholder groups would be compared to determine areas of agreement as well as areas of divergence