

Key Insights
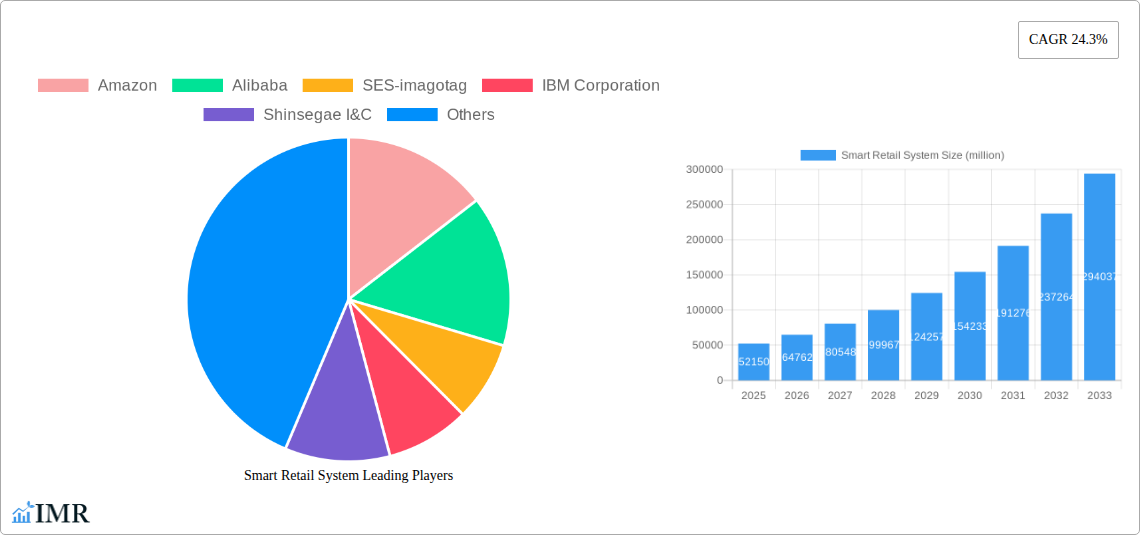
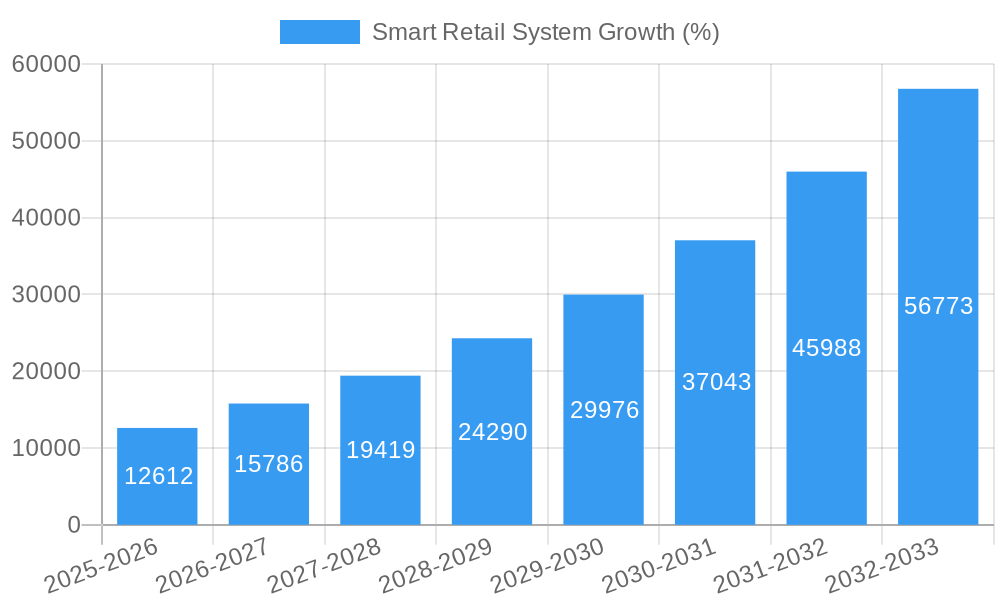
The smart retail system market is experiencing robust growth, projected to reach \$52,150 million in 2025 and exhibiting a Compound Annual Growth Rate (CAGR) of 24.3% from 2019 to 2033. This expansion is fueled by several key drivers. The increasing adoption of e-commerce and omnichannel strategies necessitates seamless integration of online and offline retail experiences, a key function of smart retail systems. Furthermore, the rising demand for personalized customer experiences and data-driven decision-making is pushing retailers to invest in advanced technologies like AI-powered analytics and RFID tracking, which are core components of these systems. The growing need for improved inventory management and reduced operational costs further bolsters market growth. Competition is fierce, with major players like Amazon, Alibaba, and IBM leading the way, alongside specialized companies such as SES-imagotag and Pricer. Innovation in areas like computer vision, IoT sensors, and cloud-based solutions will continue to shape the market landscape, encouraging further growth and adoption.
While the market faces challenges like high initial investment costs and the need for robust cybersecurity measures, the long-term benefits—enhanced operational efficiency, increased customer satisfaction, and better data insights—outweigh these drawbacks. The segmentation of the market is likely diverse, encompassing solutions for various retail formats (e.g., grocery, apparel, electronics) and functional areas (e.g., inventory management, customer engagement, pricing optimization). Geographic distribution will also vary, with mature markets in North America and Europe likely showing steady growth, while emerging markets in Asia-Pacific and Latin America present significant opportunities for expansion. The forecast period (2025-2033) anticipates continued market expansion driven by technological advancements and increasing digital transformation across the retail sector.
Smart Retail System Market Report: 2019-2033
This comprehensive report provides an in-depth analysis of the global Smart Retail System market, encompassing market dynamics, growth trends, regional dominance, product landscape, key players, and future outlook. With a study period spanning 2019-2033, a base year of 2025, and a forecast period of 2025-2033, this report is an indispensable resource for industry professionals, investors, and strategic decision-makers seeking to navigate this rapidly evolving landscape. The parent market is the broader Retail Technology sector, while the child market focuses specifically on intelligent systems enhancing retail operations. The total market value in 2025 is estimated at $xx billion.
Smart Retail System Market Dynamics & Structure
The Smart Retail System market is characterized by a moderately concentrated landscape, with key players like Amazon, Alibaba, and IBM Corporation holding significant market share. However, the emergence of innovative solutions from smaller companies is fostering increased competition. Technological innovation, driven by advancements in AI, IoT, and cloud computing, is a major growth driver. Regulatory frameworks, particularly concerning data privacy and security, are shaping market dynamics. Competitive product substitutes include traditional retail systems and less sophisticated automated solutions. The end-user demographic spans large retailers, small and medium-sized enterprises (SMEs), and e-commerce businesses. M&A activity has been moderate, with approximately xx deals recorded during the historical period (2019-2024), primarily focusing on expanding technological capabilities and market reach.
- Market Concentration: Moderately concentrated, with top 5 players holding approximately xx% market share in 2025.
- Technological Innovation: AI, IoT, and cloud computing are primary drivers, fostering the development of advanced analytics and automation capabilities.
- Regulatory Framework: Data privacy regulations (e.g., GDPR) and cybersecurity standards influence system development and deployment.
- Competitive Substitutes: Traditional retail systems and less advanced automation technologies pose a competitive threat.
- End-User Demographics: Large retailers, SMEs, and e-commerce businesses comprise the primary user base.
- M&A Trends: Approximately xx M&A deals occurred between 2019-2024, focusing on technological integration and market expansion. This is predicted to increase to xx deals in the forecast period.
Smart Retail System Growth Trends & Insights
The Smart Retail System market has exhibited significant growth during the historical period (2019-2024), with a CAGR of xx%. This growth is attributed to the increasing adoption of digital technologies within the retail sector, driven by the need for enhanced operational efficiency, improved customer experience, and data-driven decision-making. The market size is projected to reach $xx billion by 2033, driven by factors such as the rising penetration of e-commerce, increasing consumer demand for personalized experiences, and the growing adoption of omnichannel strategies. Technological disruptions, such as the rise of 5G and edge computing, are expected to further accelerate market expansion. Shifting consumer preferences towards convenience, personalization, and seamless shopping experiences are also fueling market growth. Market penetration is expected to reach xx% by 2033.
Dominant Regions, Countries, or Segments in Smart Retail System
North America currently holds the largest market share, driven by high technology adoption rates, robust infrastructure, and a strong focus on innovation among retailers. However, Asia-Pacific is projected to experience the fastest growth rate during the forecast period, fueled by the rapid expansion of e-commerce, increasing disposable incomes, and government initiatives promoting digital transformation. The grocery segment is anticipated to be the largest segment in 2025.
- North America: High technology adoption, robust infrastructure, strong innovation focus.
- Asia-Pacific: Rapid e-commerce expansion, rising disposable incomes, government support for digitalization.
- Europe: Growing adoption of smart retail solutions, stringent data privacy regulations.
- Grocery Segment: Largest market segment due to high demand for efficient inventory management and customer experience optimization.
Smart Retail System Product Landscape
Smart retail systems encompass a diverse range of products, including intelligent shelves, digital signage, RFID-enabled inventory management systems, AI-powered customer analytics platforms, and smart checkout solutions. These solutions deliver enhanced inventory visibility, personalized customer experiences, optimized store operations, and data-driven insights for retailers. Key advancements include improved integration with existing retail systems and the increasing use of AI and machine learning for predictive analytics and automation. Unique selling propositions include improved operational efficiency, enhanced customer experience, and data-driven decision-making capabilities.
Key Drivers, Barriers & Challenges in Smart Retail System
Key Drivers:
- Increased demand for enhanced operational efficiency and reduced operational costs.
- Growing consumer preference for personalized shopping experiences and seamless omnichannel interactions.
- Advancements in AI, IoT, and cloud computing enabling development of sophisticated retail solutions.
Key Barriers & Challenges:
- High initial investment costs associated with implementing smart retail systems.
- Concerns about data privacy and security, particularly with the collection and usage of customer data.
- Integration complexities with existing legacy retail systems. This factor alone represents a xx% impediment to market growth.
Emerging Opportunities in Smart Retail System
Untapped markets in developing economies present significant opportunities. The integration of augmented reality (AR) and virtual reality (VR) technologies for enhanced customer engagement also presents a key opportunity. Evolving consumer preferences towards sustainability and ethical sourcing are creating new demand for smart retail solutions that support responsible practices.
Growth Accelerators in the Smart Retail System Industry
Technological breakthroughs in AI, IoT, and 5G are accelerating market growth. Strategic partnerships between technology providers and retailers are fostering innovation and market expansion. Government initiatives promoting digital transformation in the retail sector are further stimulating market growth.
Key Players Shaping the Smart Retail System Market
- Amazon
- Alibaba
- SES-imagotag
- IBM Corporation
- Shinsegae I&C
- SOLUM ESL
- Pricer
- Intel Corporation
- NEC Corporation
- Cisco Systems
- Wipro Technologies
- Displaydata
- Trax
- Telit
- Bossa Nova Robotics
- Adastra Corporation
- AWM
Notable Milestones in Smart Retail System Sector
- 2020: Amazon launches Just Walk Out technology in select stores.
- 2021: Alibaba expands its smart retail initiatives in China.
- 2022: Several key partnerships formed between retailers and technology providers for integrated smart retail solutions.
- 2023: Significant investment in R&D across the sector leads to breakthroughs in AI-powered inventory management.
- 2024: Increased regulatory scrutiny around data privacy in the smart retail space.
In-Depth Smart Retail System Market Outlook
The Smart Retail System market is poised for sustained growth over the forecast period (2025-2033), driven by ongoing technological advancements, increasing adoption rates among retailers, and evolving consumer expectations. Strategic partnerships, investments in R&D, and expansion into untapped markets will further fuel market growth. The integration of innovative technologies such as AR/VR and the development of more sophisticated analytics capabilities will continue to shape the market landscape. The market holds significant potential for companies that can effectively leverage technological advancements to deliver enhanced customer experiences and optimized operational efficiency.
Smart Retail System Segmentation
-
1. Application
- 1.1. Supermarket
- 1.2. Convenience Store
- 1.3. Others
-
2. Type
- 2.1. Hardware
- 2.2. Software
- 2.3. Service
Smart Retail System Segmentation By Geography
-
1. North America
- 1.1. United States
- 1.2. Canada
- 1.3. Mexico
-
2. South America
- 2.1. Brazil
- 2.2. Argentina
- 2.3. Rest of South America
-
3. Europe
- 3.1. United Kingdom
- 3.2. Germany
- 3.3. France
- 3.4. Italy
- 3.5. Spain
- 3.6. Russia
- 3.7. Benelux
- 3.8. Nordics
- 3.9. Rest of Europe
-
4. Middle East & Africa
- 4.1. Turkey
- 4.2. Israel
- 4.3. GCC
- 4.4. North Africa
- 4.5. South Africa
- 4.6. Rest of Middle East & Africa
-
5. Asia Pacific
- 5.1. China
- 5.2. India
- 5.3. Japan
- 5.4. South Korea
- 5.5. ASEAN
- 5.6. Oceania
- 5.7. Rest of Asia Pacific

Smart Retail System REPORT HIGHLIGHTS
| Aspects | Details |
|---|---|
| Study Period | 2019-2033 |
| Base Year | 2024 |
| Estimated Year | 2025 |
| Forecast Period | 2025-2033 |
| Historical Period | 2019-2024 |
| Growth Rate | CAGR of 24.3% from 2019-2033 |
| Segmentation |
|
Table of Contents
- 1. Introduction
- 1.1. Research Scope
- 1.2. Market Segmentation
- 1.3. Research Methodology
- 1.4. Definitions and Assumptions
- 2. Executive Summary
- 2.1. Introduction
- 3. Market Dynamics
- 3.1. Introduction
- 3.2. Market Drivers
- 3.3. Market Restrains
- 3.4. Market Trends
- 4. Market Factor Analysis
- 4.1. Porters Five Forces
- 4.2. Supply/Value Chain
- 4.3. PESTEL analysis
- 4.4. Market Entropy
- 4.5. Patent/Trademark Analysis
- 5. Global Smart Retail System Analysis, Insights and Forecast, 2019-2031
- 5.1. Market Analysis, Insights and Forecast - by Application
- 5.1.1. Supermarket
- 5.1.2. Convenience Store
- 5.1.3. Others
- 5.2. Market Analysis, Insights and Forecast - by Type
- 5.2.1. Hardware
- 5.2.2. Software
- 5.2.3. Service
- 5.3. Market Analysis, Insights and Forecast - by Region
- 5.3.1. North America
- 5.3.2. South America
- 5.3.3. Europe
- 5.3.4. Middle East & Africa
- 5.3.5. Asia Pacific
- 5.1. Market Analysis, Insights and Forecast - by Application
- 6. North America Smart Retail System Analysis, Insights and Forecast, 2019-2031
- 6.1. Market Analysis, Insights and Forecast - by Application
- 6.1.1. Supermarket
- 6.1.2. Convenience Store
- 6.1.3. Others
- 6.2. Market Analysis, Insights and Forecast - by Type
- 6.2.1. Hardware
- 6.2.2. Software
- 6.2.3. Service
- 6.1. Market Analysis, Insights and Forecast - by Application
- 7. South America Smart Retail System Analysis, Insights and Forecast, 2019-2031
- 7.1. Market Analysis, Insights and Forecast - by Application
- 7.1.1. Supermarket
- 7.1.2. Convenience Store
- 7.1.3. Others
- 7.2. Market Analysis, Insights and Forecast - by Type
- 7.2.1. Hardware
- 7.2.2. Software
- 7.2.3. Service
- 7.1. Market Analysis, Insights and Forecast - by Application
- 8. Europe Smart Retail System Analysis, Insights and Forecast, 2019-2031
- 8.1. Market Analysis, Insights and Forecast - by Application
- 8.1.1. Supermarket
- 8.1.2. Convenience Store
- 8.1.3. Others
- 8.2. Market Analysis, Insights and Forecast - by Type
- 8.2.1. Hardware
- 8.2.2. Software
- 8.2.3. Service
- 8.1. Market Analysis, Insights and Forecast - by Application
- 9. Middle East & Africa Smart Retail System Analysis, Insights and Forecast, 2019-2031
- 9.1. Market Analysis, Insights and Forecast - by Application
- 9.1.1. Supermarket
- 9.1.2. Convenience Store
- 9.1.3. Others
- 9.2. Market Analysis, Insights and Forecast - by Type
- 9.2.1. Hardware
- 9.2.2. Software
- 9.2.3. Service
- 9.1. Market Analysis, Insights and Forecast - by Application
- 10. Asia Pacific Smart Retail System Analysis, Insights and Forecast, 2019-2031
- 10.1. Market Analysis, Insights and Forecast - by Application
- 10.1.1. Supermarket
- 10.1.2. Convenience Store
- 10.1.3. Others
- 10.2. Market Analysis, Insights and Forecast - by Type
- 10.2.1. Hardware
- 10.2.2. Software
- 10.2.3. Service
- 10.1. Market Analysis, Insights and Forecast - by Application
- 11. Competitive Analysis
- 11.1. Global Market Share Analysis 2024
- 11.2. Company Profiles
- 11.2.1 Amazon
- 11.2.1.1. Overview
- 11.2.1.2. Products
- 11.2.1.3. SWOT Analysis
- 11.2.1.4. Recent Developments
- 11.2.1.5. Financials (Based on Availability)
- 11.2.2 Alibaba
- 11.2.2.1. Overview
- 11.2.2.2. Products
- 11.2.2.3. SWOT Analysis
- 11.2.2.4. Recent Developments
- 11.2.2.5. Financials (Based on Availability)
- 11.2.3 SES-imagotag
- 11.2.3.1. Overview
- 11.2.3.2. Products
- 11.2.3.3. SWOT Analysis
- 11.2.3.4. Recent Developments
- 11.2.3.5. Financials (Based on Availability)
- 11.2.4 IBM Corporation
- 11.2.4.1. Overview
- 11.2.4.2. Products
- 11.2.4.3. SWOT Analysis
- 11.2.4.4. Recent Developments
- 11.2.4.5. Financials (Based on Availability)
- 11.2.5 Shinsegae I&C
- 11.2.5.1. Overview
- 11.2.5.2. Products
- 11.2.5.3. SWOT Analysis
- 11.2.5.4. Recent Developments
- 11.2.5.5. Financials (Based on Availability)
- 11.2.6 Google
- 11.2.6.1. Overview
- 11.2.6.2. Products
- 11.2.6.3. SWOT Analysis
- 11.2.6.4. Recent Developments
- 11.2.6.5. Financials (Based on Availability)
- 11.2.7 SOLUM ESL
- 11.2.7.1. Overview
- 11.2.7.2. Products
- 11.2.7.3. SWOT Analysis
- 11.2.7.4. Recent Developments
- 11.2.7.5. Financials (Based on Availability)
- 11.2.8 Pricer
- 11.2.8.1. Overview
- 11.2.8.2. Products
- 11.2.8.3. SWOT Analysis
- 11.2.8.4. Recent Developments
- 11.2.8.5. Financials (Based on Availability)
- 11.2.9 Intel Corporation
- 11.2.9.1. Overview
- 11.2.9.2. Products
- 11.2.9.3. SWOT Analysis
- 11.2.9.4. Recent Developments
- 11.2.9.5. Financials (Based on Availability)
- 11.2.10 NEC Corporation
- 11.2.10.1. Overview
- 11.2.10.2. Products
- 11.2.10.3. SWOT Analysis
- 11.2.10.4. Recent Developments
- 11.2.10.5. Financials (Based on Availability)
- 11.2.11 Cisco Systems
- 11.2.11.1. Overview
- 11.2.11.2. Products
- 11.2.11.3. SWOT Analysis
- 11.2.11.4. Recent Developments
- 11.2.11.5. Financials (Based on Availability)
- 11.2.12 Wipro Technologies
- 11.2.12.1. Overview
- 11.2.12.2. Products
- 11.2.12.3. SWOT Analysis
- 11.2.12.4. Recent Developments
- 11.2.12.5. Financials (Based on Availability)
- 11.2.13 Displaydata
- 11.2.13.1. Overview
- 11.2.13.2. Products
- 11.2.13.3. SWOT Analysis
- 11.2.13.4. Recent Developments
- 11.2.13.5. Financials (Based on Availability)
- 11.2.14 Trax
- 11.2.14.1. Overview
- 11.2.14.2. Products
- 11.2.14.3. SWOT Analysis
- 11.2.14.4. Recent Developments
- 11.2.14.5. Financials (Based on Availability)
- 11.2.15 Telit
- 11.2.15.1. Overview
- 11.2.15.2. Products
- 11.2.15.3. SWOT Analysis
- 11.2.15.4. Recent Developments
- 11.2.15.5. Financials (Based on Availability)
- 11.2.16 Bossa Nova Robotics
- 11.2.16.1. Overview
- 11.2.16.2. Products
- 11.2.16.3. SWOT Analysis
- 11.2.16.4. Recent Developments
- 11.2.16.5. Financials (Based on Availability)
- 11.2.17 Adastra Corporation
- 11.2.17.1. Overview
- 11.2.17.2. Products
- 11.2.17.3. SWOT Analysis
- 11.2.17.4. Recent Developments
- 11.2.17.5. Financials (Based on Availability)
- 11.2.18 AWM
- 11.2.18.1. Overview
- 11.2.18.2. Products
- 11.2.18.3. SWOT Analysis
- 11.2.18.4. Recent Developments
- 11.2.18.5. Financials (Based on Availability)
- 11.2.1 Amazon
List of Figures
- Figure 1: Global Smart Retail System Revenue Breakdown (million, %) by Region 2024 & 2032
- Figure 2: North America Smart Retail System Revenue (million), by Application 2024 & 2032
- Figure 3: North America Smart Retail System Revenue Share (%), by Application 2024 & 2032
- Figure 4: North America Smart Retail System Revenue (million), by Type 2024 & 2032
- Figure 5: North America Smart Retail System Revenue Share (%), by Type 2024 & 2032
- Figure 6: North America Smart Retail System Revenue (million), by Country 2024 & 2032
- Figure 7: North America Smart Retail System Revenue Share (%), by Country 2024 & 2032
- Figure 8: South America Smart Retail System Revenue (million), by Application 2024 & 2032
- Figure 9: South America Smart Retail System Revenue Share (%), by Application 2024 & 2032
- Figure 10: South America Smart Retail System Revenue (million), by Type 2024 & 2032
- Figure 11: South America Smart Retail System Revenue Share (%), by Type 2024 & 2032
- Figure 12: South America Smart Retail System Revenue (million), by Country 2024 & 2032
- Figure 13: South America Smart Retail System Revenue Share (%), by Country 2024 & 2032
- Figure 14: Europe Smart Retail System Revenue (million), by Application 2024 & 2032
- Figure 15: Europe Smart Retail System Revenue Share (%), by Application 2024 & 2032
- Figure 16: Europe Smart Retail System Revenue (million), by Type 2024 & 2032
- Figure 17: Europe Smart Retail System Revenue Share (%), by Type 2024 & 2032
- Figure 18: Europe Smart Retail System Revenue (million), by Country 2024 & 2032
- Figure 19: Europe Smart Retail System Revenue Share (%), by Country 2024 & 2032
- Figure 20: Middle East & Africa Smart Retail System Revenue (million), by Application 2024 & 2032
- Figure 21: Middle East & Africa Smart Retail System Revenue Share (%), by Application 2024 & 2032
- Figure 22: Middle East & Africa Smart Retail System Revenue (million), by Type 2024 & 2032
- Figure 23: Middle East & Africa Smart Retail System Revenue Share (%), by Type 2024 & 2032
- Figure 24: Middle East & Africa Smart Retail System Revenue (million), by Country 2024 & 2032
- Figure 25: Middle East & Africa Smart Retail System Revenue Share (%), by Country 2024 & 2032
- Figure 26: Asia Pacific Smart Retail System Revenue (million), by Application 2024 & 2032
- Figure 27: Asia Pacific Smart Retail System Revenue Share (%), by Application 2024 & 2032
- Figure 28: Asia Pacific Smart Retail System Revenue (million), by Type 2024 & 2032
- Figure 29: Asia Pacific Smart Retail System Revenue Share (%), by Type 2024 & 2032
- Figure 30: Asia Pacific Smart Retail System Revenue (million), by Country 2024 & 2032
- Figure 31: Asia Pacific Smart Retail System Revenue Share (%), by Country 2024 & 2032
List of Tables
- Table 1: Global Smart Retail System Revenue million Forecast, by Region 2019 & 2032
- Table 2: Global Smart Retail System Revenue million Forecast, by Application 2019 & 2032
- Table 3: Global Smart Retail System Revenue million Forecast, by Type 2019 & 2032
- Table 4: Global Smart Retail System Revenue million Forecast, by Region 2019 & 2032
- Table 5: Global Smart Retail System Revenue million Forecast, by Application 2019 & 2032
- Table 6: Global Smart Retail System Revenue million Forecast, by Type 2019 & 2032
- Table 7: Global Smart Retail System Revenue million Forecast, by Country 2019 & 2032
- Table 8: United States Smart Retail System Revenue (million) Forecast, by Application 2019 & 2032
- Table 9: Canada Smart Retail System Revenue (million) Forecast, by Application 2019 & 2032
- Table 10: Mexico Smart Retail System Revenue (million) Forecast, by Application 2019 & 2032
- Table 11: Global Smart Retail System Revenue million Forecast, by Application 2019 & 2032
- Table 12: Global Smart Retail System Revenue million Forecast, by Type 2019 & 2032
- Table 13: Global Smart Retail System Revenue million Forecast, by Country 2019 & 2032
- Table 14: Brazil Smart Retail System Revenue (million) Forecast, by Application 2019 & 2032
- Table 15: Argentina Smart Retail System Revenue (million) Forecast, by Application 2019 & 2032
- Table 16: Rest of South America Smart Retail System Revenue (million) Forecast, by Application 2019 & 2032
- Table 17: Global Smart Retail System Revenue million Forecast, by Application 2019 & 2032
- Table 18: Global Smart Retail System Revenue million Forecast, by Type 2019 & 2032
- Table 19: Global Smart Retail System Revenue million Forecast, by Country 2019 & 2032
- Table 20: United Kingdom Smart Retail System Revenue (million) Forecast, by Application 2019 & 2032
- Table 21: Germany Smart Retail System Revenue (million) Forecast, by Application 2019 & 2032
- Table 22: France Smart Retail System Revenue (million) Forecast, by Application 2019 & 2032
- Table 23: Italy Smart Retail System Revenue (million) Forecast, by Application 2019 & 2032
- Table 24: Spain Smart Retail System Revenue (million) Forecast, by Application 2019 & 2032
- Table 25: Russia Smart Retail System Revenue (million) Forecast, by Application 2019 & 2032
- Table 26: Benelux Smart Retail System Revenue (million) Forecast, by Application 2019 & 2032
- Table 27: Nordics Smart Retail System Revenue (million) Forecast, by Application 2019 & 2032
- Table 28: Rest of Europe Smart Retail System Revenue (million) Forecast, by Application 2019 & 2032
- Table 29: Global Smart Retail System Revenue million Forecast, by Application 2019 & 2032
- Table 30: Global Smart Retail System Revenue million Forecast, by Type 2019 & 2032
- Table 31: Global Smart Retail System Revenue million Forecast, by Country 2019 & 2032
- Table 32: Turkey Smart Retail System Revenue (million) Forecast, by Application 2019 & 2032
- Table 33: Israel Smart Retail System Revenue (million) Forecast, by Application 2019 & 2032
- Table 34: GCC Smart Retail System Revenue (million) Forecast, by Application 2019 & 2032
- Table 35: North Africa Smart Retail System Revenue (million) Forecast, by Application 2019 & 2032
- Table 36: South Africa Smart Retail System Revenue (million) Forecast, by Application 2019 & 2032
- Table 37: Rest of Middle East & Africa Smart Retail System Revenue (million) Forecast, by Application 2019 & 2032
- Table 38: Global Smart Retail System Revenue million Forecast, by Application 2019 & 2032
- Table 39: Global Smart Retail System Revenue million Forecast, by Type 2019 & 2032
- Table 40: Global Smart Retail System Revenue million Forecast, by Country 2019 & 2032
- Table 41: China Smart Retail System Revenue (million) Forecast, by Application 2019 & 2032
- Table 42: India Smart Retail System Revenue (million) Forecast, by Application 2019 & 2032
- Table 43: Japan Smart Retail System Revenue (million) Forecast, by Application 2019 & 2032
- Table 44: South Korea Smart Retail System Revenue (million) Forecast, by Application 2019 & 2032
- Table 45: ASEAN Smart Retail System Revenue (million) Forecast, by Application 2019 & 2032
- Table 46: Oceania Smart Retail System Revenue (million) Forecast, by Application 2019 & 2032
- Table 47: Rest of Asia Pacific Smart Retail System Revenue (million) Forecast, by Application 2019 & 2032
Frequently Asked Questions
1. What is the projected Compound Annual Growth Rate (CAGR) of the Smart Retail System?
The projected CAGR is approximately 24.3%.
2. Which companies are prominent players in the Smart Retail System?
Key companies in the market include Amazon, Alibaba, SES-imagotag, IBM Corporation, Shinsegae I&C, Google, SOLUM ESL, Pricer, Intel Corporation, NEC Corporation, Cisco Systems, Wipro Technologies, Displaydata, Trax, Telit, Bossa Nova Robotics, Adastra Corporation, AWM.
3. What are the main segments of the Smart Retail System?
The market segments include Application, Type.
4. Can you provide details about the market size?
The market size is estimated to be USD 52150 million as of 2022.
5. What are some drivers contributing to market growth?
N/A
6. What are the notable trends driving market growth?
N/A
7. Are there any restraints impacting market growth?
N/A
8. Can you provide examples of recent developments in the market?
N/A
9. What pricing options are available for accessing the report?
Pricing options include single-user, multi-user, and enterprise licenses priced at USD 2900.00, USD 4350.00, and USD 5800.00 respectively.
10. Is the market size provided in terms of value or volume?
The market size is provided in terms of value, measured in million.
11. Are there any specific market keywords associated with the report?
Yes, the market keyword associated with the report is "Smart Retail System," which aids in identifying and referencing the specific market segment covered.
12. How do I determine which pricing option suits my needs best?
The pricing options vary based on user requirements and access needs. Individual users may opt for single-user licenses, while businesses requiring broader access may choose multi-user or enterprise licenses for cost-effective access to the report.
13. Are there any additional resources or data provided in the Smart Retail System report?
While the report offers comprehensive insights, it's advisable to review the specific contents or supplementary materials provided to ascertain if additional resources or data are available.
14. How can I stay updated on further developments or reports in the Smart Retail System?
To stay informed about further developments, trends, and reports in the Smart Retail System, consider subscribing to industry newsletters, following relevant companies and organizations, or regularly checking reputable industry news sources and publications.
Methodology
Step 1 - Identification of Relevant Samples Size from Population Database


Step 2 - Approaches for Defining Global Market Size (Value, Volume* & Price*)

Note*: In applicable scenarios
Step 3 - Data Sources
Primary Research
- Web Analytics
- Survey Reports
- Research Institute
- Latest Research Reports
- Opinion Leaders
Secondary Research
- Annual Reports
- White Paper
- Latest Press Release
- Industry Association
- Paid Database
- Investor Presentations

Step 4 - Data Triangulation
Involves using different sources of information in order to increase the validity of a study
These sources are likely to be stakeholders in a program - participants, other researchers, program staff, other community members, and so on.
Then we put all data in single framework & apply various statistical tools to find out the dynamic on the market.
During the analysis stage, feedback from the stakeholder groups would be compared to determine areas of agreement as well as areas of divergence
