

Key Insights
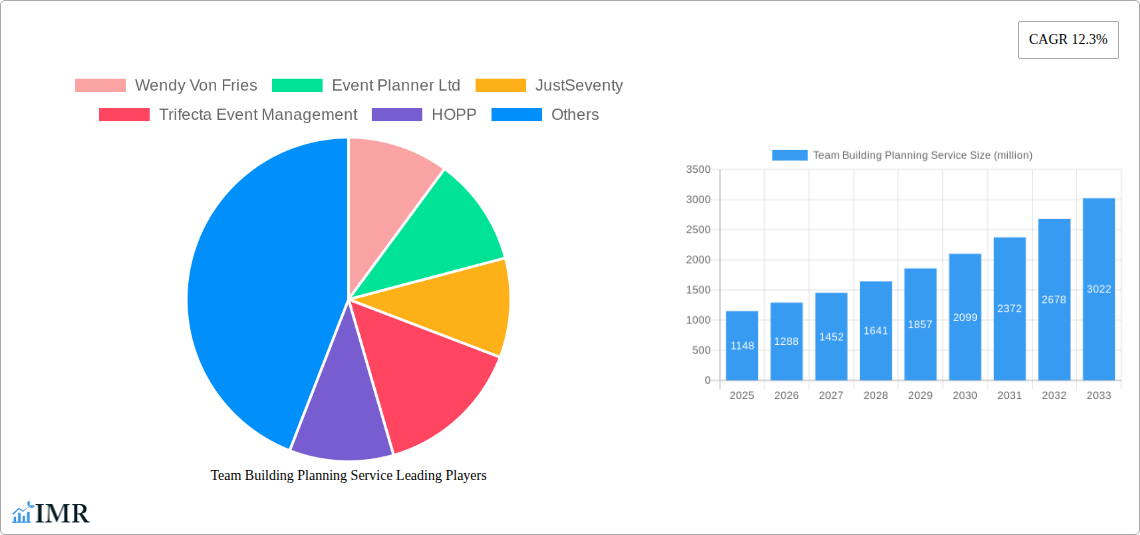
The global Team Building Planning Service market is experiencing robust growth, projected to reach $1148 million in 2025 and maintain a Compound Annual Growth Rate (CAGR) of 12.3% from 2025 to 2033. This expansion is fueled by several key drivers. The increasing emphasis on employee engagement and improved workplace culture is prompting organizations of all sizes to invest more in team-building activities. Furthermore, a rise in remote work necessitates innovative and engaging virtual team-building solutions, creating a new avenue for growth. The market's growth is also propelled by the growing awareness of the positive impact of team building on employee productivity, morale, and overall business performance. Competitive pressures are also pushing companies to continually seek ways to differentiate their employer brand, with team-building initiatives playing a crucial role. While the market faces challenges like economic downturns that might temporarily reduce spending on non-essential activities, the long-term outlook remains positive due to the enduring need for strong teamwork and improved employee relations.
The market is segmented based on various factors such as the type of activities offered (adventure, creative, educational, etc.), target audience (corporate, non-profit, etc.), and service delivery mode (in-person, virtual). Key players like Wendy Von Fries, Event Planner Ltd, JustSeventy, and others are shaping the market landscape through innovation in activity design, technology integration, and service offerings. Geographical growth varies, with North America and Europe expected to maintain a significant market share, driven by high corporate spending on employee development and established team-building cultures. However, Asia-Pacific and other emerging markets present promising growth opportunities due to increasing awareness of team-building benefits and growing business sectors. The forecast period (2025-2033) anticipates sustained market growth, driven by ongoing technological advancements and evolving employee expectations. Effective strategies for market players will involve adapting to shifting trends, focusing on delivering measurable ROI for clients, and continually improving the quality and relevance of team-building experiences.
Team Building Planning Service Market Report: 2019-2033
This comprehensive report provides an in-depth analysis of the global Team Building Planning Service market, offering invaluable insights for industry professionals, investors, and strategic decision-makers. We cover market dynamics, growth trends, key players, and future outlook, using data from the study period 2019-2024, with a base year of 2025 and forecast period 2025-2033. The report segments the market by various factors (details below), allowing for targeted analysis of specific niches.
Team Building Planning Service Market Dynamics & Structure
The global Team Building Planning Service market, valued at $XX million in 2025, exhibits a moderately concentrated structure with several established players and a growing number of niche providers. Technological advancements, particularly in virtual team-building platforms and personalized experience design, are significant drivers. Regulatory frameworks concerning data privacy and worker safety influence service delivery. Competitive substitutes include in-house team-building initiatives and off-the-shelf activity kits. End-user demographics are diverse, encompassing corporations of all sizes, non-profit organizations and educational institutions. M&A activity in the sector remains moderate, with a projected XX number of deals in 2025.
- Market Concentration: Moderately concentrated, with top 5 players holding approximately XX% market share in 2025.
- Technological Innovation: Virtual reality (VR), augmented reality (AR), and gamification are key drivers, alongside personalized experiences.
- Regulatory Landscape: Compliance with data privacy regulations (GDPR, CCPA) and workplace safety standards significantly impacts operations.
- Competitive Substitutes: In-house activities, pre-packaged team-building kits, and online resources represent key competitive pressures.
- End-User Demographics: Corporations (large and small), non-profits, educational institutions, and government agencies.
- M&A Trends: Projected XX M&A deals in 2025, driven by expansion into new markets and technological capabilities.
Team Building Planning Service Growth Trends & Insights
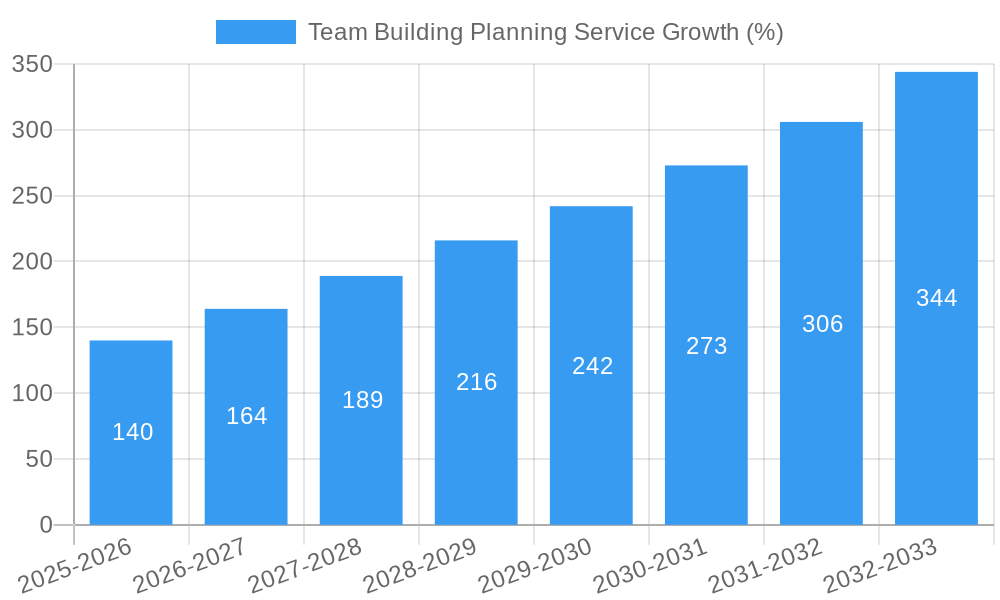
The Team Building Planning Service market is projected to experience robust growth throughout the forecast period (2025-2033), driven by increasing corporate emphasis on employee engagement and well-being, and the adoption of innovative technologies. The market size is estimated at $XX million in 2025, expected to reach $XX million by 2033, exhibiting a CAGR of XX%. Adoption rates are particularly high in sectors such as technology, finance, and consulting, where employee retention and collaboration are critical. Technological disruptions are fostering the growth of virtual and hybrid team-building solutions, catering to remote work trends. Consumer behavior shifts towards more personalized and experiential offerings further fuel market expansion.
Dominant Regions, Countries, or Segments in Team Building Planning Service
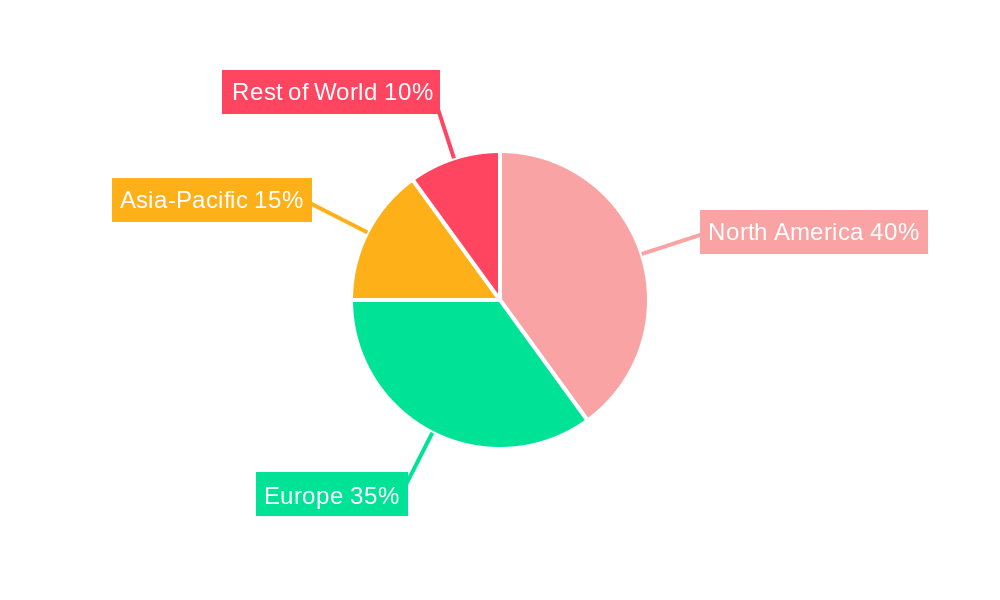
North America currently dominates the Team Building Planning Service market, with strong growth also seen in Europe and Asia-Pacific. The dominance of North America stems from a mature corporate landscape, high spending on employee development, and robust adoption of innovative technologies. Favorable economic policies, well-developed infrastructure, and a high concentration of corporate headquarters contribute significantly to market leadership. Asia-Pacific is expected to show the fastest growth rate during the forecast period, fueled by increasing disposable income, rapid economic development, and a rising middle class.
- North America: High spending on employee development, mature corporate sector, technology adoption.
- Europe: Strong focus on employee well-being, expanding remote work sector.
- Asia-Pacific: Rapid economic growth, rising disposable income, increasing adoption of team-building activities.
- Market Share: North America holds approximately XX% of the global market in 2025.
Team Building Planning Service Product Landscape
The Team Building Planning Service market offers a diverse range of products, from traditional offsite retreats and workshops to virtual team-building activities facilitated through online platforms. Innovations include the integration of gamification elements, virtual reality (VR) and augmented reality (AR) experiences, and personalized activity design based on individual team dynamics and preferences. Performance metrics commonly include employee engagement scores, team cohesion improvements, and overall satisfaction levels.
Key Drivers, Barriers & Challenges in Team Building Planning Service
Key Drivers:
- Growing focus on employee engagement and well-being.
- Rise of remote work and need for virtual team-building solutions.
- Increased corporate spending on employee development.
- Technological advancements enabling personalized and immersive experiences.
Key Challenges:
- Economic downturns can reduce corporate spending on non-essential services like team building.
- Intense competition among providers can compress margins.
- Maintaining data security and privacy in virtual team-building environments.
Emerging Opportunities in Team Building Planning Service
- Expansion into niche markets (e.g., healthcare, education).
- Development of sustainable and eco-friendly team-building experiences.
- Integration of AI and machine learning for personalized activity recommendations.
- Growth of hybrid team-building models combining in-person and virtual elements.
Growth Accelerators in the Team Building Planning Service Industry
Strategic partnerships between team-building providers and technology companies are driving innovation and expanding service offerings. The development of specialized team-building programs tailored to specific industry needs is also accelerating market growth. Expansion into underserved regions and markets presents significant opportunities for future growth.
Key Players Shaping the Team Building Planning Service Market
- Wendy Von Fries
- Event Planner Ltd
- JustSeventy
- Trifecta Event Management
- HOPP
- Azavista
- Event Solutions
- Wicked Event Management
- Planning Pod
- BI WORLDWIDE
- BEACH BUSH
- HigherEchelon
- ETC Travel
- Eventrous
- Elevent
Notable Milestones in Team Building Planning Service Sector
- 2020: Increased adoption of virtual team-building platforms due to COVID-19 pandemic.
- 2021: Launch of several new VR/AR-based team-building solutions.
- 2022: Several major M&A deals involving team-building companies.
- 2023: Growing focus on sustainable and environmentally conscious team-building practices.
In-Depth Team Building Planning Service Market Outlook
The Team Building Planning Service market is poised for continued expansion, driven by sustained demand for employee engagement solutions and the ongoing adoption of innovative technologies. Strategic partnerships, technological breakthroughs, and targeted market expansion strategies will be key to long-term success in this dynamic sector. The market’s potential for further growth is substantial, particularly in emerging markets and through the continued development of engaging and effective virtual and hybrid team-building experiences.
Team Building Planning Service Segmentation
-
1. Application
- 1.1. Large Enterprise
- 1.2. SMEs
-
2. Type
- 2.1. Indoor
- 2.2. Outdoor
Team Building Planning Service Segmentation By Geography
-
1. North America
- 1.1. United States
- 1.2. Canada
- 1.3. Mexico
-
2. South America
- 2.1. Brazil
- 2.2. Argentina
- 2.3. Rest of South America
-
3. Europe
- 3.1. United Kingdom
- 3.2. Germany
- 3.3. France
- 3.4. Italy
- 3.5. Spain
- 3.6. Russia
- 3.7. Benelux
- 3.8. Nordics
- 3.9. Rest of Europe
-
4. Middle East & Africa
- 4.1. Turkey
- 4.2. Israel
- 4.3. GCC
- 4.4. North Africa
- 4.5. South Africa
- 4.6. Rest of Middle East & Africa
-
5. Asia Pacific
- 5.1. China
- 5.2. India
- 5.3. Japan
- 5.4. South Korea
- 5.5. ASEAN
- 5.6. Oceania
- 5.7. Rest of Asia Pacific
Team Building Planning Service REPORT HIGHLIGHTS
| Aspects | Details |
|---|---|
| Study Period | 2019-2033 |
| Base Year | 2024 |
| Estimated Year | 2025 |
| Forecast Period | 2025-2033 |
| Historical Period | 2019-2024 |
| Growth Rate | CAGR of 12.3% from 2019-2033 |
| Segmentation |
|
Table of Contents
- 1. Introduction
- 1.1. Research Scope
- 1.2. Market Segmentation
- 1.3. Research Methodology
- 1.4. Definitions and Assumptions
- 2. Executive Summary
- 2.1. Introduction
- 3. Market Dynamics
- 3.1. Introduction
- 3.2. Market Drivers
- 3.3. Market Restrains
- 3.4. Market Trends
- 4. Market Factor Analysis
- 4.1. Porters Five Forces
- 4.2. Supply/Value Chain
- 4.3. PESTEL analysis
- 4.4. Market Entropy
- 4.5. Patent/Trademark Analysis
- 5. Global Team Building Planning Service Analysis, Insights and Forecast, 2019-2031
- 5.1. Market Analysis, Insights and Forecast - by Application
- 5.1.1. Large Enterprise
- 5.1.2. SMEs
- 5.2. Market Analysis, Insights and Forecast - by Type
- 5.2.1. Indoor
- 5.2.2. Outdoor
- 5.3. Market Analysis, Insights and Forecast - by Region
- 5.3.1. North America
- 5.3.2. South America
- 5.3.3. Europe
- 5.3.4. Middle East & Africa
- 5.3.5. Asia Pacific
- 5.1. Market Analysis, Insights and Forecast - by Application
- 6. North America Team Building Planning Service Analysis, Insights and Forecast, 2019-2031
- 6.1. Market Analysis, Insights and Forecast - by Application
- 6.1.1. Large Enterprise
- 6.1.2. SMEs
- 6.2. Market Analysis, Insights and Forecast - by Type
- 6.2.1. Indoor
- 6.2.2. Outdoor
- 6.1. Market Analysis, Insights and Forecast - by Application
- 7. South America Team Building Planning Service Analysis, Insights and Forecast, 2019-2031
- 7.1. Market Analysis, Insights and Forecast - by Application
- 7.1.1. Large Enterprise
- 7.1.2. SMEs
- 7.2. Market Analysis, Insights and Forecast - by Type
- 7.2.1. Indoor
- 7.2.2. Outdoor
- 7.1. Market Analysis, Insights and Forecast - by Application
- 8. Europe Team Building Planning Service Analysis, Insights and Forecast, 2019-2031
- 8.1. Market Analysis, Insights and Forecast - by Application
- 8.1.1. Large Enterprise
- 8.1.2. SMEs
- 8.2. Market Analysis, Insights and Forecast - by Type
- 8.2.1. Indoor
- 8.2.2. Outdoor
- 8.1. Market Analysis, Insights and Forecast - by Application
- 9. Middle East & Africa Team Building Planning Service Analysis, Insights and Forecast, 2019-2031
- 9.1. Market Analysis, Insights and Forecast - by Application
- 9.1.1. Large Enterprise
- 9.1.2. SMEs
- 9.2. Market Analysis, Insights and Forecast - by Type
- 9.2.1. Indoor
- 9.2.2. Outdoor
- 9.1. Market Analysis, Insights and Forecast - by Application
- 10. Asia Pacific Team Building Planning Service Analysis, Insights and Forecast, 2019-2031
- 10.1. Market Analysis, Insights and Forecast - by Application
- 10.1.1. Large Enterprise
- 10.1.2. SMEs
- 10.2. Market Analysis, Insights and Forecast - by Type
- 10.2.1. Indoor
- 10.2.2. Outdoor
- 10.1. Market Analysis, Insights and Forecast - by Application
- 11. Competitive Analysis
- 11.1. Global Market Share Analysis 2024
- 11.2. Company Profiles
- 11.2.1 Wendy Von Fries
- 11.2.1.1. Overview
- 11.2.1.2. Products
- 11.2.1.3. SWOT Analysis
- 11.2.1.4. Recent Developments
- 11.2.1.5. Financials (Based on Availability)
- 11.2.2 Event Planner Ltd
- 11.2.2.1. Overview
- 11.2.2.2. Products
- 11.2.2.3. SWOT Analysis
- 11.2.2.4. Recent Developments
- 11.2.2.5. Financials (Based on Availability)
- 11.2.3 JustSeventy
- 11.2.3.1. Overview
- 11.2.3.2. Products
- 11.2.3.3. SWOT Analysis
- 11.2.3.4. Recent Developments
- 11.2.3.5. Financials (Based on Availability)
- 11.2.4 Trifecta Event Management
- 11.2.4.1. Overview
- 11.2.4.2. Products
- 11.2.4.3. SWOT Analysis
- 11.2.4.4. Recent Developments
- 11.2.4.5. Financials (Based on Availability)
- 11.2.5 HOPP
- 11.2.5.1. Overview
- 11.2.5.2. Products
- 11.2.5.3. SWOT Analysis
- 11.2.5.4. Recent Developments
- 11.2.5.5. Financials (Based on Availability)
- 11.2.6 Azavista
- 11.2.6.1. Overview
- 11.2.6.2. Products
- 11.2.6.3. SWOT Analysis
- 11.2.6.4. Recent Developments
- 11.2.6.5. Financials (Based on Availability)
- 11.2.7 Event Solutions
- 11.2.7.1. Overview
- 11.2.7.2. Products
- 11.2.7.3. SWOT Analysis
- 11.2.7.4. Recent Developments
- 11.2.7.5. Financials (Based on Availability)
- 11.2.8 Wicked Event Management
- 11.2.8.1. Overview
- 11.2.8.2. Products
- 11.2.8.3. SWOT Analysis
- 11.2.8.4. Recent Developments
- 11.2.8.5. Financials (Based on Availability)
- 11.2.9 Planning Pod
- 11.2.9.1. Overview
- 11.2.9.2. Products
- 11.2.9.3. SWOT Analysis
- 11.2.9.4. Recent Developments
- 11.2.9.5. Financials (Based on Availability)
- 11.2.10 BI WORLDWIDE
- 11.2.10.1. Overview
- 11.2.10.2. Products
- 11.2.10.3. SWOT Analysis
- 11.2.10.4. Recent Developments
- 11.2.10.5. Financials (Based on Availability)
- 11.2.11 BEACH BUSH
- 11.2.11.1. Overview
- 11.2.11.2. Products
- 11.2.11.3. SWOT Analysis
- 11.2.11.4. Recent Developments
- 11.2.11.5. Financials (Based on Availability)
- 11.2.12 HigherEchelon
- 11.2.12.1. Overview
- 11.2.12.2. Products
- 11.2.12.3. SWOT Analysis
- 11.2.12.4. Recent Developments
- 11.2.12.5. Financials (Based on Availability)
- 11.2.13 ETC Travel
- 11.2.13.1. Overview
- 11.2.13.2. Products
- 11.2.13.3. SWOT Analysis
- 11.2.13.4. Recent Developments
- 11.2.13.5. Financials (Based on Availability)
- 11.2.14 Eventrous
- 11.2.14.1. Overview
- 11.2.14.2. Products
- 11.2.14.3. SWOT Analysis
- 11.2.14.4. Recent Developments
- 11.2.14.5. Financials (Based on Availability)
- 11.2.15 Elevent
- 11.2.15.1. Overview
- 11.2.15.2. Products
- 11.2.15.3. SWOT Analysis
- 11.2.15.4. Recent Developments
- 11.2.15.5. Financials (Based on Availability)
- 11.2.1 Wendy Von Fries
List of Figures
- Figure 1: Global Team Building Planning Service Revenue Breakdown (million, %) by Region 2024 & 2032
- Figure 2: North America Team Building Planning Service Revenue (million), by Application 2024 & 2032
- Figure 3: North America Team Building Planning Service Revenue Share (%), by Application 2024 & 2032
- Figure 4: North America Team Building Planning Service Revenue (million), by Type 2024 & 2032
- Figure 5: North America Team Building Planning Service Revenue Share (%), by Type 2024 & 2032
- Figure 6: North America Team Building Planning Service Revenue (million), by Country 2024 & 2032
- Figure 7: North America Team Building Planning Service Revenue Share (%), by Country 2024 & 2032
- Figure 8: South America Team Building Planning Service Revenue (million), by Application 2024 & 2032
- Figure 9: South America Team Building Planning Service Revenue Share (%), by Application 2024 & 2032
- Figure 10: South America Team Building Planning Service Revenue (million), by Type 2024 & 2032
- Figure 11: South America Team Building Planning Service Revenue Share (%), by Type 2024 & 2032
- Figure 12: South America Team Building Planning Service Revenue (million), by Country 2024 & 2032
- Figure 13: South America Team Building Planning Service Revenue Share (%), by Country 2024 & 2032
- Figure 14: Europe Team Building Planning Service Revenue (million), by Application 2024 & 2032
- Figure 15: Europe Team Building Planning Service Revenue Share (%), by Application 2024 & 2032
- Figure 16: Europe Team Building Planning Service Revenue (million), by Type 2024 & 2032
- Figure 17: Europe Team Building Planning Service Revenue Share (%), by Type 2024 & 2032
- Figure 18: Europe Team Building Planning Service Revenue (million), by Country 2024 & 2032
- Figure 19: Europe Team Building Planning Service Revenue Share (%), by Country 2024 & 2032
- Figure 20: Middle East & Africa Team Building Planning Service Revenue (million), by Application 2024 & 2032
- Figure 21: Middle East & Africa Team Building Planning Service Revenue Share (%), by Application 2024 & 2032
- Figure 22: Middle East & Africa Team Building Planning Service Revenue (million), by Type 2024 & 2032
- Figure 23: Middle East & Africa Team Building Planning Service Revenue Share (%), by Type 2024 & 2032
- Figure 24: Middle East & Africa Team Building Planning Service Revenue (million), by Country 2024 & 2032
- Figure 25: Middle East & Africa Team Building Planning Service Revenue Share (%), by Country 2024 & 2032
- Figure 26: Asia Pacific Team Building Planning Service Revenue (million), by Application 2024 & 2032
- Figure 27: Asia Pacific Team Building Planning Service Revenue Share (%), by Application 2024 & 2032
- Figure 28: Asia Pacific Team Building Planning Service Revenue (million), by Type 2024 & 2032
- Figure 29: Asia Pacific Team Building Planning Service Revenue Share (%), by Type 2024 & 2032
- Figure 30: Asia Pacific Team Building Planning Service Revenue (million), by Country 2024 & 2032
- Figure 31: Asia Pacific Team Building Planning Service Revenue Share (%), by Country 2024 & 2032
List of Tables
- Table 1: Global Team Building Planning Service Revenue million Forecast, by Region 2019 & 2032
- Table 2: Global Team Building Planning Service Revenue million Forecast, by Application 2019 & 2032
- Table 3: Global Team Building Planning Service Revenue million Forecast, by Type 2019 & 2032
- Table 4: Global Team Building Planning Service Revenue million Forecast, by Region 2019 & 2032
- Table 5: Global Team Building Planning Service Revenue million Forecast, by Application 2019 & 2032
- Table 6: Global Team Building Planning Service Revenue million Forecast, by Type 2019 & 2032
- Table 7: Global Team Building Planning Service Revenue million Forecast, by Country 2019 & 2032
- Table 8: United States Team Building Planning Service Revenue (million) Forecast, by Application 2019 & 2032
- Table 9: Canada Team Building Planning Service Revenue (million) Forecast, by Application 2019 & 2032
- Table 10: Mexico Team Building Planning Service Revenue (million) Forecast, by Application 2019 & 2032
- Table 11: Global Team Building Planning Service Revenue million Forecast, by Application 2019 & 2032
- Table 12: Global Team Building Planning Service Revenue million Forecast, by Type 2019 & 2032
- Table 13: Global Team Building Planning Service Revenue million Forecast, by Country 2019 & 2032
- Table 14: Brazil Team Building Planning Service Revenue (million) Forecast, by Application 2019 & 2032
- Table 15: Argentina Team Building Planning Service Revenue (million) Forecast, by Application 2019 & 2032
- Table 16: Rest of South America Team Building Planning Service Revenue (million) Forecast, by Application 2019 & 2032
- Table 17: Global Team Building Planning Service Revenue million Forecast, by Application 2019 & 2032
- Table 18: Global Team Building Planning Service Revenue million Forecast, by Type 2019 & 2032
- Table 19: Global Team Building Planning Service Revenue million Forecast, by Country 2019 & 2032
- Table 20: United Kingdom Team Building Planning Service Revenue (million) Forecast, by Application 2019 & 2032
- Table 21: Germany Team Building Planning Service Revenue (million) Forecast, by Application 2019 & 2032
- Table 22: France Team Building Planning Service Revenue (million) Forecast, by Application 2019 & 2032
- Table 23: Italy Team Building Planning Service Revenue (million) Forecast, by Application 2019 & 2032
- Table 24: Spain Team Building Planning Service Revenue (million) Forecast, by Application 2019 & 2032
- Table 25: Russia Team Building Planning Service Revenue (million) Forecast, by Application 2019 & 2032
- Table 26: Benelux Team Building Planning Service Revenue (million) Forecast, by Application 2019 & 2032
- Table 27: Nordics Team Building Planning Service Revenue (million) Forecast, by Application 2019 & 2032
- Table 28: Rest of Europe Team Building Planning Service Revenue (million) Forecast, by Application 2019 & 2032
- Table 29: Global Team Building Planning Service Revenue million Forecast, by Application 2019 & 2032
- Table 30: Global Team Building Planning Service Revenue million Forecast, by Type 2019 & 2032
- Table 31: Global Team Building Planning Service Revenue million Forecast, by Country 2019 & 2032
- Table 32: Turkey Team Building Planning Service Revenue (million) Forecast, by Application 2019 & 2032
- Table 33: Israel Team Building Planning Service Revenue (million) Forecast, by Application 2019 & 2032
- Table 34: GCC Team Building Planning Service Revenue (million) Forecast, by Application 2019 & 2032
- Table 35: North Africa Team Building Planning Service Revenue (million) Forecast, by Application 2019 & 2032
- Table 36: South Africa Team Building Planning Service Revenue (million) Forecast, by Application 2019 & 2032
- Table 37: Rest of Middle East & Africa Team Building Planning Service Revenue (million) Forecast, by Application 2019 & 2032
- Table 38: Global Team Building Planning Service Revenue million Forecast, by Application 2019 & 2032
- Table 39: Global Team Building Planning Service Revenue million Forecast, by Type 2019 & 2032
- Table 40: Global Team Building Planning Service Revenue million Forecast, by Country 2019 & 2032
- Table 41: China Team Building Planning Service Revenue (million) Forecast, by Application 2019 & 2032
- Table 42: India Team Building Planning Service Revenue (million) Forecast, by Application 2019 & 2032
- Table 43: Japan Team Building Planning Service Revenue (million) Forecast, by Application 2019 & 2032
- Table 44: South Korea Team Building Planning Service Revenue (million) Forecast, by Application 2019 & 2032
- Table 45: ASEAN Team Building Planning Service Revenue (million) Forecast, by Application 2019 & 2032
- Table 46: Oceania Team Building Planning Service Revenue (million) Forecast, by Application 2019 & 2032
- Table 47: Rest of Asia Pacific Team Building Planning Service Revenue (million) Forecast, by Application 2019 & 2032
Frequently Asked Questions
1. What is the projected Compound Annual Growth Rate (CAGR) of the Team Building Planning Service?
The projected CAGR is approximately 12.3%.
2. Which companies are prominent players in the Team Building Planning Service?
Key companies in the market include Wendy Von Fries, Event Planner Ltd, JustSeventy, Trifecta Event Management, HOPP, Azavista, Event Solutions, Wicked Event Management, Planning Pod, BI WORLDWIDE, BEACH BUSH, HigherEchelon, ETC Travel, Eventrous, Elevent.
3. What are the main segments of the Team Building Planning Service?
The market segments include Application, Type.
4. Can you provide details about the market size?
The market size is estimated to be USD 1148 million as of 2022.
5. What are some drivers contributing to market growth?
N/A
6. What are the notable trends driving market growth?
N/A
7. Are there any restraints impacting market growth?
N/A
8. Can you provide examples of recent developments in the market?
N/A
9. What pricing options are available for accessing the report?
Pricing options include single-user, multi-user, and enterprise licenses priced at USD 2900.00, USD 4350.00, and USD 5800.00 respectively.
10. Is the market size provided in terms of value or volume?
The market size is provided in terms of value, measured in million.
11. Are there any specific market keywords associated with the report?
Yes, the market keyword associated with the report is "Team Building Planning Service," which aids in identifying and referencing the specific market segment covered.
12. How do I determine which pricing option suits my needs best?
The pricing options vary based on user requirements and access needs. Individual users may opt for single-user licenses, while businesses requiring broader access may choose multi-user or enterprise licenses for cost-effective access to the report.
13. Are there any additional resources or data provided in the Team Building Planning Service report?
While the report offers comprehensive insights, it's advisable to review the specific contents or supplementary materials provided to ascertain if additional resources or data are available.
14. How can I stay updated on further developments or reports in the Team Building Planning Service?
To stay informed about further developments, trends, and reports in the Team Building Planning Service, consider subscribing to industry newsletters, following relevant companies and organizations, or regularly checking reputable industry news sources and publications.
Methodology
Step 1 - Identification of Relevant Samples Size from Population Database


Step 2 - Approaches for Defining Global Market Size (Value, Volume* & Price*)

Note*: In applicable scenarios
Step 3 - Data Sources
Primary Research
- Web Analytics
- Survey Reports
- Research Institute
- Latest Research Reports
- Opinion Leaders
Secondary Research
- Annual Reports
- White Paper
- Latest Press Release
- Industry Association
- Paid Database
- Investor Presentations

Step 4 - Data Triangulation
Involves using different sources of information in order to increase the validity of a study
These sources are likely to be stakeholders in a program - participants, other researchers, program staff, other community members, and so on.
Then we put all data in single framework & apply various statistical tools to find out the dynamic on the market.
During the analysis stage, feedback from the stakeholder groups would be compared to determine areas of agreement as well as areas of divergence
