

Key Insights
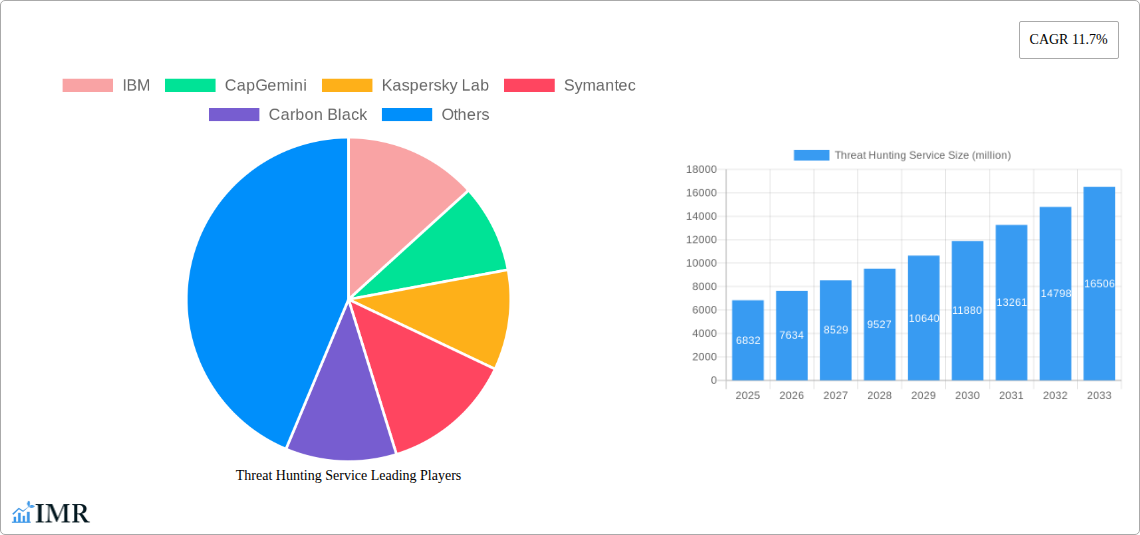
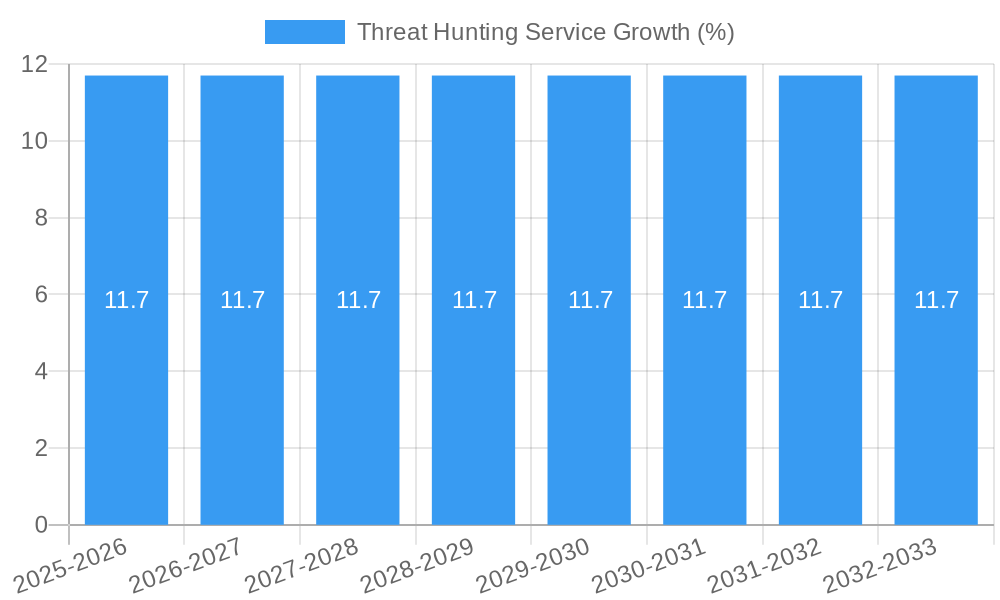
The global Threat Hunting Service market is poised for significant expansion, projected to reach a substantial USD 6,832 million by 2025. This robust growth is fueled by a compelling Compound Annual Growth Rate (CAGR) of 11.7% anticipated between 2025 and 2033. The escalating sophistication and frequency of cyberattacks across all business sectors are the primary catalysts driving this upward trajectory. Organizations are increasingly recognizing that traditional security measures are no longer sufficient to detect and neutralize advanced persistent threats (APTs) and novel attack vectors. Proactive threat hunting, which involves actively searching for undetected malicious activity within an organization's network, is becoming an indispensable component of a comprehensive cybersecurity strategy. This shift in defense paradigm is particularly pronounced among large enterprises and small to medium-sized enterprises (SMEs) alike, as the potential financial and reputational damage from a breach necessitates advanced protective measures. The adoption of cloud-based and web-based solutions further facilitates the scalability and accessibility of these services, making them more viable for a broader range of businesses.
The market is characterized by a dynamic landscape of established cybersecurity giants and emerging specialized providers. Key players such as IBM, Symantec, and Sophos are leveraging their extensive expertise and global reach, while niche players like Carbon Black, Cybereason, and IronNet Cybersecurity are innovating with advanced analytics and AI-driven approaches. The increasing demand for managed threat hunting services, often delivered through cloud platforms, underscores a trend towards outsourcing specialized security functions to reduce internal resource strain and enhance response capabilities. However, the market faces challenges such as the scarcity of skilled threat hunting professionals and the high cost of advanced tools and technologies. Despite these hurdles, the continuous evolution of cyber threats, coupled with a growing awareness of proactive security needs, ensures a sustained and significant market expansion for threat hunting services in the coming years, especially within regions like North America and Europe which are at the forefront of cybersecurity investment and adoption.
This in-depth report provides a definitive analysis of the global Threat Hunting Service market, forecasting significant growth driven by escalating cyber threats and the increasing sophistication of attacker methodologies. Spanning from 2019 to 2033, with a base year of 2025, this report offers critical insights into market dynamics, growth trends, regional dominance, product landscape, key drivers, barriers, and emerging opportunities. It caters to cybersecurity professionals, IT decision-makers, investors, and stakeholders seeking a comprehensive understanding of this vital market segment.
Threat Hunting Service Market Dynamics & Structure
The threat hunting service market is characterized by a moderately concentrated landscape, with a few key players like IBM, SecureWorks, and Verizon Enterprise holding significant market share. Technological innovation is a paramount driver, with advancements in AI, machine learning, and behavioral analytics enabling more proactive and effective threat detection. Regulatory frameworks, such as GDPR and CCPA, are increasingly mandating robust cybersecurity measures, indirectly fueling demand for threat hunting services. Competitive product substitutes include internal security teams with advanced tooling and managed detection and response (MDR) services that incorporate threat hunting capabilities. End-user demographics are evolving, with both Large Enterprises and SMEs recognizing the critical need for advanced threat intelligence and response. Mergers and acquisitions (M&A) are a notable trend, with companies like Capgemini and Singtel strategically acquiring or partnering with specialized threat hunting firms to enhance their service portfolios.
- Market Concentration: Moderately concentrated, with a growing number of specialized providers.
- Technological Innovation Drivers: AI, ML, behavioral analytics, threat intelligence platforms, SOAR solutions.
- Regulatory Frameworks: GDPR, CCPA, NIS2 Directive, driving compliance-driven adoption.
- Competitive Product Substitutes: In-house SOCs, traditional antivirus, endpoint detection and response (EDR) without proactive hunting.
- End-User Demographics: Dominance of Large Enterprises due to complex threat landscapes, but growing adoption among SMEs.
- M&A Trends: Strategic acquisitions and partnerships to expand service offerings and market reach. For instance, Capgemini's acquisition of specialized cybersecurity firms to bolster its threat hunting capabilities.
Threat Hunting Service Growth Trends & Insights
The global threat hunting service market is poised for substantial expansion, projected to reach an estimated $25,500 million by 2025 and further grow to approximately $48,900 million by 2033, exhibiting a robust Compound Annual Growth Rate (CAGR) of 8.5% during the forecast period of 2025-2033. This growth is underpinned by a confluence of factors, including the escalating volume and sophistication of cyberattacks, the growing shortage of skilled cybersecurity professionals, and the increasing adoption of cloud-based infrastructure, which presents new attack vectors. The historical period (2019-2024) saw steady growth as organizations began to understand the limitations of reactive security measures and embraced proactive threat hunting. Adoption rates are accelerating, particularly among financial services, healthcare, and government sectors, where data breaches can have catastrophic consequences. Technological disruptions, such as the integration of Extended Detection and Response (XDR) platforms and the increasing reliance on threat intelligence feeds, are enhancing the efficacy and scalability of threat hunting services. Consumer behavior shifts are evident, with organizations moving from a purely defensive stance to a more offensive and intelligence-driven approach to cybersecurity. The market penetration is increasing, with a growing percentage of IT budgets allocated to advanced threat detection and hunting capabilities. The continuous evolution of attack techniques necessitates a parallel evolution in defensive strategies, making threat hunting an indispensable component of modern cybersecurity.
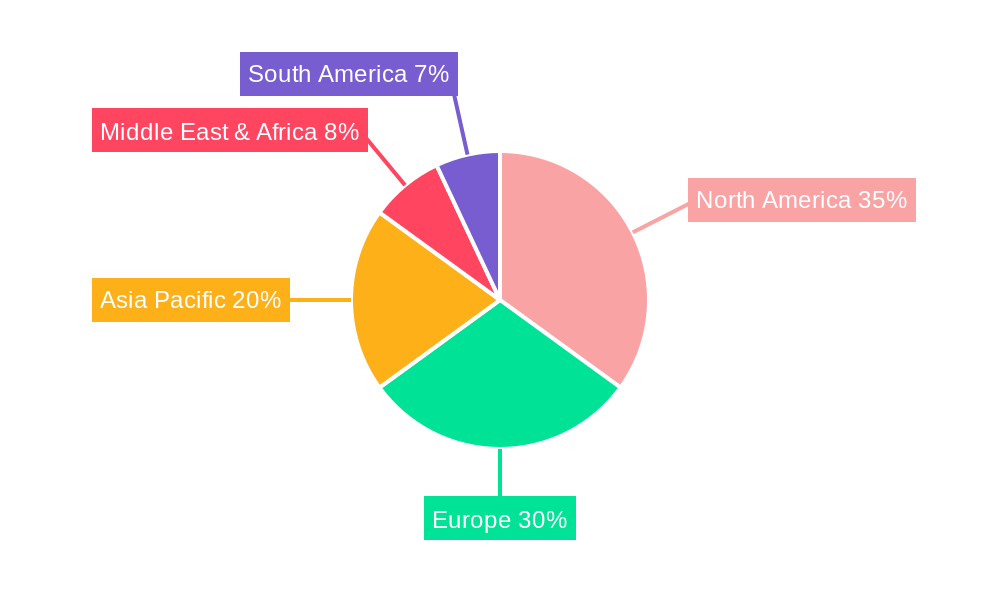
Dominant Regions, Countries, or Segments in Threat Hunting Service
North America currently stands as the dominant region in the global Threat Hunting Service market, projected to account for approximately 35% of the total market value in 2025, estimated at $8,925 million. This dominance is driven by a mature cybersecurity ecosystem, a high concentration of large enterprises with sophisticated IT infrastructures, and stringent regulatory requirements. The United States, in particular, leads this regional growth due to significant investments in advanced cybersecurity technologies and a proactive approach to threat mitigation.
Among the segments, Large Enterprises represent the primary market for threat hunting services, expected to capture around 60% of the market share in 2025, valued at $15,300 million. Their complex IT environments, vast amounts of sensitive data, and higher susceptibility to high-impact attacks necessitate advanced threat hunting capabilities.
In terms of Type, Cloud-Based threat hunting services are experiencing rapid adoption, anticipated to command approximately 55% of the market by 2025, reaching $14,025 million. The inherent scalability, flexibility, and cost-effectiveness of cloud solutions align well with the dynamic needs of modern enterprises.
Dominant Region: North America
- Key Drivers: High cybersecurity spending, presence of global tech hubs, robust regulatory landscape (e.g., CMMC for defense contractors), high incidence of sophisticated cyberattacks.
- Market Share (2025): ~35% ($8,925 million)
- Growth Potential: Continued innovation and adoption by both enterprise and government sectors.
Dominant Application Segment: Large Enterprises
- Key Drivers: Complex threat surfaces, large volumes of critical data, compliance mandates, higher financial impact of breaches.
- Market Share (2025): ~60% ($15,300 million)
- Growth Potential: Ongoing need for advanced threat detection and rapid response to sophisticated attacks.
Dominant Service Type: Cloud-Based
- Key Drivers: Scalability, agility, cost-efficiency, ease of deployment, remote accessibility.
- Market Share (2025): ~55% ($14,025 million)
- Growth Potential: Accelerated digital transformation and hybrid cloud adoption.
Threat Hunting Service Product Landscape
The threat hunting service product landscape is rapidly evolving, with providers focusing on delivering integrated solutions that combine advanced analytics, machine learning, and threat intelligence. Innovations include AI-powered anomaly detection, behavioral analytics engines capable of identifying novel threats, and security orchestration, automation, and response (SOAR) platforms that streamline incident response workflows. Unique selling propositions often lie in the depth of visibility provided across an organization's entire IT infrastructure, from endpoints to cloud environments. Performance metrics are increasingly judged by mean time to detect (MTTD) and mean time to respond (MTTR) to advanced persistent threats (APTs).
Key Drivers, Barriers & Challenges in Threat Hunting Service
Key Drivers: The threat hunting service market is propelled by several key factors. The escalating volume and sophistication of cyberattacks, including ransomware and nation-state-sponsored threats, necessitate proactive identification of threats before they cause damage. The persistent shortage of skilled cybersecurity professionals also drives demand for specialized threat hunting services. Furthermore, evolving regulatory landscapes and compliance mandates are compelling organizations to invest in advanced security solutions, including threat hunting. The increasing adoption of cloud services and the expansion of attack surfaces create new opportunities for threat actors, thus increasing the need for continuous monitoring and threat hunting.
Barriers & Challenges: Despite its growth, the market faces several challenges. The high cost of advanced threat hunting solutions and the associated expertise can be a barrier for Small and Medium-sized Enterprises (SMEs). Integration complexities with existing security infrastructure can also pose challenges. Moreover, the constant evolution of threat actor tactics requires continuous updates and adaptation of hunting methodologies, demanding significant investment in research and development. The scarcity of highly skilled threat hunters, coupled with a competitive talent market, can also limit service provider capacity. Supply chain vulnerabilities, though less direct, can indirectly impact the deployment of hardware or software components vital for some threat hunting platforms.
Emerging Opportunities in Threat Hunting Service
Emerging opportunities in the threat hunting service market are abundant. The expansion of threat hunting services into operational technology (OT) and industrial control systems (ICS) environments presents a significant untapped market, particularly in critical infrastructure sectors. The development of more sophisticated AI and ML models for predictive threat detection and automated response offers a path to enhance service efficacy and efficiency. Furthermore, specialized threat hunting services tailored for niche industries with unique regulatory and threat landscapes are gaining traction. The growing demand for integrated threat intelligence platforms that seamlessly feed into hunting operations also creates opportunities for partnerships and enhanced service delivery.
Growth Accelerators in the Threat Hunting Service Industry
Several catalysts are accelerating growth within the threat hunting service industry. Technological breakthroughs, particularly in areas like behavioral analytics and advanced endpoint detection and response (EDR) that seamlessly integrate hunting capabilities, are enhancing the effectiveness and adoption of these services. Strategic partnerships between threat intelligence providers, cloud security vendors, and threat hunting firms are creating more comprehensive and compelling offerings. Market expansion strategies, including the development of tiered service models to cater to a wider range of SMEs and the increasing global reach of service providers, are also contributing to sustained growth. The rising awareness among boards of directors about cyber risk is translating into increased budget allocation for proactive security measures.
Key Players Shaping the Threat Hunting Service Market
- IBM
- Capgemini
- Kaspersky Lab
- Symantec (Enterprise business now part of Broadcom)
- Carbon Black (Acquired by VMware)
- Clearnetwork
- CyberDefenses
- Cybereason
- Delta Risk
- Ingalls Information Security
- IronNet Cybersecurity
- Paladion (Now part of Cyble)
- Redscan
- SecureWorks
- Sophos
- TalaTek
- Singtel
- Verizon Enterprise
Notable Milestones in Threat Hunting Service Sector
- 2019: Increased adoption of AI and machine learning in threat detection platforms, enhancing proactive hunting capabilities.
- 2020: Surge in ransomware attacks highlighted the critical need for advanced threat hunting beyond traditional signature-based detection.
- 2021: Growth in cloud-native security solutions and the integration of threat hunting into Managed Detection and Response (MDR) services.
- 2022: Escalation of supply chain attacks emphasized the importance of threat hunting across the entire digital ecosystem.
- 2023: Increased regulatory scrutiny and data privacy laws (e.g., GDPR, CCPA) driving demand for robust threat hunting to ensure compliance.
- 2024: Further advancements in Extended Detection and Response (XDR) platforms, consolidating data sources and improving threat hunting efficiency.
- 2025 (Estimated): Increased focus on proactive threat hunting for OT/ICS environments due to growing digitalization of industrial sectors.
In-Depth Threat Hunting Service Market Outlook
The threat hunting service market is set for sustained and robust growth, driven by the relentless evolution of cyber threats and the imperative for organizations to move beyond reactive security postures. Growth accelerators such as AI-driven analytics, strategic partnerships, and the expansion into emerging markets like OT/ICS security will continue to fuel this expansion. Future market potential lies in the development of highly automated and predictive threat hunting solutions, coupled with specialized services tailored to specific industry verticals. Stakeholders can anticipate a dynamic landscape with continuous innovation and increasing demand for sophisticated threat hunting expertise to safeguard critical digital assets in an increasingly complex threat environment.
Threat Hunting Service Segmentation
-
1. Application
- 1.1. Large Enterprises
- 1.2. SMEs
-
2. Type
- 2.1. Cloud-Based
- 2.2. Web-Based
Threat Hunting Service Segmentation By Geography
-
1. North America
- 1.1. United States
- 1.2. Canada
- 1.3. Mexico
-
2. South America
- 2.1. Brazil
- 2.2. Argentina
- 2.3. Rest of South America
-
3. Europe
- 3.1. United Kingdom
- 3.2. Germany
- 3.3. France
- 3.4. Italy
- 3.5. Spain
- 3.6. Russia
- 3.7. Benelux
- 3.8. Nordics
- 3.9. Rest of Europe
-
4. Middle East & Africa
- 4.1. Turkey
- 4.2. Israel
- 4.3. GCC
- 4.4. North Africa
- 4.5. South Africa
- 4.6. Rest of Middle East & Africa
-
5. Asia Pacific
- 5.1. China
- 5.2. India
- 5.3. Japan
- 5.4. South Korea
- 5.5. ASEAN
- 5.6. Oceania
- 5.7. Rest of Asia Pacific
Threat Hunting Service REPORT HIGHLIGHTS
| Aspects | Details |
|---|---|
| Study Period | 2019-2033 |
| Base Year | 2024 |
| Estimated Year | 2025 |
| Forecast Period | 2025-2033 |
| Historical Period | 2019-2024 |
| Growth Rate | CAGR of 11.7% from 2019-2033 |
| Segmentation |
|
Table of Contents
- 1. Introduction
- 1.1. Research Scope
- 1.2. Market Segmentation
- 1.3. Research Methodology
- 1.4. Definitions and Assumptions
- 2. Executive Summary
- 2.1. Introduction
- 3. Market Dynamics
- 3.1. Introduction
- 3.2. Market Drivers
- 3.3. Market Restrains
- 3.4. Market Trends
- 4. Market Factor Analysis
- 4.1. Porters Five Forces
- 4.2. Supply/Value Chain
- 4.3. PESTEL analysis
- 4.4. Market Entropy
- 4.5. Patent/Trademark Analysis
- 5. Global Threat Hunting Service Analysis, Insights and Forecast, 2019-2031
- 5.1. Market Analysis, Insights and Forecast - by Application
- 5.1.1. Large Enterprises
- 5.1.2. SMEs
- 5.2. Market Analysis, Insights and Forecast - by Type
- 5.2.1. Cloud-Based
- 5.2.2. Web-Based
- 5.3. Market Analysis, Insights and Forecast - by Region
- 5.3.1. North America
- 5.3.2. South America
- 5.3.3. Europe
- 5.3.4. Middle East & Africa
- 5.3.5. Asia Pacific
- 5.1. Market Analysis, Insights and Forecast - by Application
- 6. North America Threat Hunting Service Analysis, Insights and Forecast, 2019-2031
- 6.1. Market Analysis, Insights and Forecast - by Application
- 6.1.1. Large Enterprises
- 6.1.2. SMEs
- 6.2. Market Analysis, Insights and Forecast - by Type
- 6.2.1. Cloud-Based
- 6.2.2. Web-Based
- 6.1. Market Analysis, Insights and Forecast - by Application
- 7. South America Threat Hunting Service Analysis, Insights and Forecast, 2019-2031
- 7.1. Market Analysis, Insights and Forecast - by Application
- 7.1.1. Large Enterprises
- 7.1.2. SMEs
- 7.2. Market Analysis, Insights and Forecast - by Type
- 7.2.1. Cloud-Based
- 7.2.2. Web-Based
- 7.1. Market Analysis, Insights and Forecast - by Application
- 8. Europe Threat Hunting Service Analysis, Insights and Forecast, 2019-2031
- 8.1. Market Analysis, Insights and Forecast - by Application
- 8.1.1. Large Enterprises
- 8.1.2. SMEs
- 8.2. Market Analysis, Insights and Forecast - by Type
- 8.2.1. Cloud-Based
- 8.2.2. Web-Based
- 8.1. Market Analysis, Insights and Forecast - by Application
- 9. Middle East & Africa Threat Hunting Service Analysis, Insights and Forecast, 2019-2031
- 9.1. Market Analysis, Insights and Forecast - by Application
- 9.1.1. Large Enterprises
- 9.1.2. SMEs
- 9.2. Market Analysis, Insights and Forecast - by Type
- 9.2.1. Cloud-Based
- 9.2.2. Web-Based
- 9.1. Market Analysis, Insights and Forecast - by Application
- 10. Asia Pacific Threat Hunting Service Analysis, Insights and Forecast, 2019-2031
- 10.1. Market Analysis, Insights and Forecast - by Application
- 10.1.1. Large Enterprises
- 10.1.2. SMEs
- 10.2. Market Analysis, Insights and Forecast - by Type
- 10.2.1. Cloud-Based
- 10.2.2. Web-Based
- 10.1. Market Analysis, Insights and Forecast - by Application
- 11. Competitive Analysis
- 11.1. Global Market Share Analysis 2024
- 11.2. Company Profiles
- 11.2.1 IBM
- 11.2.1.1. Overview
- 11.2.1.2. Products
- 11.2.1.3. SWOT Analysis
- 11.2.1.4. Recent Developments
- 11.2.1.5. Financials (Based on Availability)
- 11.2.2 CapGemini
- 11.2.2.1. Overview
- 11.2.2.2. Products
- 11.2.2.3. SWOT Analysis
- 11.2.2.4. Recent Developments
- 11.2.2.5. Financials (Based on Availability)
- 11.2.3 Kaspersky Lab
- 11.2.3.1. Overview
- 11.2.3.2. Products
- 11.2.3.3. SWOT Analysis
- 11.2.3.4. Recent Developments
- 11.2.3.5. Financials (Based on Availability)
- 11.2.4 Symantec
- 11.2.4.1. Overview
- 11.2.4.2. Products
- 11.2.4.3. SWOT Analysis
- 11.2.4.4. Recent Developments
- 11.2.4.5. Financials (Based on Availability)
- 11.2.5 Carbon Black
- 11.2.5.1. Overview
- 11.2.5.2. Products
- 11.2.5.3. SWOT Analysis
- 11.2.5.4. Recent Developments
- 11.2.5.5. Financials (Based on Availability)
- 11.2.6 Clearnetwork
- 11.2.6.1. Overview
- 11.2.6.2. Products
- 11.2.6.3. SWOT Analysis
- 11.2.6.4. Recent Developments
- 11.2.6.5. Financials (Based on Availability)
- 11.2.7 CyberDefenses
- 11.2.7.1. Overview
- 11.2.7.2. Products
- 11.2.7.3. SWOT Analysis
- 11.2.7.4. Recent Developments
- 11.2.7.5. Financials (Based on Availability)
- 11.2.8 Cybereason
- 11.2.8.1. Overview
- 11.2.8.2. Products
- 11.2.8.3. SWOT Analysis
- 11.2.8.4. Recent Developments
- 11.2.8.5. Financials (Based on Availability)
- 11.2.9 Delta Risk
- 11.2.9.1. Overview
- 11.2.9.2. Products
- 11.2.9.3. SWOT Analysis
- 11.2.9.4. Recent Developments
- 11.2.9.5. Financials (Based on Availability)
- 11.2.10 Ingalls Information Security
- 11.2.10.1. Overview
- 11.2.10.2. Products
- 11.2.10.3. SWOT Analysis
- 11.2.10.4. Recent Developments
- 11.2.10.5. Financials (Based on Availability)
- 11.2.11 IronNet Cybersecurity
- 11.2.11.1. Overview
- 11.2.11.2. Products
- 11.2.11.3. SWOT Analysis
- 11.2.11.4. Recent Developments
- 11.2.11.5. Financials (Based on Availability)
- 11.2.12 Paladion
- 11.2.12.1. Overview
- 11.2.12.2. Products
- 11.2.12.3. SWOT Analysis
- 11.2.12.4. Recent Developments
- 11.2.12.5. Financials (Based on Availability)
- 11.2.13 Redscan
- 11.2.13.1. Overview
- 11.2.13.2. Products
- 11.2.13.3. SWOT Analysis
- 11.2.13.4. Recent Developments
- 11.2.13.5. Financials (Based on Availability)
- 11.2.14 SecureWorks
- 11.2.14.1. Overview
- 11.2.14.2. Products
- 11.2.14.3. SWOT Analysis
- 11.2.14.4. Recent Developments
- 11.2.14.5. Financials (Based on Availability)
- 11.2.15 Sophos
- 11.2.15.1. Overview
- 11.2.15.2. Products
- 11.2.15.3. SWOT Analysis
- 11.2.15.4. Recent Developments
- 11.2.15.5. Financials (Based on Availability)
- 11.2.16 TalaTek
- 11.2.16.1. Overview
- 11.2.16.2. Products
- 11.2.16.3. SWOT Analysis
- 11.2.16.4. Recent Developments
- 11.2.16.5. Financials (Based on Availability)
- 11.2.17 Singtel
- 11.2.17.1. Overview
- 11.2.17.2. Products
- 11.2.17.3. SWOT Analysis
- 11.2.17.4. Recent Developments
- 11.2.17.5. Financials (Based on Availability)
- 11.2.18 Verizon Enterprise
- 11.2.18.1. Overview
- 11.2.18.2. Products
- 11.2.18.3. SWOT Analysis
- 11.2.18.4. Recent Developments
- 11.2.18.5. Financials (Based on Availability)
- 11.2.1 IBM
List of Figures
- Figure 1: Global Threat Hunting Service Revenue Breakdown (million, %) by Region 2024 & 2032
- Figure 2: North America Threat Hunting Service Revenue (million), by Application 2024 & 2032
- Figure 3: North America Threat Hunting Service Revenue Share (%), by Application 2024 & 2032
- Figure 4: North America Threat Hunting Service Revenue (million), by Type 2024 & 2032
- Figure 5: North America Threat Hunting Service Revenue Share (%), by Type 2024 & 2032
- Figure 6: North America Threat Hunting Service Revenue (million), by Country 2024 & 2032
- Figure 7: North America Threat Hunting Service Revenue Share (%), by Country 2024 & 2032
- Figure 8: South America Threat Hunting Service Revenue (million), by Application 2024 & 2032
- Figure 9: South America Threat Hunting Service Revenue Share (%), by Application 2024 & 2032
- Figure 10: South America Threat Hunting Service Revenue (million), by Type 2024 & 2032
- Figure 11: South America Threat Hunting Service Revenue Share (%), by Type 2024 & 2032
- Figure 12: South America Threat Hunting Service Revenue (million), by Country 2024 & 2032
- Figure 13: South America Threat Hunting Service Revenue Share (%), by Country 2024 & 2032
- Figure 14: Europe Threat Hunting Service Revenue (million), by Application 2024 & 2032
- Figure 15: Europe Threat Hunting Service Revenue Share (%), by Application 2024 & 2032
- Figure 16: Europe Threat Hunting Service Revenue (million), by Type 2024 & 2032
- Figure 17: Europe Threat Hunting Service Revenue Share (%), by Type 2024 & 2032
- Figure 18: Europe Threat Hunting Service Revenue (million), by Country 2024 & 2032
- Figure 19: Europe Threat Hunting Service Revenue Share (%), by Country 2024 & 2032
- Figure 20: Middle East & Africa Threat Hunting Service Revenue (million), by Application 2024 & 2032
- Figure 21: Middle East & Africa Threat Hunting Service Revenue Share (%), by Application 2024 & 2032
- Figure 22: Middle East & Africa Threat Hunting Service Revenue (million), by Type 2024 & 2032
- Figure 23: Middle East & Africa Threat Hunting Service Revenue Share (%), by Type 2024 & 2032
- Figure 24: Middle East & Africa Threat Hunting Service Revenue (million), by Country 2024 & 2032
- Figure 25: Middle East & Africa Threat Hunting Service Revenue Share (%), by Country 2024 & 2032
- Figure 26: Asia Pacific Threat Hunting Service Revenue (million), by Application 2024 & 2032
- Figure 27: Asia Pacific Threat Hunting Service Revenue Share (%), by Application 2024 & 2032
- Figure 28: Asia Pacific Threat Hunting Service Revenue (million), by Type 2024 & 2032
- Figure 29: Asia Pacific Threat Hunting Service Revenue Share (%), by Type 2024 & 2032
- Figure 30: Asia Pacific Threat Hunting Service Revenue (million), by Country 2024 & 2032
- Figure 31: Asia Pacific Threat Hunting Service Revenue Share (%), by Country 2024 & 2032
List of Tables
- Table 1: Global Threat Hunting Service Revenue million Forecast, by Region 2019 & 2032
- Table 2: Global Threat Hunting Service Revenue million Forecast, by Application 2019 & 2032
- Table 3: Global Threat Hunting Service Revenue million Forecast, by Type 2019 & 2032
- Table 4: Global Threat Hunting Service Revenue million Forecast, by Region 2019 & 2032
- Table 5: Global Threat Hunting Service Revenue million Forecast, by Application 2019 & 2032
- Table 6: Global Threat Hunting Service Revenue million Forecast, by Type 2019 & 2032
- Table 7: Global Threat Hunting Service Revenue million Forecast, by Country 2019 & 2032
- Table 8: United States Threat Hunting Service Revenue (million) Forecast, by Application 2019 & 2032
- Table 9: Canada Threat Hunting Service Revenue (million) Forecast, by Application 2019 & 2032
- Table 10: Mexico Threat Hunting Service Revenue (million) Forecast, by Application 2019 & 2032
- Table 11: Global Threat Hunting Service Revenue million Forecast, by Application 2019 & 2032
- Table 12: Global Threat Hunting Service Revenue million Forecast, by Type 2019 & 2032
- Table 13: Global Threat Hunting Service Revenue million Forecast, by Country 2019 & 2032
- Table 14: Brazil Threat Hunting Service Revenue (million) Forecast, by Application 2019 & 2032
- Table 15: Argentina Threat Hunting Service Revenue (million) Forecast, by Application 2019 & 2032
- Table 16: Rest of South America Threat Hunting Service Revenue (million) Forecast, by Application 2019 & 2032
- Table 17: Global Threat Hunting Service Revenue million Forecast, by Application 2019 & 2032
- Table 18: Global Threat Hunting Service Revenue million Forecast, by Type 2019 & 2032
- Table 19: Global Threat Hunting Service Revenue million Forecast, by Country 2019 & 2032
- Table 20: United Kingdom Threat Hunting Service Revenue (million) Forecast, by Application 2019 & 2032
- Table 21: Germany Threat Hunting Service Revenue (million) Forecast, by Application 2019 & 2032
- Table 22: France Threat Hunting Service Revenue (million) Forecast, by Application 2019 & 2032
- Table 23: Italy Threat Hunting Service Revenue (million) Forecast, by Application 2019 & 2032
- Table 24: Spain Threat Hunting Service Revenue (million) Forecast, by Application 2019 & 2032
- Table 25: Russia Threat Hunting Service Revenue (million) Forecast, by Application 2019 & 2032
- Table 26: Benelux Threat Hunting Service Revenue (million) Forecast, by Application 2019 & 2032
- Table 27: Nordics Threat Hunting Service Revenue (million) Forecast, by Application 2019 & 2032
- Table 28: Rest of Europe Threat Hunting Service Revenue (million) Forecast, by Application 2019 & 2032
- Table 29: Global Threat Hunting Service Revenue million Forecast, by Application 2019 & 2032
- Table 30: Global Threat Hunting Service Revenue million Forecast, by Type 2019 & 2032
- Table 31: Global Threat Hunting Service Revenue million Forecast, by Country 2019 & 2032
- Table 32: Turkey Threat Hunting Service Revenue (million) Forecast, by Application 2019 & 2032
- Table 33: Israel Threat Hunting Service Revenue (million) Forecast, by Application 2019 & 2032
- Table 34: GCC Threat Hunting Service Revenue (million) Forecast, by Application 2019 & 2032
- Table 35: North Africa Threat Hunting Service Revenue (million) Forecast, by Application 2019 & 2032
- Table 36: South Africa Threat Hunting Service Revenue (million) Forecast, by Application 2019 & 2032
- Table 37: Rest of Middle East & Africa Threat Hunting Service Revenue (million) Forecast, by Application 2019 & 2032
- Table 38: Global Threat Hunting Service Revenue million Forecast, by Application 2019 & 2032
- Table 39: Global Threat Hunting Service Revenue million Forecast, by Type 2019 & 2032
- Table 40: Global Threat Hunting Service Revenue million Forecast, by Country 2019 & 2032
- Table 41: China Threat Hunting Service Revenue (million) Forecast, by Application 2019 & 2032
- Table 42: India Threat Hunting Service Revenue (million) Forecast, by Application 2019 & 2032
- Table 43: Japan Threat Hunting Service Revenue (million) Forecast, by Application 2019 & 2032
- Table 44: South Korea Threat Hunting Service Revenue (million) Forecast, by Application 2019 & 2032
- Table 45: ASEAN Threat Hunting Service Revenue (million) Forecast, by Application 2019 & 2032
- Table 46: Oceania Threat Hunting Service Revenue (million) Forecast, by Application 2019 & 2032
- Table 47: Rest of Asia Pacific Threat Hunting Service Revenue (million) Forecast, by Application 2019 & 2032
Frequently Asked Questions
1. What is the projected Compound Annual Growth Rate (CAGR) of the Threat Hunting Service?
The projected CAGR is approximately 11.7%.
2. Which companies are prominent players in the Threat Hunting Service?
Key companies in the market include IBM, CapGemini, Kaspersky Lab, Symantec, Carbon Black, Clearnetwork, CyberDefenses, Cybereason, Delta Risk, Ingalls Information Security, IronNet Cybersecurity, Paladion, Redscan, SecureWorks, Sophos, TalaTek, Singtel, Verizon Enterprise.
3. What are the main segments of the Threat Hunting Service?
The market segments include Application, Type.
4. Can you provide details about the market size?
The market size is estimated to be USD 6832 million as of 2022.
5. What are some drivers contributing to market growth?
N/A
6. What are the notable trends driving market growth?
N/A
7. Are there any restraints impacting market growth?
N/A
8. Can you provide examples of recent developments in the market?
N/A
9. What pricing options are available for accessing the report?
Pricing options include single-user, multi-user, and enterprise licenses priced at USD 2900.00, USD 4350.00, and USD 5800.00 respectively.
10. Is the market size provided in terms of value or volume?
The market size is provided in terms of value, measured in million.
11. Are there any specific market keywords associated with the report?
Yes, the market keyword associated with the report is "Threat Hunting Service," which aids in identifying and referencing the specific market segment covered.
12. How do I determine which pricing option suits my needs best?
The pricing options vary based on user requirements and access needs. Individual users may opt for single-user licenses, while businesses requiring broader access may choose multi-user or enterprise licenses for cost-effective access to the report.
13. Are there any additional resources or data provided in the Threat Hunting Service report?
While the report offers comprehensive insights, it's advisable to review the specific contents or supplementary materials provided to ascertain if additional resources or data are available.
14. How can I stay updated on further developments or reports in the Threat Hunting Service?
To stay informed about further developments, trends, and reports in the Threat Hunting Service, consider subscribing to industry newsletters, following relevant companies and organizations, or regularly checking reputable industry news sources and publications.
Methodology
Step 1 - Identification of Relevant Samples Size from Population Database


Step 2 - Approaches for Defining Global Market Size (Value, Volume* & Price*)

Note*: In applicable scenarios
Step 3 - Data Sources
Primary Research
- Web Analytics
- Survey Reports
- Research Institute
- Latest Research Reports
- Opinion Leaders
Secondary Research
- Annual Reports
- White Paper
- Latest Press Release
- Industry Association
- Paid Database
- Investor Presentations

Step 4 - Data Triangulation
Involves using different sources of information in order to increase the validity of a study
These sources are likely to be stakeholders in a program - participants, other researchers, program staff, other community members, and so on.
Then we put all data in single framework & apply various statistical tools to find out the dynamic on the market.
During the analysis stage, feedback from the stakeholder groups would be compared to determine areas of agreement as well as areas of divergence
