

Key Insights
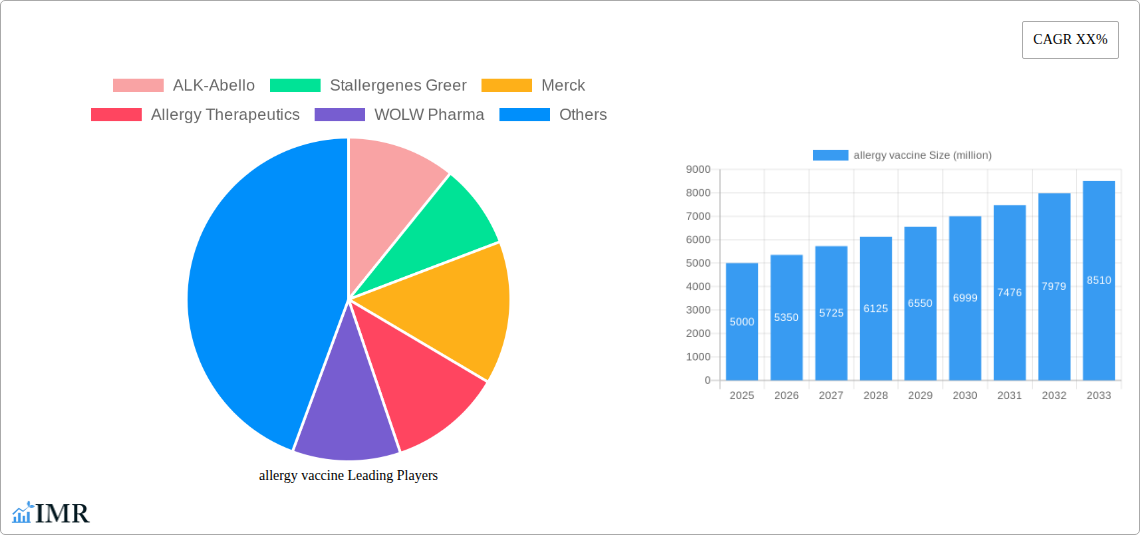
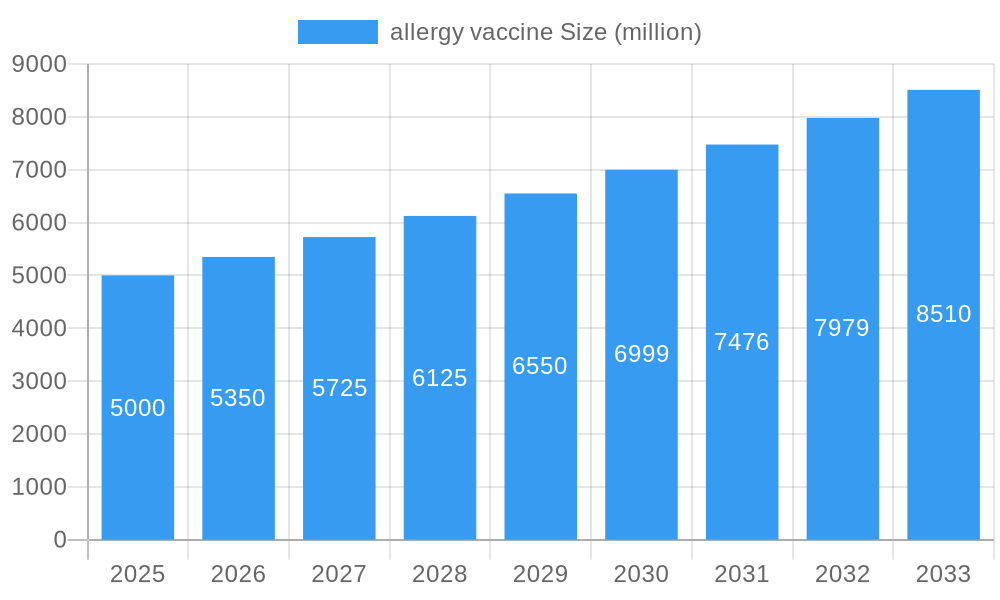
The global allergy vaccine market is experiencing robust growth, driven by rising prevalence of allergic diseases, increasing awareness about allergy treatments, and advancements in vaccine technology. The market, estimated at $5 billion in 2025, is projected to exhibit a Compound Annual Growth Rate (CAGR) of 7% from 2025 to 2033, reaching approximately $9 billion by 2033. This growth is fueled by several key factors. Firstly, the increasing incidence of allergic rhinitis, asthma, and food allergies across the globe is creating a larger pool of potential patients. Secondly, a growing understanding of the benefits of allergy immunotherapy, particularly its ability to provide long-term relief, is encouraging higher adoption rates. Thirdly, the continuous innovation in allergy vaccine technology, including the development of more effective and less-allergenic formulations, is contributing significantly to market expansion. Leading companies such as ALK-Abello, Stallergenes Greer, and Merck are investing heavily in R&D to improve efficacy and safety profiles, further stimulating market growth.
allergy vaccine Market Size (In Billion)
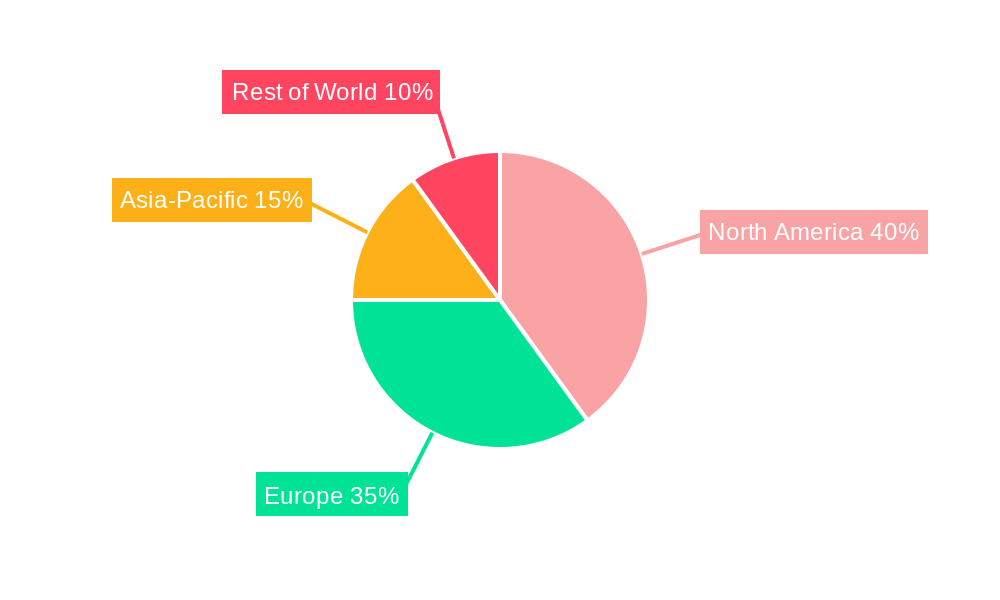
However, several factors restrain market growth. High cost of treatment, lengthy treatment duration required for allergy vaccines, potential side effects, and variable patient response rates act as barriers to wider adoption. Moreover, the market is geographically concentrated, with North America and Europe currently holding a significant share. Future growth will depend on expanding market penetration in emerging economies, where the prevalence of allergic diseases is also rising, but healthcare infrastructure and access to specialized treatments remain challenges. Nevertheless, the overall market outlook remains positive, driven by the unmet medical need and ongoing efforts to enhance vaccine efficacy and accessibility. Segmentation by allergy type (e.g., pollen, food, insect venom), vaccine type (e.g., subcutaneous, sublingual), and geographic region will further shape market dynamics in the coming years.
allergy vaccine Company Market Share
Allergy Vaccine Market Report: 2019-2033
This comprehensive report provides an in-depth analysis of the global allergy vaccine market, offering invaluable insights for industry professionals, investors, and strategic decision-makers. Covering the period 2019-2033, with a focus on 2025, this report meticulously examines market dynamics, growth trends, competitive landscapes, and future opportunities within the allergy vaccine sector and its parent market (immunotherapy) and child market (pediatric allergy treatment). The report quantifies market size in million units and offers actionable intelligence to navigate this dynamic market.
Allergy Vaccine Market Dynamics & Structure
The global allergy vaccine market is characterized by moderate concentration, with key players like ALK-Abello, Stallergenes Greer, Merck, and Allergy Therapeutics holding significant market share (estimated at xx% collectively in 2025). Technological innovation, primarily focused on improved efficacy, safety, and delivery methods (e.g., sublingual immunotherapy), is a key driver. Regulatory frameworks vary across regions, impacting market access and product approvals. The market faces competition from alternative treatments, including antihistamines and corticosteroids. The end-user demographics are expanding, driven by rising allergy prevalence, particularly in developed nations. M&A activity has been moderate (xx deals in the historical period), with larger players strategically acquiring smaller companies to expand their product portfolios and geographical reach.
- Market Concentration: Moderately concentrated, with top 4 players holding xx% market share in 2025.
- Technological Innovation: Focus on improved efficacy, safety, and novel delivery systems.
- Regulatory Landscape: Varying approval processes across regions pose challenges.
- Competitive Substitutes: Antihistamines and corticosteroids present competitive pressures.
- End-User Demographics: Growing prevalence of allergies fuels market expansion.
- M&A Activity: xx deals in 2019-2024, indicating strategic consolidation.
Allergy Vaccine Growth Trends & Insights
The global allergy vaccine market experienced a CAGR of xx% during the historical period (2019-2024), reaching xx million units in 2025. This growth is attributed to increased awareness of allergy treatments, rising prevalence of allergic diseases, and the launch of innovative products. Market penetration remains relatively low (xx% in 2025), indicating significant untapped potential. Technological disruptions, including the development of personalized allergy vaccines, are poised to further accelerate market growth. Shifting consumer behavior towards proactive healthcare management also contributes to increased demand. The forecast period (2025-2033) projects a CAGR of xx%, reaching xx million units by 2033.
Dominant Regions, Countries, or Segments in Allergy Vaccine
North America currently dominates the allergy vaccine market, holding the largest market share (xx% in 2025) due to high allergy prevalence, robust healthcare infrastructure, and strong regulatory support. Europe follows closely, driven by similar factors. However, the Asia-Pacific region is expected to witness the fastest growth in the forecast period, fueled by rising disposable incomes, increasing healthcare expenditure, and growing awareness of allergic diseases.
- North America: High prevalence, strong infrastructure, and regulatory support drive market dominance.
- Europe: Similar drivers to North America contribute to significant market share.
- Asia-Pacific: Rapid growth potential due to rising incomes, healthcare spending, and awareness.
- Other Regions: Represent a significant, albeit smaller, portion of the market.
Allergy Vaccine Product Landscape
The allergy vaccine market offers a range of products, including sublingual tablets, subcutaneous injections, and other formulations. Recent innovations focus on improved efficacy, reduced side effects, and convenient administration. Unique selling propositions often center around personalized treatment approaches, targeting specific allergens and minimizing discomfort. Technological advancements are geared towards enhancing the accuracy of allergen identification and optimizing immune response stimulation.
Key Drivers, Barriers & Challenges in Allergy Vaccine
Key Drivers:
- Rising prevalence of allergic diseases globally.
- Increasing healthcare expenditure and insurance coverage.
- Growing awareness and acceptance of allergy immunotherapy.
- Technological advancements leading to safer and more effective vaccines.
Key Challenges:
- High cost of treatment limits accessibility in certain regions.
- Lengthy treatment duration and potential side effects can deter patients.
- Stringent regulatory requirements extend the product development timeline.
- Competition from alternative treatments like antihistamines and corticosteroids.
Emerging Opportunities in Allergy Vaccine
- Expansion into underserved markets in developing countries.
- Development of personalized and targeted allergy vaccines.
- Exploration of novel delivery systems for enhanced convenience and efficacy.
- Integration of digital technologies for patient monitoring and treatment management.
Growth Accelerators in the Allergy Vaccine Industry
Strategic partnerships between pharmaceutical companies and research institutions are accelerating the development of innovative allergy vaccines. Technological breakthroughs, such as the use of bioinformatics and AI in allergen identification and vaccine design, are further enhancing treatment efficacy and safety. Expansion into new geographical markets, particularly in rapidly developing economies, presents significant growth potential.
Key Players Shaping the Allergy Vaccine Market
- ALK-Abello
- Stallergenes Greer
- Merck
- Allergy Therapeutics
- WOLW Pharma
- HAL
- Holister Stier
- Leti
Notable Milestones in Allergy Vaccine Sector
- 2021: ALK-Abello launches a new sublingual immunotherapy product.
- 2022: Stallergenes Greer announces positive clinical trial results for a novel allergy vaccine.
- 2023: Merck acquires a smaller biotech company specializing in allergy immunotherapy. (Further milestones can be added here with specific details)
In-Depth Allergy Vaccine Market Outlook
The allergy vaccine market is poised for significant growth over the next decade, driven by continued technological innovation, increased prevalence of allergic diseases, and expansion into new markets. Strategic collaborations and investments in research and development will play a crucial role in shaping the future of this sector, unlocking new opportunities for personalized medicine and enhanced treatment outcomes. The market is projected to reach xx million units by 2033, representing substantial growth potential for key players and new entrants.
allergy vaccine Segmentation
-
1. Application
- 1.1. Allergic Rhinitis
- 1.2. Allergic Asthma
- 1.3. Other
-
2. Types
- 2.1. Subcutaneous Immunotherapy
- 2.2. Sublingual Immunotherapy
allergy vaccine Segmentation By Geography
-
1. North America
- 1.1. United States
- 1.2. Canada
- 1.3. Mexico
-
2. South America
- 2.1. Brazil
- 2.2. Argentina
- 2.3. Rest of South America
-
3. Europe
- 3.1. United Kingdom
- 3.2. Germany
- 3.3. France
- 3.4. Italy
- 3.5. Spain
- 3.6. Russia
- 3.7. Benelux
- 3.8. Nordics
- 3.9. Rest of Europe
-
4. Middle East & Africa
- 4.1. Turkey
- 4.2. Israel
- 4.3. GCC
- 4.4. North Africa
- 4.5. South Africa
- 4.6. Rest of Middle East & Africa
-
5. Asia Pacific
- 5.1. China
- 5.2. India
- 5.3. Japan
- 5.4. South Korea
- 5.5. ASEAN
- 5.6. Oceania
- 5.7. Rest of Asia Pacific
allergy vaccine Regional Market Share
Geographic Coverage of allergy vaccine
allergy vaccine REPORT HIGHLIGHTS
| Aspects | Details |
|---|---|
| Study Period | 2020-2034 |
| Base Year | 2025 |
| Estimated Year | 2026 |
| Forecast Period | 2026-2034 |
| Historical Period | 2020-2025 |
| Growth Rate | CAGR of XX% from 2020-2034 |
| Segmentation |
|
Table of Contents
- 1. Introduction
- 1.1. Research Scope
- 1.2. Market Segmentation
- 1.3. Research Methodology
- 1.4. Definitions and Assumptions
- 2. Executive Summary
- 2.1. Introduction
- 3. Market Dynamics
- 3.1. Introduction
- 3.2. Market Drivers
- 3.3. Market Restrains
- 3.4. Market Trends
- 4. Market Factor Analysis
- 4.1. Porters Five Forces
- 4.2. Supply/Value Chain
- 4.3. PESTEL analysis
- 4.4. Market Entropy
- 4.5. Patent/Trademark Analysis
- 5. Global allergy vaccine Analysis, Insights and Forecast, 2020-2032
- 5.1. Market Analysis, Insights and Forecast - by Application
- 5.1.1. Allergic Rhinitis
- 5.1.2. Allergic Asthma
- 5.1.3. Other
- 5.2. Market Analysis, Insights and Forecast - by Types
- 5.2.1. Subcutaneous Immunotherapy
- 5.2.2. Sublingual Immunotherapy
- 5.3. Market Analysis, Insights and Forecast - by Region
- 5.3.1. North America
- 5.3.2. South America
- 5.3.3. Europe
- 5.3.4. Middle East & Africa
- 5.3.5. Asia Pacific
- 5.1. Market Analysis, Insights and Forecast - by Application
- 6. North America allergy vaccine Analysis, Insights and Forecast, 2020-2032
- 6.1. Market Analysis, Insights and Forecast - by Application
- 6.1.1. Allergic Rhinitis
- 6.1.2. Allergic Asthma
- 6.1.3. Other
- 6.2. Market Analysis, Insights and Forecast - by Types
- 6.2.1. Subcutaneous Immunotherapy
- 6.2.2. Sublingual Immunotherapy
- 6.1. Market Analysis, Insights and Forecast - by Application
- 7. South America allergy vaccine Analysis, Insights and Forecast, 2020-2032
- 7.1. Market Analysis, Insights and Forecast - by Application
- 7.1.1. Allergic Rhinitis
- 7.1.2. Allergic Asthma
- 7.1.3. Other
- 7.2. Market Analysis, Insights and Forecast - by Types
- 7.2.1. Subcutaneous Immunotherapy
- 7.2.2. Sublingual Immunotherapy
- 7.1. Market Analysis, Insights and Forecast - by Application
- 8. Europe allergy vaccine Analysis, Insights and Forecast, 2020-2032
- 8.1. Market Analysis, Insights and Forecast - by Application
- 8.1.1. Allergic Rhinitis
- 8.1.2. Allergic Asthma
- 8.1.3. Other
- 8.2. Market Analysis, Insights and Forecast - by Types
- 8.2.1. Subcutaneous Immunotherapy
- 8.2.2. Sublingual Immunotherapy
- 8.1. Market Analysis, Insights and Forecast - by Application
- 9. Middle East & Africa allergy vaccine Analysis, Insights and Forecast, 2020-2032
- 9.1. Market Analysis, Insights and Forecast - by Application
- 9.1.1. Allergic Rhinitis
- 9.1.2. Allergic Asthma
- 9.1.3. Other
- 9.2. Market Analysis, Insights and Forecast - by Types
- 9.2.1. Subcutaneous Immunotherapy
- 9.2.2. Sublingual Immunotherapy
- 9.1. Market Analysis, Insights and Forecast - by Application
- 10. Asia Pacific allergy vaccine Analysis, Insights and Forecast, 2020-2032
- 10.1. Market Analysis, Insights and Forecast - by Application
- 10.1.1. Allergic Rhinitis
- 10.1.2. Allergic Asthma
- 10.1.3. Other
- 10.2. Market Analysis, Insights and Forecast - by Types
- 10.2.1. Subcutaneous Immunotherapy
- 10.2.2. Sublingual Immunotherapy
- 10.1. Market Analysis, Insights and Forecast - by Application
- 11. Competitive Analysis
- 11.1. Global Market Share Analysis 2025
- 11.2. Company Profiles
- 11.2.1 ALK-Abello
- 11.2.1.1. Overview
- 11.2.1.2. Products
- 11.2.1.3. SWOT Analysis
- 11.2.1.4. Recent Developments
- 11.2.1.5. Financials (Based on Availability)
- 11.2.2 Stallergenes Greer
- 11.2.2.1. Overview
- 11.2.2.2. Products
- 11.2.2.3. SWOT Analysis
- 11.2.2.4. Recent Developments
- 11.2.2.5. Financials (Based on Availability)
- 11.2.3 Merck
- 11.2.3.1. Overview
- 11.2.3.2. Products
- 11.2.3.3. SWOT Analysis
- 11.2.3.4. Recent Developments
- 11.2.3.5. Financials (Based on Availability)
- 11.2.4 Allergy Therapeutics
- 11.2.4.1. Overview
- 11.2.4.2. Products
- 11.2.4.3. SWOT Analysis
- 11.2.4.4. Recent Developments
- 11.2.4.5. Financials (Based on Availability)
- 11.2.5 WOLW Pharma
- 11.2.5.1. Overview
- 11.2.5.2. Products
- 11.2.5.3. SWOT Analysis
- 11.2.5.4. Recent Developments
- 11.2.5.5. Financials (Based on Availability)
- 11.2.6 HAL
- 11.2.6.1. Overview
- 11.2.6.2. Products
- 11.2.6.3. SWOT Analysis
- 11.2.6.4. Recent Developments
- 11.2.6.5. Financials (Based on Availability)
- 11.2.7 Holister Stier
- 11.2.7.1. Overview
- 11.2.7.2. Products
- 11.2.7.3. SWOT Analysis
- 11.2.7.4. Recent Developments
- 11.2.7.5. Financials (Based on Availability)
- 11.2.8 Leti
- 11.2.8.1. Overview
- 11.2.8.2. Products
- 11.2.8.3. SWOT Analysis
- 11.2.8.4. Recent Developments
- 11.2.8.5. Financials (Based on Availability)
- 11.2.1 ALK-Abello
List of Figures
- Figure 1: Global allergy vaccine Revenue Breakdown (million, %) by Region 2025 & 2033
- Figure 2: Global allergy vaccine Volume Breakdown (K, %) by Region 2025 & 2033
- Figure 3: North America allergy vaccine Revenue (million), by Application 2025 & 2033
- Figure 4: North America allergy vaccine Volume (K), by Application 2025 & 2033
- Figure 5: North America allergy vaccine Revenue Share (%), by Application 2025 & 2033
- Figure 6: North America allergy vaccine Volume Share (%), by Application 2025 & 2033
- Figure 7: North America allergy vaccine Revenue (million), by Types 2025 & 2033
- Figure 8: North America allergy vaccine Volume (K), by Types 2025 & 2033
- Figure 9: North America allergy vaccine Revenue Share (%), by Types 2025 & 2033
- Figure 10: North America allergy vaccine Volume Share (%), by Types 2025 & 2033
- Figure 11: North America allergy vaccine Revenue (million), by Country 2025 & 2033
- Figure 12: North America allergy vaccine Volume (K), by Country 2025 & 2033
- Figure 13: North America allergy vaccine Revenue Share (%), by Country 2025 & 2033
- Figure 14: North America allergy vaccine Volume Share (%), by Country 2025 & 2033
- Figure 15: South America allergy vaccine Revenue (million), by Application 2025 & 2033
- Figure 16: South America allergy vaccine Volume (K), by Application 2025 & 2033
- Figure 17: South America allergy vaccine Revenue Share (%), by Application 2025 & 2033
- Figure 18: South America allergy vaccine Volume Share (%), by Application 2025 & 2033
- Figure 19: South America allergy vaccine Revenue (million), by Types 2025 & 2033
- Figure 20: South America allergy vaccine Volume (K), by Types 2025 & 2033
- Figure 21: South America allergy vaccine Revenue Share (%), by Types 2025 & 2033
- Figure 22: South America allergy vaccine Volume Share (%), by Types 2025 & 2033
- Figure 23: South America allergy vaccine Revenue (million), by Country 2025 & 2033
- Figure 24: South America allergy vaccine Volume (K), by Country 2025 & 2033
- Figure 25: South America allergy vaccine Revenue Share (%), by Country 2025 & 2033
- Figure 26: South America allergy vaccine Volume Share (%), by Country 2025 & 2033
- Figure 27: Europe allergy vaccine Revenue (million), by Application 2025 & 2033
- Figure 28: Europe allergy vaccine Volume (K), by Application 2025 & 2033
- Figure 29: Europe allergy vaccine Revenue Share (%), by Application 2025 & 2033
- Figure 30: Europe allergy vaccine Volume Share (%), by Application 2025 & 2033
- Figure 31: Europe allergy vaccine Revenue (million), by Types 2025 & 2033
- Figure 32: Europe allergy vaccine Volume (K), by Types 2025 & 2033
- Figure 33: Europe allergy vaccine Revenue Share (%), by Types 2025 & 2033
- Figure 34: Europe allergy vaccine Volume Share (%), by Types 2025 & 2033
- Figure 35: Europe allergy vaccine Revenue (million), by Country 2025 & 2033
- Figure 36: Europe allergy vaccine Volume (K), by Country 2025 & 2033
- Figure 37: Europe allergy vaccine Revenue Share (%), by Country 2025 & 2033
- Figure 38: Europe allergy vaccine Volume Share (%), by Country 2025 & 2033
- Figure 39: Middle East & Africa allergy vaccine Revenue (million), by Application 2025 & 2033
- Figure 40: Middle East & Africa allergy vaccine Volume (K), by Application 2025 & 2033
- Figure 41: Middle East & Africa allergy vaccine Revenue Share (%), by Application 2025 & 2033
- Figure 42: Middle East & Africa allergy vaccine Volume Share (%), by Application 2025 & 2033
- Figure 43: Middle East & Africa allergy vaccine Revenue (million), by Types 2025 & 2033
- Figure 44: Middle East & Africa allergy vaccine Volume (K), by Types 2025 & 2033
- Figure 45: Middle East & Africa allergy vaccine Revenue Share (%), by Types 2025 & 2033
- Figure 46: Middle East & Africa allergy vaccine Volume Share (%), by Types 2025 & 2033
- Figure 47: Middle East & Africa allergy vaccine Revenue (million), by Country 2025 & 2033
- Figure 48: Middle East & Africa allergy vaccine Volume (K), by Country 2025 & 2033
- Figure 49: Middle East & Africa allergy vaccine Revenue Share (%), by Country 2025 & 2033
- Figure 50: Middle East & Africa allergy vaccine Volume Share (%), by Country 2025 & 2033
- Figure 51: Asia Pacific allergy vaccine Revenue (million), by Application 2025 & 2033
- Figure 52: Asia Pacific allergy vaccine Volume (K), by Application 2025 & 2033
- Figure 53: Asia Pacific allergy vaccine Revenue Share (%), by Application 2025 & 2033
- Figure 54: Asia Pacific allergy vaccine Volume Share (%), by Application 2025 & 2033
- Figure 55: Asia Pacific allergy vaccine Revenue (million), by Types 2025 & 2033
- Figure 56: Asia Pacific allergy vaccine Volume (K), by Types 2025 & 2033
- Figure 57: Asia Pacific allergy vaccine Revenue Share (%), by Types 2025 & 2033
- Figure 58: Asia Pacific allergy vaccine Volume Share (%), by Types 2025 & 2033
- Figure 59: Asia Pacific allergy vaccine Revenue (million), by Country 2025 & 2033
- Figure 60: Asia Pacific allergy vaccine Volume (K), by Country 2025 & 2033
- Figure 61: Asia Pacific allergy vaccine Revenue Share (%), by Country 2025 & 2033
- Figure 62: Asia Pacific allergy vaccine Volume Share (%), by Country 2025 & 2033
List of Tables
- Table 1: Global allergy vaccine Revenue million Forecast, by Application 2020 & 2033
- Table 2: Global allergy vaccine Volume K Forecast, by Application 2020 & 2033
- Table 3: Global allergy vaccine Revenue million Forecast, by Types 2020 & 2033
- Table 4: Global allergy vaccine Volume K Forecast, by Types 2020 & 2033
- Table 5: Global allergy vaccine Revenue million Forecast, by Region 2020 & 2033
- Table 6: Global allergy vaccine Volume K Forecast, by Region 2020 & 2033
- Table 7: Global allergy vaccine Revenue million Forecast, by Application 2020 & 2033
- Table 8: Global allergy vaccine Volume K Forecast, by Application 2020 & 2033
- Table 9: Global allergy vaccine Revenue million Forecast, by Types 2020 & 2033
- Table 10: Global allergy vaccine Volume K Forecast, by Types 2020 & 2033
- Table 11: Global allergy vaccine Revenue million Forecast, by Country 2020 & 2033
- Table 12: Global allergy vaccine Volume K Forecast, by Country 2020 & 2033
- Table 13: United States allergy vaccine Revenue (million) Forecast, by Application 2020 & 2033
- Table 14: United States allergy vaccine Volume (K) Forecast, by Application 2020 & 2033
- Table 15: Canada allergy vaccine Revenue (million) Forecast, by Application 2020 & 2033
- Table 16: Canada allergy vaccine Volume (K) Forecast, by Application 2020 & 2033
- Table 17: Mexico allergy vaccine Revenue (million) Forecast, by Application 2020 & 2033
- Table 18: Mexico allergy vaccine Volume (K) Forecast, by Application 2020 & 2033
- Table 19: Global allergy vaccine Revenue million Forecast, by Application 2020 & 2033
- Table 20: Global allergy vaccine Volume K Forecast, by Application 2020 & 2033
- Table 21: Global allergy vaccine Revenue million Forecast, by Types 2020 & 2033
- Table 22: Global allergy vaccine Volume K Forecast, by Types 2020 & 2033
- Table 23: Global allergy vaccine Revenue million Forecast, by Country 2020 & 2033
- Table 24: Global allergy vaccine Volume K Forecast, by Country 2020 & 2033
- Table 25: Brazil allergy vaccine Revenue (million) Forecast, by Application 2020 & 2033
- Table 26: Brazil allergy vaccine Volume (K) Forecast, by Application 2020 & 2033
- Table 27: Argentina allergy vaccine Revenue (million) Forecast, by Application 2020 & 2033
- Table 28: Argentina allergy vaccine Volume (K) Forecast, by Application 2020 & 2033
- Table 29: Rest of South America allergy vaccine Revenue (million) Forecast, by Application 2020 & 2033
- Table 30: Rest of South America allergy vaccine Volume (K) Forecast, by Application 2020 & 2033
- Table 31: Global allergy vaccine Revenue million Forecast, by Application 2020 & 2033
- Table 32: Global allergy vaccine Volume K Forecast, by Application 2020 & 2033
- Table 33: Global allergy vaccine Revenue million Forecast, by Types 2020 & 2033
- Table 34: Global allergy vaccine Volume K Forecast, by Types 2020 & 2033
- Table 35: Global allergy vaccine Revenue million Forecast, by Country 2020 & 2033
- Table 36: Global allergy vaccine Volume K Forecast, by Country 2020 & 2033
- Table 37: United Kingdom allergy vaccine Revenue (million) Forecast, by Application 2020 & 2033
- Table 38: United Kingdom allergy vaccine Volume (K) Forecast, by Application 2020 & 2033
- Table 39: Germany allergy vaccine Revenue (million) Forecast, by Application 2020 & 2033
- Table 40: Germany allergy vaccine Volume (K) Forecast, by Application 2020 & 2033
- Table 41: France allergy vaccine Revenue (million) Forecast, by Application 2020 & 2033
- Table 42: France allergy vaccine Volume (K) Forecast, by Application 2020 & 2033
- Table 43: Italy allergy vaccine Revenue (million) Forecast, by Application 2020 & 2033
- Table 44: Italy allergy vaccine Volume (K) Forecast, by Application 2020 & 2033
- Table 45: Spain allergy vaccine Revenue (million) Forecast, by Application 2020 & 2033
- Table 46: Spain allergy vaccine Volume (K) Forecast, by Application 2020 & 2033
- Table 47: Russia allergy vaccine Revenue (million) Forecast, by Application 2020 & 2033
- Table 48: Russia allergy vaccine Volume (K) Forecast, by Application 2020 & 2033
- Table 49: Benelux allergy vaccine Revenue (million) Forecast, by Application 2020 & 2033
- Table 50: Benelux allergy vaccine Volume (K) Forecast, by Application 2020 & 2033
- Table 51: Nordics allergy vaccine Revenue (million) Forecast, by Application 2020 & 2033
- Table 52: Nordics allergy vaccine Volume (K) Forecast, by Application 2020 & 2033
- Table 53: Rest of Europe allergy vaccine Revenue (million) Forecast, by Application 2020 & 2033
- Table 54: Rest of Europe allergy vaccine Volume (K) Forecast, by Application 2020 & 2033
- Table 55: Global allergy vaccine Revenue million Forecast, by Application 2020 & 2033
- Table 56: Global allergy vaccine Volume K Forecast, by Application 2020 & 2033
- Table 57: Global allergy vaccine Revenue million Forecast, by Types 2020 & 2033
- Table 58: Global allergy vaccine Volume K Forecast, by Types 2020 & 2033
- Table 59: Global allergy vaccine Revenue million Forecast, by Country 2020 & 2033
- Table 60: Global allergy vaccine Volume K Forecast, by Country 2020 & 2033
- Table 61: Turkey allergy vaccine Revenue (million) Forecast, by Application 2020 & 2033
- Table 62: Turkey allergy vaccine Volume (K) Forecast, by Application 2020 & 2033
- Table 63: Israel allergy vaccine Revenue (million) Forecast, by Application 2020 & 2033
- Table 64: Israel allergy vaccine Volume (K) Forecast, by Application 2020 & 2033
- Table 65: GCC allergy vaccine Revenue (million) Forecast, by Application 2020 & 2033
- Table 66: GCC allergy vaccine Volume (K) Forecast, by Application 2020 & 2033
- Table 67: North Africa allergy vaccine Revenue (million) Forecast, by Application 2020 & 2033
- Table 68: North Africa allergy vaccine Volume (K) Forecast, by Application 2020 & 2033
- Table 69: South Africa allergy vaccine Revenue (million) Forecast, by Application 2020 & 2033
- Table 70: South Africa allergy vaccine Volume (K) Forecast, by Application 2020 & 2033
- Table 71: Rest of Middle East & Africa allergy vaccine Revenue (million) Forecast, by Application 2020 & 2033
- Table 72: Rest of Middle East & Africa allergy vaccine Volume (K) Forecast, by Application 2020 & 2033
- Table 73: Global allergy vaccine Revenue million Forecast, by Application 2020 & 2033
- Table 74: Global allergy vaccine Volume K Forecast, by Application 2020 & 2033
- Table 75: Global allergy vaccine Revenue million Forecast, by Types 2020 & 2033
- Table 76: Global allergy vaccine Volume K Forecast, by Types 2020 & 2033
- Table 77: Global allergy vaccine Revenue million Forecast, by Country 2020 & 2033
- Table 78: Global allergy vaccine Volume K Forecast, by Country 2020 & 2033
- Table 79: China allergy vaccine Revenue (million) Forecast, by Application 2020 & 2033
- Table 80: China allergy vaccine Volume (K) Forecast, by Application 2020 & 2033
- Table 81: India allergy vaccine Revenue (million) Forecast, by Application 2020 & 2033
- Table 82: India allergy vaccine Volume (K) Forecast, by Application 2020 & 2033
- Table 83: Japan allergy vaccine Revenue (million) Forecast, by Application 2020 & 2033
- Table 84: Japan allergy vaccine Volume (K) Forecast, by Application 2020 & 2033
- Table 85: South Korea allergy vaccine Revenue (million) Forecast, by Application 2020 & 2033
- Table 86: South Korea allergy vaccine Volume (K) Forecast, by Application 2020 & 2033
- Table 87: ASEAN allergy vaccine Revenue (million) Forecast, by Application 2020 & 2033
- Table 88: ASEAN allergy vaccine Volume (K) Forecast, by Application 2020 & 2033
- Table 89: Oceania allergy vaccine Revenue (million) Forecast, by Application 2020 & 2033
- Table 90: Oceania allergy vaccine Volume (K) Forecast, by Application 2020 & 2033
- Table 91: Rest of Asia Pacific allergy vaccine Revenue (million) Forecast, by Application 2020 & 2033
- Table 92: Rest of Asia Pacific allergy vaccine Volume (K) Forecast, by Application 2020 & 2033
Frequently Asked Questions
1. What is the projected Compound Annual Growth Rate (CAGR) of the allergy vaccine?
The projected CAGR is approximately XX%.
2. Which companies are prominent players in the allergy vaccine?
Key companies in the market include ALK-Abello, Stallergenes Greer, Merck, Allergy Therapeutics, WOLW Pharma, HAL, Holister Stier, Leti.
3. What are the main segments of the allergy vaccine?
The market segments include Application, Types.
4. Can you provide details about the market size?
The market size is estimated to be USD XXX million as of 2022.
5. What are some drivers contributing to market growth?
N/A
6. What are the notable trends driving market growth?
N/A
7. Are there any restraints impacting market growth?
N/A
8. Can you provide examples of recent developments in the market?
N/A
9. What pricing options are available for accessing the report?
Pricing options include single-user, multi-user, and enterprise licenses priced at USD 4350.00, USD 6525.00, and USD 8700.00 respectively.
10. Is the market size provided in terms of value or volume?
The market size is provided in terms of value, measured in million and volume, measured in K.
11. Are there any specific market keywords associated with the report?
Yes, the market keyword associated with the report is "allergy vaccine," which aids in identifying and referencing the specific market segment covered.
12. How do I determine which pricing option suits my needs best?
The pricing options vary based on user requirements and access needs. Individual users may opt for single-user licenses, while businesses requiring broader access may choose multi-user or enterprise licenses for cost-effective access to the report.
13. Are there any additional resources or data provided in the allergy vaccine report?
While the report offers comprehensive insights, it's advisable to review the specific contents or supplementary materials provided to ascertain if additional resources or data are available.
14. How can I stay updated on further developments or reports in the allergy vaccine?
To stay informed about further developments, trends, and reports in the allergy vaccine, consider subscribing to industry newsletters, following relevant companies and organizations, or regularly checking reputable industry news sources and publications.
Methodology
Step 1 - Identification of Relevant Samples Size from Population Database


Step 2 - Approaches for Defining Global Market Size (Value, Volume* & Price*)

Note*: In applicable scenarios
Step 3 - Data Sources
Primary Research
- Web Analytics
- Survey Reports
- Research Institute
- Latest Research Reports
- Opinion Leaders
Secondary Research
- Annual Reports
- White Paper
- Latest Press Release
- Industry Association
- Paid Database
- Investor Presentations

Step 4 - Data Triangulation
Involves using different sources of information in order to increase the validity of a study
These sources are likely to be stakeholders in a program - participants, other researchers, program staff, other community members, and so on.
Then we put all data in single framework & apply various statistical tools to find out the dynamic on the market.
During the analysis stage, feedback from the stakeholder groups would be compared to determine areas of agreement as well as areas of divergence