

Key Insights
The Asia-Pacific (APAC) feed amino acids market is experiencing robust growth, driven by the increasing demand for animal protein, particularly in rapidly developing economies like China, India, and Southeast Asia. The expanding aquaculture sector, coupled with rising poultry and swine production, fuels significant demand for essential amino acids like lysine, methionine, and threonine. These amino acids are crucial for optimizing animal feed formulations, enhancing feed efficiency, and improving animal health and productivity. A compound annual growth rate (CAGR) of 6.40% from 2019 to 2033 reflects a substantial market expansion, projected to reach a considerable market size within the forecast period. This growth is further fueled by evolving consumer preferences for high-quality protein sources and advancements in animal nutrition technologies. While challenges such as fluctuating raw material prices and stringent regulatory requirements exist, the overall market outlook remains positive.
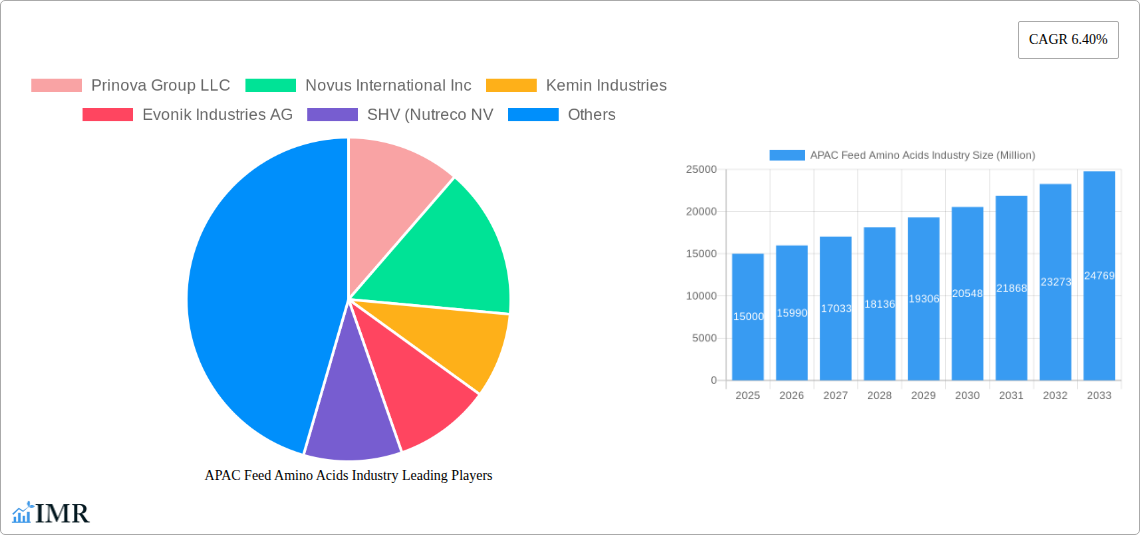
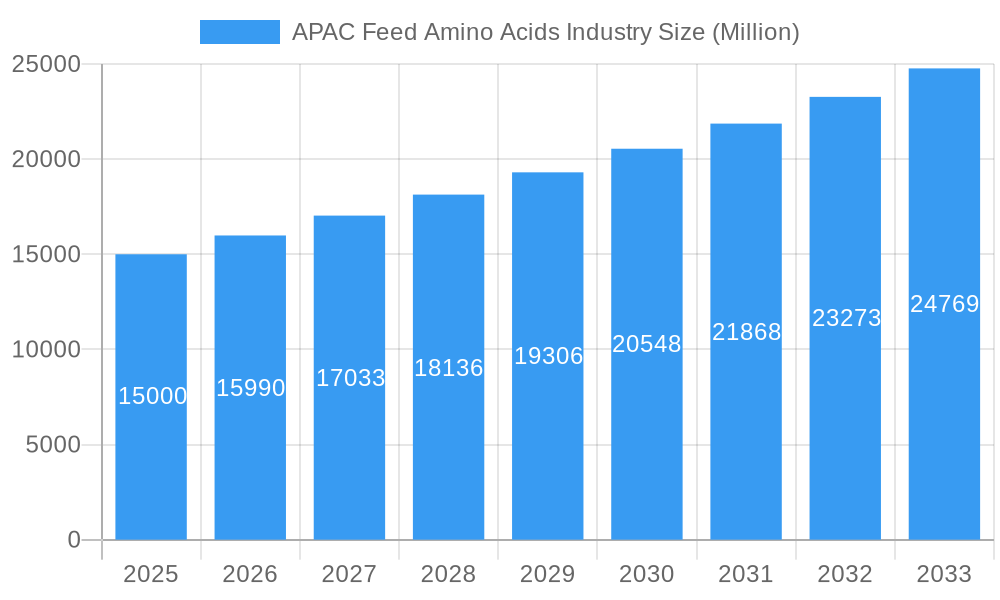
APAC Feed Amino Acids Industry Market Size (In Billion)
However, the market's trajectory isn't uniform across all segments. While lysine and methionine maintain significant market dominance due to widespread usage, the demand for other amino acids like threonine and tryptophan is steadily increasing, driven by a deeper understanding of their roles in animal nutrition and productivity. Similarly, regional variations are observed, with China, India, and Southeast Asian nations exhibiting strong growth due to their large livestock populations and expanding agricultural sectors. Conversely, mature markets like Japan and South Korea demonstrate more moderate growth rates, reflecting already high levels of amino acid usage in feed formulations. Competitive dynamics are intense, with established global players and regional manufacturers vying for market share, leading to innovation in product offerings and distribution strategies. The focus on sustainable feed production and the incorporation of advanced technologies in animal feed manufacturing are likely to shape the future landscape of the APAC feed amino acids market.
APAC Feed Amino Acids Industry Company Market Share
APAC Feed Amino Acids Industry: Market Analysis & Forecast 2019-2033
This comprehensive report delivers an in-depth analysis of the Asia-Pacific (APAC) feed amino acids market, providing crucial insights for industry professionals, investors, and strategic planners. Spanning the period 2019-2033, with a focus on 2025, this report unveils the market's dynamics, growth trends, and key players, offering a roadmap for future success. The report segments the market by animal type (Aquaculture, Other Ruminants, Swine, Other Animals), amino acid type (Lysine, Methionine, Threonine, Tryptophan, Other Amino Acids), and country (Australia, China, India, Indonesia, Japan, Philippines, South Korea, Thailand, Vietnam, Rest of Asia-Pacific), presenting a granular view of this vital sector. Market values are presented in Million units.
APAC Feed Amino Acids Industry Market Dynamics & Structure
The APAC feed amino acids market exhibits a moderately consolidated structure, with several major global players and regional players competing for market share. Technological innovation, particularly in production efficiency and sustainable feed solutions, is a key driver, while stringent regulatory frameworks concerning feed safety and environmental impact influence market dynamics. The market faces competition from alternative feed additives and is subject to fluctuations in raw material prices and feed demand. M&A activity is significant, reflecting industry consolidation and the pursuit of technological advantages.
- Market Concentration: Moderately consolidated, with top 5 players holding approximately xx% market share in 2024.
- Technological Innovation: Focus on improving production efficiency, reducing environmental impact, and developing novel amino acid formulations.
- Regulatory Framework: Stringent regulations concerning feed safety and environmental sustainability are impacting market dynamics.
- Competitive Substitutes: Plant-based protein sources and other feed additives pose competition.
- End-User Demographics: Growth driven by increasing demand from intensive livestock and aquaculture farming.
- M&A Trends: Significant M&A activity observed in recent years, driven by strategic expansion and technological acquisition. Total deal volume in 2024 estimated at xx Million USD.
APAC Feed Amino Acids Industry Growth Trends & Insights
The APAC feed amino acids market experienced robust growth during the historical period (2019-2024), driven primarily by rising demand from the rapidly expanding livestock and aquaculture sectors. The increasing adoption of intensive farming practices and growing consumer demand for animal protein in developing economies contribute to the market's expansion. Technological advancements are streamlining production processes and enhancing product efficacy, creating further growth opportunities. This growth is expected to continue in the forecast period (2025-2033), albeit at a potentially moderating rate compared to the historical period. The CAGR for the forecast period is projected at xx%. Market penetration in key segments like Swine and Aquaculture is expected to increase significantly. The rise of digital solutions for optimizing feed usage and reducing environmental impact is also a notable trend. The market size is estimated at xx Million units in 2025 and is forecast to reach xx Million units by 2033.
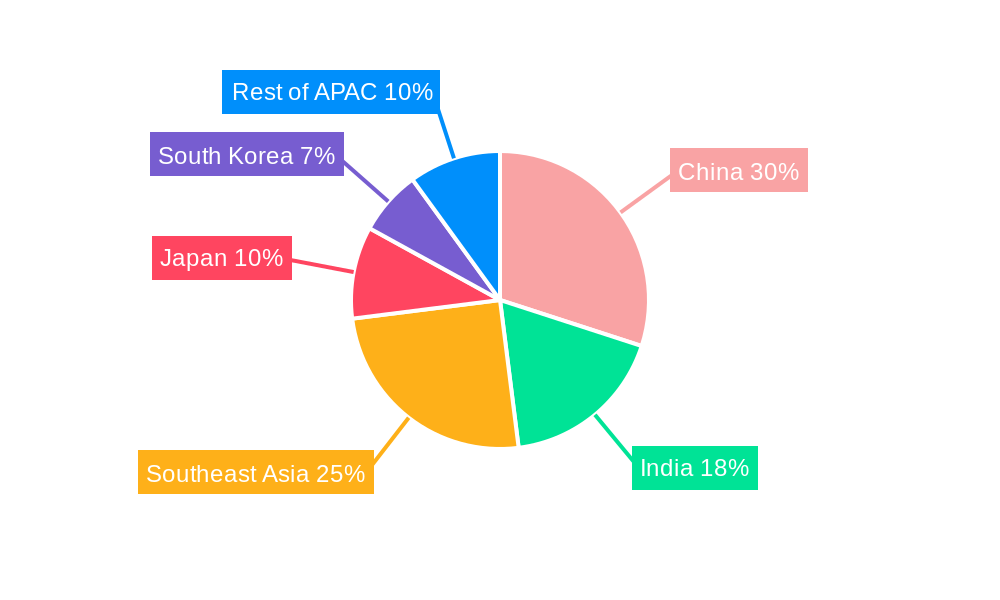
Dominant Regions, Countries, or Segments in APAC Feed Amino Acids Industry
China dominates the APAC feed amino acids market, owing to its massive livestock and aquaculture sectors and strong economic growth. India and other Southeast Asian nations also exhibit significant growth potential due to expanding animal farming activities. Within the animal segments, Swine and Aquaculture are the major contributors, driven by high demand for pork and seafood. Lysine and Methionine constitute the largest portion of the amino acid market.
- Key Drivers in China: Government support for agricultural modernization, large-scale livestock farms, and increasing consumer demand for meat.
- Growth Potential in Southeast Asia: Rapid economic development, rising incomes, and increasing demand for protein-rich diets.
- Dominant Segments: Swine and Aquaculture dominate due to high feed amino acid requirements.
- Leading Amino Acids: Lysine and Methionine hold the largest market share.
APAC Feed Amino Acids Industry Product Landscape
The APAC feed amino acids market is characterized by a diverse range of products, including crystalline and liquid amino acids, each tailored to specific animal species and dietary needs. Ongoing innovation focuses on improving amino acid bioavailability, palatability, and efficacy. Unique selling propositions include customized formulations, precise nutrient profiles, and environmentally sustainable production processes. Technological advancements in fermentation and purification are driving cost efficiency and production capacity.
Key Drivers, Barriers & Challenges in APAP Feed Amino Acids Industry
Key Drivers:
- Increasing demand for animal protein from a growing population.
- Growing adoption of intensive animal farming practices.
- Technological advancements improving amino acid production and efficiency.
- Government support for livestock and aquaculture development in several APAC countries.
Challenges and Restraints:
- Fluctuations in raw material prices (e.g., corn, soybean meal) impact production costs.
- Stringent regulations and environmental concerns associated with feed production.
- Intense competition from both established and emerging players.
- Supply chain disruptions can affect product availability and pricing. Estimated impact in 2024: xx% increase in prices.
Emerging Opportunities in APAC Feed Amino Acids Industry
- Growth in the aquaculture sector presents significant opportunities for specialized amino acid formulations.
- Increasing focus on sustainable feed production methods is creating demand for eco-friendly amino acids.
- The development of novel amino acid blends for enhanced animal health and performance opens new avenues for innovation.
- Expansion into untapped markets in less-developed APAC nations.
Growth Accelerators in the APAC Feed Amino Acids Industry
Technological advancements in fermentation and production processes are boosting efficiency and reducing costs. Strategic partnerships and collaborations between producers and feed manufacturers are facilitating market penetration and product development. The focus on sustainable feed production and the integration of precision feeding technologies are further accelerating market growth.
Key Players Shaping the APAC Feed Amino Acids Industry Market
Notable Milestones in APAC Feed Amino Acids Industry Sector
- September 2022: Adisseo starts production at its new 180,000-ton liquid methionine plant in Nanjing, China.
- October 2022: Evonik and BASF partnership grants Evonik licensing rights to OpteinicsTM digital solution.
- January 2023: Novus International acquires Agrivida to develop new feed additives.
In-Depth APAC Feed Amino Acids Industry Market Outlook
The APAC feed amino acids market is poised for sustained growth driven by increasing demand for animal protein, technological innovation, and strategic investments. Opportunities lie in catering to the specific needs of various animal segments, developing sustainable solutions, and expanding into less-penetrated markets. Companies that can effectively leverage technological advancements, adapt to evolving regulations, and establish robust supply chains are well-positioned to capitalize on the long-term growth potential.
APAC Feed Amino Acids Industry Segmentation
-
1. Sub Additive
- 1.1. Lysine
- 1.2. Methionine
- 1.3. Threonine
- 1.4. Tryptophan
- 1.5. Other Amino Acids
-
2. Animal
-
2.1. Aquaculture
-
2.1.1. By Sub Animal
- 2.1.1.1. Fish
- 2.1.1.2. Shrimp
- 2.1.1.3. Other Aquaculture Species
-
2.1.1. By Sub Animal
-
2.2. Poultry
- 2.2.1. Broiler
- 2.2.2. Layer
- 2.2.3. Other Poultry Birds
-
2.3. Ruminants
- 2.3.1. Beef Cattle
- 2.3.2. Dairy Cattle
- 2.3.3. Other Ruminants
- 2.4. Swine
- 2.5. Other Animals
-
2.1. Aquaculture
APAC Feed Amino Acids Industry Segmentation By Geography
-
1. North America
- 1.1. United States
- 1.2. Canada
- 1.3. Mexico
-
2. South America
- 2.1. Brazil
- 2.2. Argentina
- 2.3. Rest of South America
-
3. Europe
- 3.1. United Kingdom
- 3.2. Germany
- 3.3. France
- 3.4. Italy
- 3.5. Spain
- 3.6. Russia
- 3.7. Benelux
- 3.8. Nordics
- 3.9. Rest of Europe
-
4. Middle East & Africa
- 4.1. Turkey
- 4.2. Israel
- 4.3. GCC
- 4.4. North Africa
- 4.5. South Africa
- 4.6. Rest of Middle East & Africa
-
5. Asia Pacific
- 5.1. China
- 5.2. India
- 5.3. Japan
- 5.4. South Korea
- 5.5. ASEAN
- 5.6. Oceania
- 5.7. Rest of Asia Pacific
APAC Feed Amino Acids Industry Regional Market Share
Geographic Coverage of APAC Feed Amino Acids Industry
APAC Feed Amino Acids Industry REPORT HIGHLIGHTS
| Aspects | Details |
|---|---|
| Study Period | 2020-2034 |
| Base Year | 2025 |
| Estimated Year | 2026 |
| Forecast Period | 2026-2034 |
| Historical Period | 2020-2025 |
| Growth Rate | CAGR of 8.2% from 2020-2034 |
| Segmentation |
|
Table of Contents
- 1. Introduction
- 1.1. Research Scope
- 1.2. Market Segmentation
- 1.3. Research Objective
- 1.4. Definitions and Assumptions
- 2. Executive Summary
- 2.1. Market Snapshot
- 3. Market Dynamics
- 3.1. Market Drivers
- 3.2. Market Restrains
- 3.3. Market Trends
- 3.4. Market Opportunities
- 4. Market Factor Analysis
- 4.1. Porters Five Forces
- 4.1.1. Bargaining Power of Suppliers
- 4.1.2. Bargaining Power of Buyers
- 4.1.3. Threat of New Entrants
- 4.1.4. Threat of Substitutes
- 4.1.5. Competitive Rivalry
- 4.2. PESTEL analysis
- 4.3. BCG Analysis
- 4.3.1. Stars (High Growth, High Market Share)
- 4.3.2. Cash Cows (Low Growth, High Market Share)
- 4.3.3. Question Mark (High Growth, Low Market Share)
- 4.3.4. Dogs (Low Growth, Low Market Share)
- 4.4. Ansoff Matrix Analysis
- 4.5. Supply Chain Analysis
- 4.6. Regulatory Landscape
- 4.7. Current Market Potential and Opportunity Assessment (TAM–SAM–SOM Framework)
- 4.8. IMR Analyst Note
- 4.1. Porters Five Forces
- 5. Market Analysis, Insights and Forecast 2021-2033
- 5.1. Market Analysis, Insights and Forecast - by Sub Additive
- 5.1.1. Lysine
- 5.1.2. Methionine
- 5.1.3. Threonine
- 5.1.4. Tryptophan
- 5.1.5. Other Amino Acids
- 5.2. Market Analysis, Insights and Forecast - by Animal
- 5.2.1. Aquaculture
- 5.2.1.1. By Sub Animal
- 5.2.1.1.1. Fish
- 5.2.1.1.2. Shrimp
- 5.2.1.1.3. Other Aquaculture Species
- 5.2.1.1. By Sub Animal
- 5.2.2. Poultry
- 5.2.2.1. Broiler
- 5.2.2.2. Layer
- 5.2.2.3. Other Poultry Birds
- 5.2.3. Ruminants
- 5.2.3.1. Beef Cattle
- 5.2.3.2. Dairy Cattle
- 5.2.3.3. Other Ruminants
- 5.2.4. Swine
- 5.2.5. Other Animals
- 5.2.1. Aquaculture
- 5.3. Market Analysis, Insights and Forecast - by Region
- 5.3.1. North America
- 5.3.2. South America
- 5.3.3. Europe
- 5.3.4. Middle East & Africa
- 5.3.5. Asia Pacific
- 5.1. Market Analysis, Insights and Forecast - by Sub Additive
- 6. Global APAC Feed Amino Acids Industry Analysis, Insights and Forecast, 2021-2033
- 6.1. Market Analysis, Insights and Forecast - by Sub Additive
- 6.1.1. Lysine
- 6.1.2. Methionine
- 6.1.3. Threonine
- 6.1.4. Tryptophan
- 6.1.5. Other Amino Acids
- 6.2. Market Analysis, Insights and Forecast - by Animal
- 6.2.1. Aquaculture
- 6.2.1.1. By Sub Animal
- 6.2.1.1.1. Fish
- 6.2.1.1.2. Shrimp
- 6.2.1.1.3. Other Aquaculture Species
- 6.2.1.1. By Sub Animal
- 6.2.2. Poultry
- 6.2.2.1. Broiler
- 6.2.2.2. Layer
- 6.2.2.3. Other Poultry Birds
- 6.2.3. Ruminants
- 6.2.3.1. Beef Cattle
- 6.2.3.2. Dairy Cattle
- 6.2.3.3. Other Ruminants
- 6.2.4. Swine
- 6.2.5. Other Animals
- 6.2.1. Aquaculture
- 6.1. Market Analysis, Insights and Forecast - by Sub Additive
- 7. North America APAC Feed Amino Acids Industry Analysis, Insights and Forecast, 2020-2032
- 7.1. Market Analysis, Insights and Forecast - by Sub Additive
- 7.1.1. Lysine
- 7.1.2. Methionine
- 7.1.3. Threonine
- 7.1.4. Tryptophan
- 7.1.5. Other Amino Acids
- 7.2. Market Analysis, Insights and Forecast - by Animal
- 7.2.1. Aquaculture
- 7.2.1.1. By Sub Animal
- 7.2.1.1.1. Fish
- 7.2.1.1.2. Shrimp
- 7.2.1.1.3. Other Aquaculture Species
- 7.2.1.1. By Sub Animal
- 7.2.2. Poultry
- 7.2.2.1. Broiler
- 7.2.2.2. Layer
- 7.2.2.3. Other Poultry Birds
- 7.2.3. Ruminants
- 7.2.3.1. Beef Cattle
- 7.2.3.2. Dairy Cattle
- 7.2.3.3. Other Ruminants
- 7.2.4. Swine
- 7.2.5. Other Animals
- 7.2.1. Aquaculture
- 7.1. Market Analysis, Insights and Forecast - by Sub Additive
- 8. South America APAC Feed Amino Acids Industry Analysis, Insights and Forecast, 2020-2032
- 8.1. Market Analysis, Insights and Forecast - by Sub Additive
- 8.1.1. Lysine
- 8.1.2. Methionine
- 8.1.3. Threonine
- 8.1.4. Tryptophan
- 8.1.5. Other Amino Acids
- 8.2. Market Analysis, Insights and Forecast - by Animal
- 8.2.1. Aquaculture
- 8.2.1.1. By Sub Animal
- 8.2.1.1.1. Fish
- 8.2.1.1.2. Shrimp
- 8.2.1.1.3. Other Aquaculture Species
- 8.2.1.1. By Sub Animal
- 8.2.2. Poultry
- 8.2.2.1. Broiler
- 8.2.2.2. Layer
- 8.2.2.3. Other Poultry Birds
- 8.2.3. Ruminants
- 8.2.3.1. Beef Cattle
- 8.2.3.2. Dairy Cattle
- 8.2.3.3. Other Ruminants
- 8.2.4. Swine
- 8.2.5. Other Animals
- 8.2.1. Aquaculture
- 8.1. Market Analysis, Insights and Forecast - by Sub Additive
- 9. Europe APAC Feed Amino Acids Industry Analysis, Insights and Forecast, 2020-2032
- 9.1. Market Analysis, Insights and Forecast - by Sub Additive
- 9.1.1. Lysine
- 9.1.2. Methionine
- 9.1.3. Threonine
- 9.1.4. Tryptophan
- 9.1.5. Other Amino Acids
- 9.2. Market Analysis, Insights and Forecast - by Animal
- 9.2.1. Aquaculture
- 9.2.1.1. By Sub Animal
- 9.2.1.1.1. Fish
- 9.2.1.1.2. Shrimp
- 9.2.1.1.3. Other Aquaculture Species
- 9.2.1.1. By Sub Animal
- 9.2.2. Poultry
- 9.2.2.1. Broiler
- 9.2.2.2. Layer
- 9.2.2.3. Other Poultry Birds
- 9.2.3. Ruminants
- 9.2.3.1. Beef Cattle
- 9.2.3.2. Dairy Cattle
- 9.2.3.3. Other Ruminants
- 9.2.4. Swine
- 9.2.5. Other Animals
- 9.2.1. Aquaculture
- 9.1. Market Analysis, Insights and Forecast - by Sub Additive
- 10. Middle East & Africa APAC Feed Amino Acids Industry Analysis, Insights and Forecast, 2020-2032
- 10.1. Market Analysis, Insights and Forecast - by Sub Additive
- 10.1.1. Lysine
- 10.1.2. Methionine
- 10.1.3. Threonine
- 10.1.4. Tryptophan
- 10.1.5. Other Amino Acids
- 10.2. Market Analysis, Insights and Forecast - by Animal
- 10.2.1. Aquaculture
- 10.2.1.1. By Sub Animal
- 10.2.1.1.1. Fish
- 10.2.1.1.2. Shrimp
- 10.2.1.1.3. Other Aquaculture Species
- 10.2.1.1. By Sub Animal
- 10.2.2. Poultry
- 10.2.2.1. Broiler
- 10.2.2.2. Layer
- 10.2.2.3. Other Poultry Birds
- 10.2.3. Ruminants
- 10.2.3.1. Beef Cattle
- 10.2.3.2. Dairy Cattle
- 10.2.3.3. Other Ruminants
- 10.2.4. Swine
- 10.2.5. Other Animals
- 10.2.1. Aquaculture
- 10.1. Market Analysis, Insights and Forecast - by Sub Additive
- 11. Asia Pacific APAC Feed Amino Acids Industry Analysis, Insights and Forecast, 2020-2032
- 11.1. Market Analysis, Insights and Forecast - by Sub Additive
- 11.1.1. Lysine
- 11.1.2. Methionine
- 11.1.3. Threonine
- 11.1.4. Tryptophan
- 11.1.5. Other Amino Acids
- 11.2. Market Analysis, Insights and Forecast - by Animal
- 11.2.1. Aquaculture
- 11.2.1.1. By Sub Animal
- 11.2.1.1.1. Fish
- 11.2.1.1.2. Shrimp
- 11.2.1.1.3. Other Aquaculture Species
- 11.2.1.1. By Sub Animal
- 11.2.2. Poultry
- 11.2.2.1. Broiler
- 11.2.2.2. Layer
- 11.2.2.3. Other Poultry Birds
- 11.2.3. Ruminants
- 11.2.3.1. Beef Cattle
- 11.2.3.2. Dairy Cattle
- 11.2.3.3. Other Ruminants
- 11.2.4. Swine
- 11.2.5. Other Animals
- 11.2.1. Aquaculture
- 11.1. Market Analysis, Insights and Forecast - by Sub Additive
- 12. Competitive Analysis
- 12.1. Company Profiles
- 12.1.1 Prinova Group LLC
- 12.1.1.1. Company Overview
- 12.1.1.2. Products
- 12.1.1.3. Company Financials
- 12.1.1.4. SWOT Analysis
- 12.1.2 Novus International Inc
- 12.1.2.1. Company Overview
- 12.1.2.2. Products
- 12.1.2.3. Company Financials
- 12.1.2.4. SWOT Analysis
- 12.1.3 Kemin Industries
- 12.1.3.1. Company Overview
- 12.1.3.2. Products
- 12.1.3.3. Company Financials
- 12.1.3.4. SWOT Analysis
- 12.1.4 Evonik Industries AG
- 12.1.4.1. Company Overview
- 12.1.4.2. Products
- 12.1.4.3. Company Financials
- 12.1.4.4. SWOT Analysis
- 12.1.5 SHV (Nutreco NV
- 12.1.5.1. Company Overview
- 12.1.5.2. Products
- 12.1.5.3. Company Financials
- 12.1.5.4. SWOT Analysis
- 12.1.6 Ajinomoto Co Inc
- 12.1.6.1. Company Overview
- 12.1.6.2. Products
- 12.1.6.3. Company Financials
- 12.1.6.4. SWOT Analysis
- 12.1.7 Archer Daniel Midland Co
- 12.1.7.1. Company Overview
- 12.1.7.2. Products
- 12.1.7.3. Company Financials
- 12.1.7.4. SWOT Analysis
- 12.1.8 Lonza Group Ltd
- 12.1.8.1. Company Overview
- 12.1.8.2. Products
- 12.1.8.3. Company Financials
- 12.1.8.4. SWOT Analysis
- 12.1.9 Alltech Inc
- 12.1.9.1. Company Overview
- 12.1.9.2. Products
- 12.1.9.3. Company Financials
- 12.1.9.4. SWOT Analysis
- 12.1.10 Adisseo
- 12.1.10.1. Company Overview
- 12.1.10.2. Products
- 12.1.10.3. Company Financials
- 12.1.10.4. SWOT Analysis
- 12.1.1 Prinova Group LLC
- 12.2. Market Entropy
- 12.2.1 Company's Key Areas Served
- 12.2.2 Recent Developments
- 12.3. Company Market Share Analysis 2025
- 12.3.1 Top 5 Companies Market Share Analysis
- 12.3.2 Top 3 Companies Market Share Analysis
- 12.4. List of Potential Customers
- 13. Research Methodology
List of Figures
- Figure 1: Global APAC Feed Amino Acids Industry Revenue Breakdown (million, %) by Region 2025 & 2033
- Figure 2: North America APAC Feed Amino Acids Industry Revenue (million), by Sub Additive 2025 & 2033
- Figure 3: North America APAC Feed Amino Acids Industry Revenue Share (%), by Sub Additive 2025 & 2033
- Figure 4: North America APAC Feed Amino Acids Industry Revenue (million), by Animal 2025 & 2033
- Figure 5: North America APAC Feed Amino Acids Industry Revenue Share (%), by Animal 2025 & 2033
- Figure 6: North America APAC Feed Amino Acids Industry Revenue (million), by Country 2025 & 2033
- Figure 7: North America APAC Feed Amino Acids Industry Revenue Share (%), by Country 2025 & 2033
- Figure 8: South America APAC Feed Amino Acids Industry Revenue (million), by Sub Additive 2025 & 2033
- Figure 9: South America APAC Feed Amino Acids Industry Revenue Share (%), by Sub Additive 2025 & 2033
- Figure 10: South America APAC Feed Amino Acids Industry Revenue (million), by Animal 2025 & 2033
- Figure 11: South America APAC Feed Amino Acids Industry Revenue Share (%), by Animal 2025 & 2033
- Figure 12: South America APAC Feed Amino Acids Industry Revenue (million), by Country 2025 & 2033
- Figure 13: South America APAC Feed Amino Acids Industry Revenue Share (%), by Country 2025 & 2033
- Figure 14: Europe APAC Feed Amino Acids Industry Revenue (million), by Sub Additive 2025 & 2033
- Figure 15: Europe APAC Feed Amino Acids Industry Revenue Share (%), by Sub Additive 2025 & 2033
- Figure 16: Europe APAC Feed Amino Acids Industry Revenue (million), by Animal 2025 & 2033
- Figure 17: Europe APAC Feed Amino Acids Industry Revenue Share (%), by Animal 2025 & 2033
- Figure 18: Europe APAC Feed Amino Acids Industry Revenue (million), by Country 2025 & 2033
- Figure 19: Europe APAC Feed Amino Acids Industry Revenue Share (%), by Country 2025 & 2033
- Figure 20: Middle East & Africa APAC Feed Amino Acids Industry Revenue (million), by Sub Additive 2025 & 2033
- Figure 21: Middle East & Africa APAC Feed Amino Acids Industry Revenue Share (%), by Sub Additive 2025 & 2033
- Figure 22: Middle East & Africa APAC Feed Amino Acids Industry Revenue (million), by Animal 2025 & 2033
- Figure 23: Middle East & Africa APAC Feed Amino Acids Industry Revenue Share (%), by Animal 2025 & 2033
- Figure 24: Middle East & Africa APAC Feed Amino Acids Industry Revenue (million), by Country 2025 & 2033
- Figure 25: Middle East & Africa APAC Feed Amino Acids Industry Revenue Share (%), by Country 2025 & 2033
- Figure 26: Asia Pacific APAC Feed Amino Acids Industry Revenue (million), by Sub Additive 2025 & 2033
- Figure 27: Asia Pacific APAC Feed Amino Acids Industry Revenue Share (%), by Sub Additive 2025 & 2033
- Figure 28: Asia Pacific APAC Feed Amino Acids Industry Revenue (million), by Animal 2025 & 2033
- Figure 29: Asia Pacific APAC Feed Amino Acids Industry Revenue Share (%), by Animal 2025 & 2033
- Figure 30: Asia Pacific APAC Feed Amino Acids Industry Revenue (million), by Country 2025 & 2033
- Figure 31: Asia Pacific APAC Feed Amino Acids Industry Revenue Share (%), by Country 2025 & 2033
List of Tables
- Table 1: Global APAC Feed Amino Acids Industry Revenue million Forecast, by Sub Additive 2020 & 2033
- Table 2: Global APAC Feed Amino Acids Industry Revenue million Forecast, by Animal 2020 & 2033
- Table 3: Global APAC Feed Amino Acids Industry Revenue million Forecast, by Region 2020 & 2033
- Table 4: Global APAC Feed Amino Acids Industry Revenue million Forecast, by Sub Additive 2020 & 2033
- Table 5: Global APAC Feed Amino Acids Industry Revenue million Forecast, by Animal 2020 & 2033
- Table 6: Global APAC Feed Amino Acids Industry Revenue million Forecast, by Country 2020 & 2033
- Table 7: United States APAC Feed Amino Acids Industry Revenue (million) Forecast, by Application 2020 & 2033
- Table 8: Canada APAC Feed Amino Acids Industry Revenue (million) Forecast, by Application 2020 & 2033
- Table 9: Mexico APAC Feed Amino Acids Industry Revenue (million) Forecast, by Application 2020 & 2033
- Table 10: Global APAC Feed Amino Acids Industry Revenue million Forecast, by Sub Additive 2020 & 2033
- Table 11: Global APAC Feed Amino Acids Industry Revenue million Forecast, by Animal 2020 & 2033
- Table 12: Global APAC Feed Amino Acids Industry Revenue million Forecast, by Country 2020 & 2033
- Table 13: Brazil APAC Feed Amino Acids Industry Revenue (million) Forecast, by Application 2020 & 2033
- Table 14: Argentina APAC Feed Amino Acids Industry Revenue (million) Forecast, by Application 2020 & 2033
- Table 15: Rest of South America APAC Feed Amino Acids Industry Revenue (million) Forecast, by Application 2020 & 2033
- Table 16: Global APAC Feed Amino Acids Industry Revenue million Forecast, by Sub Additive 2020 & 2033
- Table 17: Global APAC Feed Amino Acids Industry Revenue million Forecast, by Animal 2020 & 2033
- Table 18: Global APAC Feed Amino Acids Industry Revenue million Forecast, by Country 2020 & 2033
- Table 19: United Kingdom APAC Feed Amino Acids Industry Revenue (million) Forecast, by Application 2020 & 2033
- Table 20: Germany APAC Feed Amino Acids Industry Revenue (million) Forecast, by Application 2020 & 2033
- Table 21: France APAC Feed Amino Acids Industry Revenue (million) Forecast, by Application 2020 & 2033
- Table 22: Italy APAC Feed Amino Acids Industry Revenue (million) Forecast, by Application 2020 & 2033
- Table 23: Spain APAC Feed Amino Acids Industry Revenue (million) Forecast, by Application 2020 & 2033
- Table 24: Russia APAC Feed Amino Acids Industry Revenue (million) Forecast, by Application 2020 & 2033
- Table 25: Benelux APAC Feed Amino Acids Industry Revenue (million) Forecast, by Application 2020 & 2033
- Table 26: Nordics APAC Feed Amino Acids Industry Revenue (million) Forecast, by Application 2020 & 2033
- Table 27: Rest of Europe APAC Feed Amino Acids Industry Revenue (million) Forecast, by Application 2020 & 2033
- Table 28: Global APAC Feed Amino Acids Industry Revenue million Forecast, by Sub Additive 2020 & 2033
- Table 29: Global APAC Feed Amino Acids Industry Revenue million Forecast, by Animal 2020 & 2033
- Table 30: Global APAC Feed Amino Acids Industry Revenue million Forecast, by Country 2020 & 2033
- Table 31: Turkey APAC Feed Amino Acids Industry Revenue (million) Forecast, by Application 2020 & 2033
- Table 32: Israel APAC Feed Amino Acids Industry Revenue (million) Forecast, by Application 2020 & 2033
- Table 33: GCC APAC Feed Amino Acids Industry Revenue (million) Forecast, by Application 2020 & 2033
- Table 34: North Africa APAC Feed Amino Acids Industry Revenue (million) Forecast, by Application 2020 & 2033
- Table 35: South Africa APAC Feed Amino Acids Industry Revenue (million) Forecast, by Application 2020 & 2033
- Table 36: Rest of Middle East & Africa APAC Feed Amino Acids Industry Revenue (million) Forecast, by Application 2020 & 2033
- Table 37: Global APAC Feed Amino Acids Industry Revenue million Forecast, by Sub Additive 2020 & 2033
- Table 38: Global APAC Feed Amino Acids Industry Revenue million Forecast, by Animal 2020 & 2033
- Table 39: Global APAC Feed Amino Acids Industry Revenue million Forecast, by Country 2020 & 2033
- Table 40: China APAC Feed Amino Acids Industry Revenue (million) Forecast, by Application 2020 & 2033
- Table 41: India APAC Feed Amino Acids Industry Revenue (million) Forecast, by Application 2020 & 2033
- Table 42: Japan APAC Feed Amino Acids Industry Revenue (million) Forecast, by Application 2020 & 2033
- Table 43: South Korea APAC Feed Amino Acids Industry Revenue (million) Forecast, by Application 2020 & 2033
- Table 44: ASEAN APAC Feed Amino Acids Industry Revenue (million) Forecast, by Application 2020 & 2033
- Table 45: Oceania APAC Feed Amino Acids Industry Revenue (million) Forecast, by Application 2020 & 2033
- Table 46: Rest of Asia Pacific APAC Feed Amino Acids Industry Revenue (million) Forecast, by Application 2020 & 2033
Frequently Asked Questions
1. What is the projected Compound Annual Growth Rate (CAGR) of the APAC Feed Amino Acids Industry?
The projected CAGR is approximately 8.2%.
2. Which companies are prominent players in the APAC Feed Amino Acids Industry?
Key companies in the market include Prinova Group LLC, Novus International Inc, Kemin Industries, Evonik Industries AG, SHV (Nutreco NV, Ajinomoto Co Inc, Archer Daniel Midland Co, Lonza Group Ltd, Alltech Inc, Adisseo.
3. What are the main segments of the APAC Feed Amino Acids Industry?
The market segments include Sub Additive, Animal.
4. Can you provide details about the market size?
The market size is estimated to be USD 13783.2 million as of 2022.
5. What are some drivers contributing to market growth?
Growing Livestock Population; Area Under Forage Production is Increasing; Increasing Demand for Animal Products.
6. What are the notable trends driving market growth?
OTHER KEY INDUSTRY TRENDS COVERED IN THE REPORT.
7. Are there any restraints impacting market growth?
Competition Amongst Industries and High Input Prices; Growing Shift Toward Vegan-Based Diet.
8. Can you provide examples of recent developments in the market?
January 2023: Novus International acquired the Biotech company Agrivida to develop new feed additives.October 2022: The partnership between Evonik and BASF allowed Evonik certain non-exclusive licensing rights to OpteinicsTM, a digital solution to improve comprehension and reduce the environmental impact of the animal protein and feed industries.September 2022: The new 180,000-ton liquid methionine plant of Adisseo in Nanjing, China, started production. The facility is one of the largest global liquid methionine production capacities that boosted the penetration of liquid methionine manufactured by the company in the global market.
9. What pricing options are available for accessing the report?
Pricing options include single-user, multi-user, and enterprise licenses priced at USD 3800, USD 4500, and USD 5800 respectively.
10. Is the market size provided in terms of value or volume?
The market size is provided in terms of value, measured in million.
11. Are there any specific market keywords associated with the report?
Yes, the market keyword associated with the report is "APAC Feed Amino Acids Industry," which aids in identifying and referencing the specific market segment covered.
12. How do I determine which pricing option suits my needs best?
The pricing options vary based on user requirements and access needs. Individual users may opt for single-user licenses, while businesses requiring broader access may choose multi-user or enterprise licenses for cost-effective access to the report.
13. Are there any additional resources or data provided in the APAC Feed Amino Acids Industry report?
While the report offers comprehensive insights, it's advisable to review the specific contents or supplementary materials provided to ascertain if additional resources or data are available.
14. How can I stay updated on further developments or reports in the APAC Feed Amino Acids Industry?
To stay informed about further developments, trends, and reports in the APAC Feed Amino Acids Industry, consider subscribing to industry newsletters, following relevant companies and organizations, or regularly checking reputable industry news sources and publications.
Methodology
Step 1 - Identification of Relevant Samples Size from Population Database


Step 2 - Approaches for Defining Global Market Size (Value, Volume* & Price*)

Note*: In applicable scenarios
Step 3 - Data Sources
Primary Research
- Web Analytics
- Survey Reports
- Research Institute
- Latest Research Reports
- Opinion Leaders
Secondary Research
- Annual Reports
- White Paper
- Latest Press Release
- Industry Association
- Paid Database
- Investor Presentations

Step 4 - Data Triangulation
Involves using different sources of information in order to increase the validity of a study
These sources are likely to be stakeholders in a program - participants, other researchers, program staff, other community members, and so on.
Then we put all data in single framework & apply various statistical tools to find out the dynamic on the market.
During the analysis stage, feedback from the stakeholder groups would be compared to determine areas of agreement as well as areas of divergence