

Key Insights
The global Man-made Vascular Graft market is poised for significant expansion, projected to reach an estimated $4.0 billion in 2025. This growth trajectory is underpinned by a robust Compound Annual Growth Rate (CAGR) of 6.9% expected over the forecast period of 2025-2033. The escalating prevalence of cardiovascular diseases, coupled with an aging global population, serves as a primary catalyst for this market's expansion. As degenerative vascular conditions become more commonplace, the demand for effective and reliable vascular grafts for bypass surgeries and treating aneurysms and occlusions continues to surge. Technological advancements in graft materials, such as enhanced bio-compatibility and improved mechanical properties of ePTFE and polyester grafts, are further driving innovation and adoption within the sector. Key players like Getinge, Bard PV, and Terumo are actively investing in research and development to introduce next-generation vascular grafts that offer superior patient outcomes and minimize complications, thereby shaping the competitive landscape and catering to the evolving clinical needs.
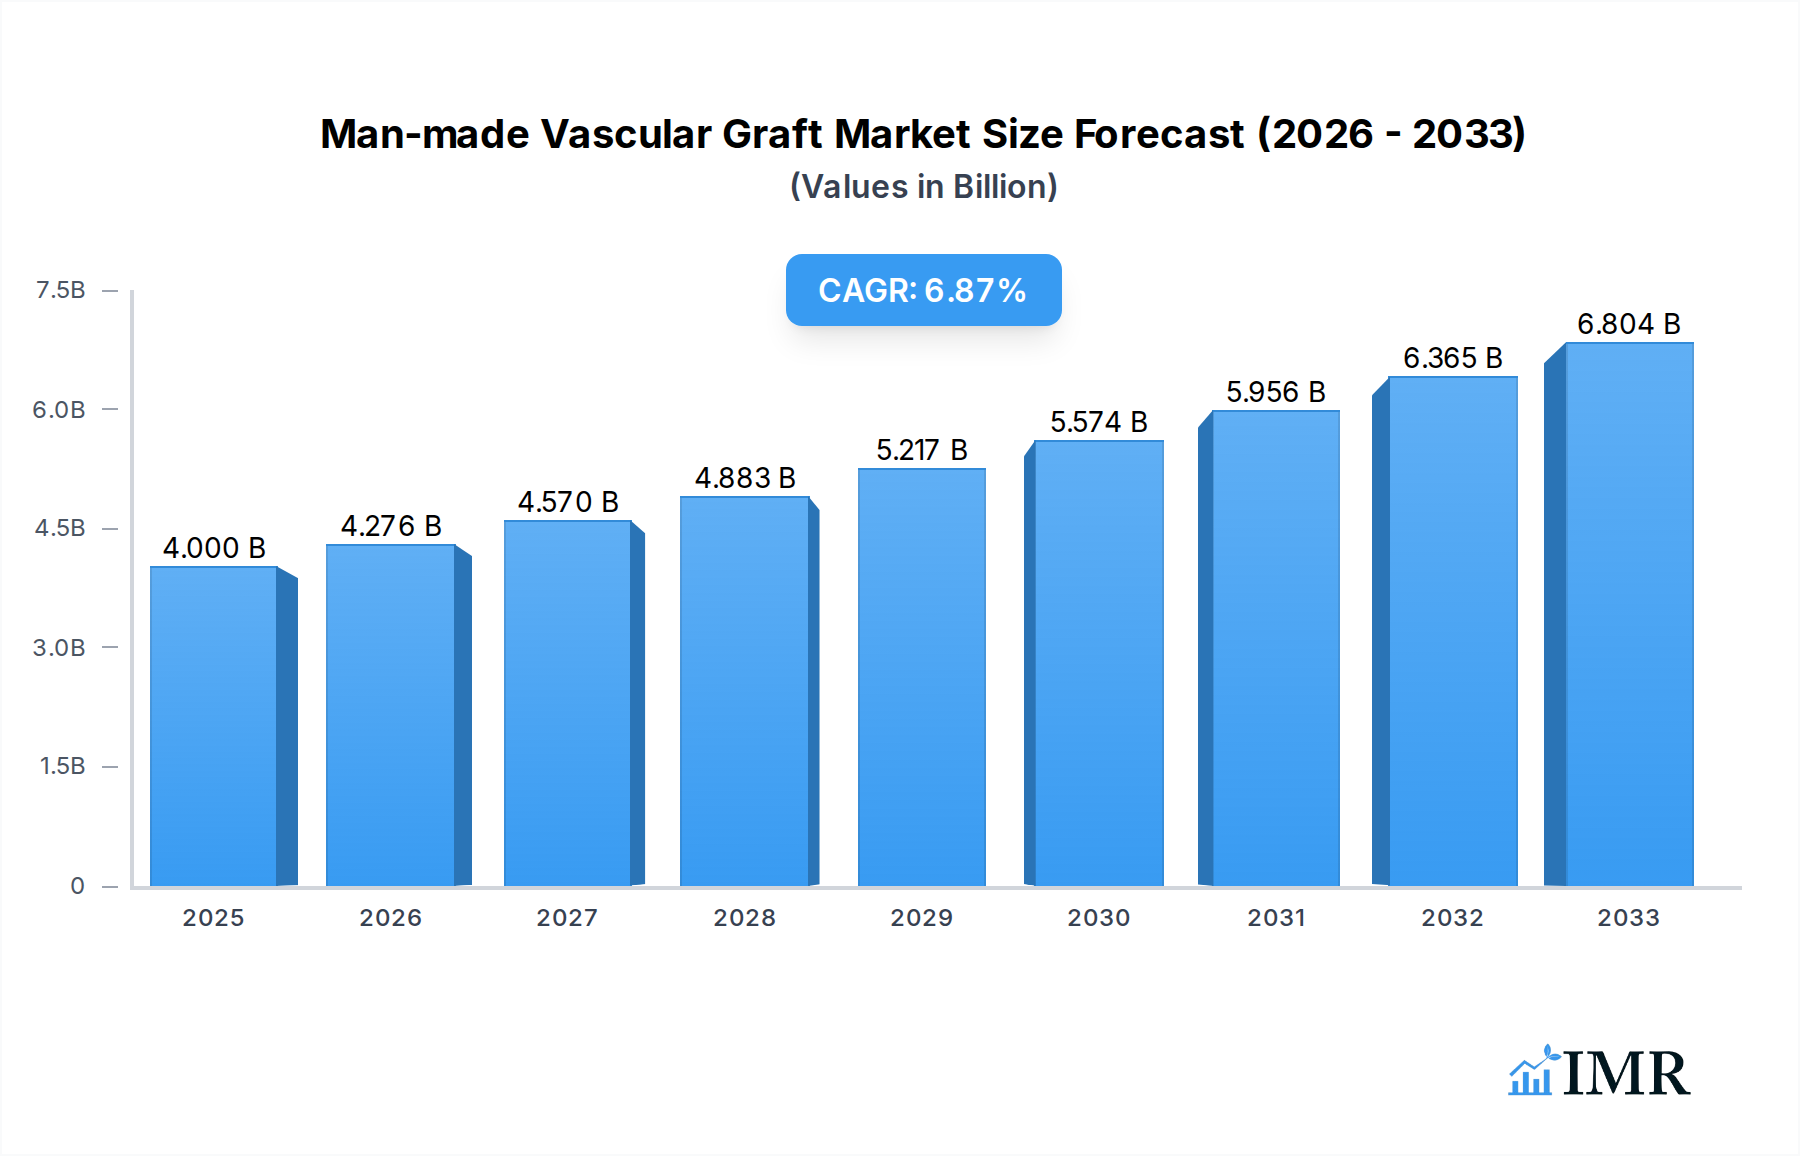
Man-made Vascular Graft Market Size (In Billion)
Furthermore, the market's growth is influenced by a dynamic interplay of driving forces and restraining factors. Increasing healthcare expenditure globally, particularly in emerging economies, is creating a more favorable environment for advanced medical devices like man-made vascular grafts. The rising incidence of lifestyle-related diseases such as diabetes and hypertension, which significantly contribute to vascular complications, also fuels the demand. However, challenges such as the high cost of advanced graft materials and surgical procedures, alongside stringent regulatory approvals for new medical devices, present hurdles to widespread market penetration. Despite these restraints, the continuous drive for minimally invasive surgical techniques and the development of innovative graft designs are expected to mitigate these challenges and sustain the market's upward momentum. The market segmentation by application, with cardiovascular diseases leading the charge, and by type, highlighting the dominance of ePTFE and polyester grafts, further illustrates the specialized and critical role these devices play in modern healthcare.

Man-made Vascular Graft Company Market Share
Man-made Vascular Graft Market Analysis and Forecast: 2019–2033
This comprehensive report offers an in-depth analysis of the global man-made vascular graft market, a critical segment within the broader medical devices industry. We provide granular insights into market dynamics, growth trends, regional dominance, product innovations, key drivers, emerging opportunities, and the competitive landscape. The report utilizes a robust study period from 2019 to 2033, with a base year of 2025, offering both historical context and future projections. This analysis is crucial for industry professionals, investors, and stakeholders seeking to understand and capitalize on the evolving man-made vascular graft market.
Man-made Vascular Graft Market Dynamics & Structure
The global man-made vascular graft market exhibits a moderate concentration, with established players like Getinge, Bard PV, Terumo, W. L. Gore, and B. Braun holding significant market share. Technological innovation remains a key driver, fueled by advancements in biomaterials, stent-graft technology, and minimally invasive surgical techniques. Regulatory frameworks, particularly stringent FDA and EMA approvals, shape product development and market entry. Competitive product substitutes, while present, are largely limited to autologous grafts for specific applications, highlighting the indispensable role of synthetic grafts. End-user demographics are characterized by an aging global population with a rising prevalence of cardiovascular diseases and peripheral vascular occlusions. Merger and acquisition (M&A) trends are anticipated to continue, as larger companies seek to consolidate their market position and acquire innovative technologies.
- Market Concentration: Moderate, with a few key players dominating.
- Technological Innovation Drivers: Biomaterial advancements, stent-graft technology, minimally invasive techniques.
- Regulatory Frameworks: Stringent FDA and EMA approvals influencing market entry.
- Competitive Product Substitutes: Limited, primarily autologous grafts.
- End-User Demographics: Aging population, rising prevalence of cardiovascular diseases.
- M&A Trends: Expected to continue for market consolidation and technology acquisition.
Man-made Vascular Graft Growth Trends & Insights
The man-made vascular graft market is poised for robust growth, driven by an escalating global burden of cardiovascular diseases and peripheral vascular occlusions. The market size is projected to witness a Compound Annual Growth Rate (CAGR) of approximately 6.5% over the forecast period, reaching an estimated XX billion by 2033. Adoption rates of advanced vascular grafts, particularly bioabsorbable and drug-eluting variants, are accelerating due to improved patient outcomes and reduced complication rates. Technological disruptions, including the integration of nanotechnology for enhanced biocompatibility and the development of patient-specific graft designs, are transforming the landscape. Consumer behavior shifts are also evident, with increasing patient awareness of treatment options and a preference for less invasive procedures. The historical period (2019–2024) saw steady growth, laying the foundation for the projected expansion, with key market penetration for ePTFE grafts in cardiovascular applications. The estimated market size in 2025 is XX billion, with significant contributions from the cardiovascular diseases segment.
Dominant Regions, Countries, or Segments in Man-made Vascular Graft
North America, particularly the United States, currently dominates the global man-made vascular graft market, driven by its advanced healthcare infrastructure, high prevalence of cardiovascular diseases, and substantial healthcare expenditure. The Cardiovascular Diseases application segment consistently remains the largest revenue generator, followed by Aneurysm repair. Within the types of grafts, the ePTFE Man-made Vascular Graft segment holds the leading market share due to its proven efficacy and versatility in various vascular reconstructions.
Dominant Region: North America (especially the USA).
- Drivers: Advanced healthcare infrastructure, high CVD prevalence, significant healthcare spending.
- Market Share: Estimated at 35% of the global market in 2025.
- Growth Potential: Steady growth driven by technological advancements and an aging population.
Dominant Application: Cardiovascular Diseases.
- Drivers: Increasing incidence of coronary artery disease, peripheral artery disease, and heart failure.
- Market Size Contribution: Expected to contribute XX billion in 2025.
- Growth Potential: Sustained demand due to the chronic nature of these conditions.
Dominant Type: ePTFE Man-made Vascular Graft.
- Drivers: Excellent biocompatibility, durability, and suitability for bypass surgeries.
- Market Share: Estimated at 45% of the graft types market in 2025.
- Growth Potential: Continued demand, with innovation focusing on improved thrombogenicity.
Man-made Vascular Graft Product Landscape
The product landscape of man-made vascular grafts is characterized by continuous innovation aimed at enhancing biocompatibility, reducing thrombogenicity, and improving long-term patency rates. Key advancements include the development of bifurcated grafts for complex aortic repairs, drug-eluting grafts to prevent restenosis, and bioengineered grafts incorporating cellular components for improved healing. ePTFE and Polyester grafts remain the workhorses, but emerging materials and designs are gaining traction. For instance, W. L. Gore's GORE-TEX vascular grafts are renowned for their durability, while Terumo's offerings focus on minimally invasive solutions.
Key Drivers, Barriers & Challenges in Man-made Vascular Graft
The man-made vascular graft market is propelled by several key drivers. The escalating global prevalence of cardiovascular diseases and diabetes, leading to increased instances of peripheral artery disease and aneurysms, forms a primary growth catalyst. Advancements in surgical techniques, including endovascular procedures, are expanding the applicability of vascular grafts. Furthermore, an aging global population with a higher propensity for vascular complications fuels demand.
Conversely, the market faces significant barriers and challenges. High manufacturing costs for sophisticated grafts can limit accessibility, especially in developing economies. Stringent regulatory approval processes, while ensuring safety, can also delay market entry for new innovations. Moreover, the risk of complications such as infection, thrombosis, and pseudoaneurysm formation necessitates ongoing research and development to improve graft performance and patient outcomes. Supply chain vulnerabilities and the availability of skilled surgical professionals are also critical considerations.
Emerging Opportunities in Man-made Vascular Graft
Emerging opportunities in the man-made vascular graft sector lie in the development of advanced bioengineered and regenerative grafts that promote native tissue integration, minimizing the risk of rejection and long-term complications. The growing demand for minimally invasive surgical solutions presents a significant avenue for growth, particularly in the realm of endovascular grafts. Untapped markets in emerging economies with a rising middle class and increasing access to healthcare also represent substantial potential. Innovations in personalized medicine, where grafts are tailored to individual patient anatomy and disease characteristics, are also on the horizon.
Growth Accelerators in the Man-made Vascular Graft Industry
Long-term growth in the man-made vascular graft industry is expected to be significantly accelerated by breakthrough technological advancements in biomaterials science, leading to grafts with superior biocompatibility and reduced immunogenicity. Strategic partnerships between leading medical device manufacturers and research institutions are crucial for fostering innovation and expediting the translation of laboratory discoveries into clinical applications. Furthermore, market expansion strategies targeting underserved populations and developing regions, coupled with increasing government initiatives to improve cardiovascular care, will play a pivotal role in sustaining and amplifying growth trajectories.
Key Players Shaping the Man-made Vascular Graft Market
- Getinge
- Bard PV
- Terumo
- W. L. Gore
- Junkne Medical
- B.Braun
- LeMaitre Vascular
- Suokang
- Chest Medical
- Segments
Notable Milestones in Man-made Vascular Graft Sector
- 2019: Introduction of novel drug-eluting vascular grafts to combat restenosis.
- 2020: Significant advancements in bioabsorbable vascular graft materials enabling better tissue integration.
- 2021: Increased adoption of fenestrated and branched endografts for complex aortic pathologies.
- 2022: Development of patient-specific vascular graft designs utilizing 3D printing technology.
- 2023: Emergence of advanced nanoparticle coatings for enhanced anti-thrombotic properties.
- 2024: Increased focus on sustainable manufacturing processes for vascular grafts.
In-Depth Man-made Vascular Graft Market Outlook
The future outlook for the man-made vascular graft market is exceptionally promising, driven by a confluence of factors that promise sustained growth and transformative innovation. The increasing burden of lifestyle-related diseases globally, coupled with the demographic shift towards an older population, will continue to fuel demand for effective vascular reconstruction solutions. Key growth accelerators include ongoing breakthroughs in regenerative medicine, leading to the development of grafts that actively promote tissue regeneration and integration, thereby minimizing complications and enhancing long-term outcomes. Strategic collaborations between academic institutions and industry leaders will accelerate the translation of cutting-edge research into commercially viable products. Furthermore, market expansion into underserved geographies, supported by favorable healthcare policies and a growing awareness of advanced treatment options, will unlock significant untapped potential, ensuring a dynamic and expanding global market.
Man-made Vascular Graft Segmentation
-
1. Application
- 1.1. Cardiovascular Diseases
- 1.2. Aneurysm
- 1.3. Vascular Occlusion
- 1.4. Others
-
2. Types
- 2.1. ePTFE Man-made Vascular Graft
- 2.2. Polyester Man-made Vascular Graft
- 2.3. PTFE Man-made Vascular Graft
- 2.4. Others
Man-made Vascular Graft Segmentation By Geography
-
1. North America
- 1.1. United States
- 1.2. Canada
- 1.3. Mexico
-
2. South America
- 2.1. Brazil
- 2.2. Argentina
- 2.3. Rest of South America
-
3. Europe
- 3.1. United Kingdom
- 3.2. Germany
- 3.3. France
- 3.4. Italy
- 3.5. Spain
- 3.6. Russia
- 3.7. Benelux
- 3.8. Nordics
- 3.9. Rest of Europe
-
4. Middle East & Africa
- 4.1. Turkey
- 4.2. Israel
- 4.3. GCC
- 4.4. North Africa
- 4.5. South Africa
- 4.6. Rest of Middle East & Africa
-
5. Asia Pacific
- 5.1. China
- 5.2. India
- 5.3. Japan
- 5.4. South Korea
- 5.5. ASEAN
- 5.6. Oceania
- 5.7. Rest of Asia Pacific
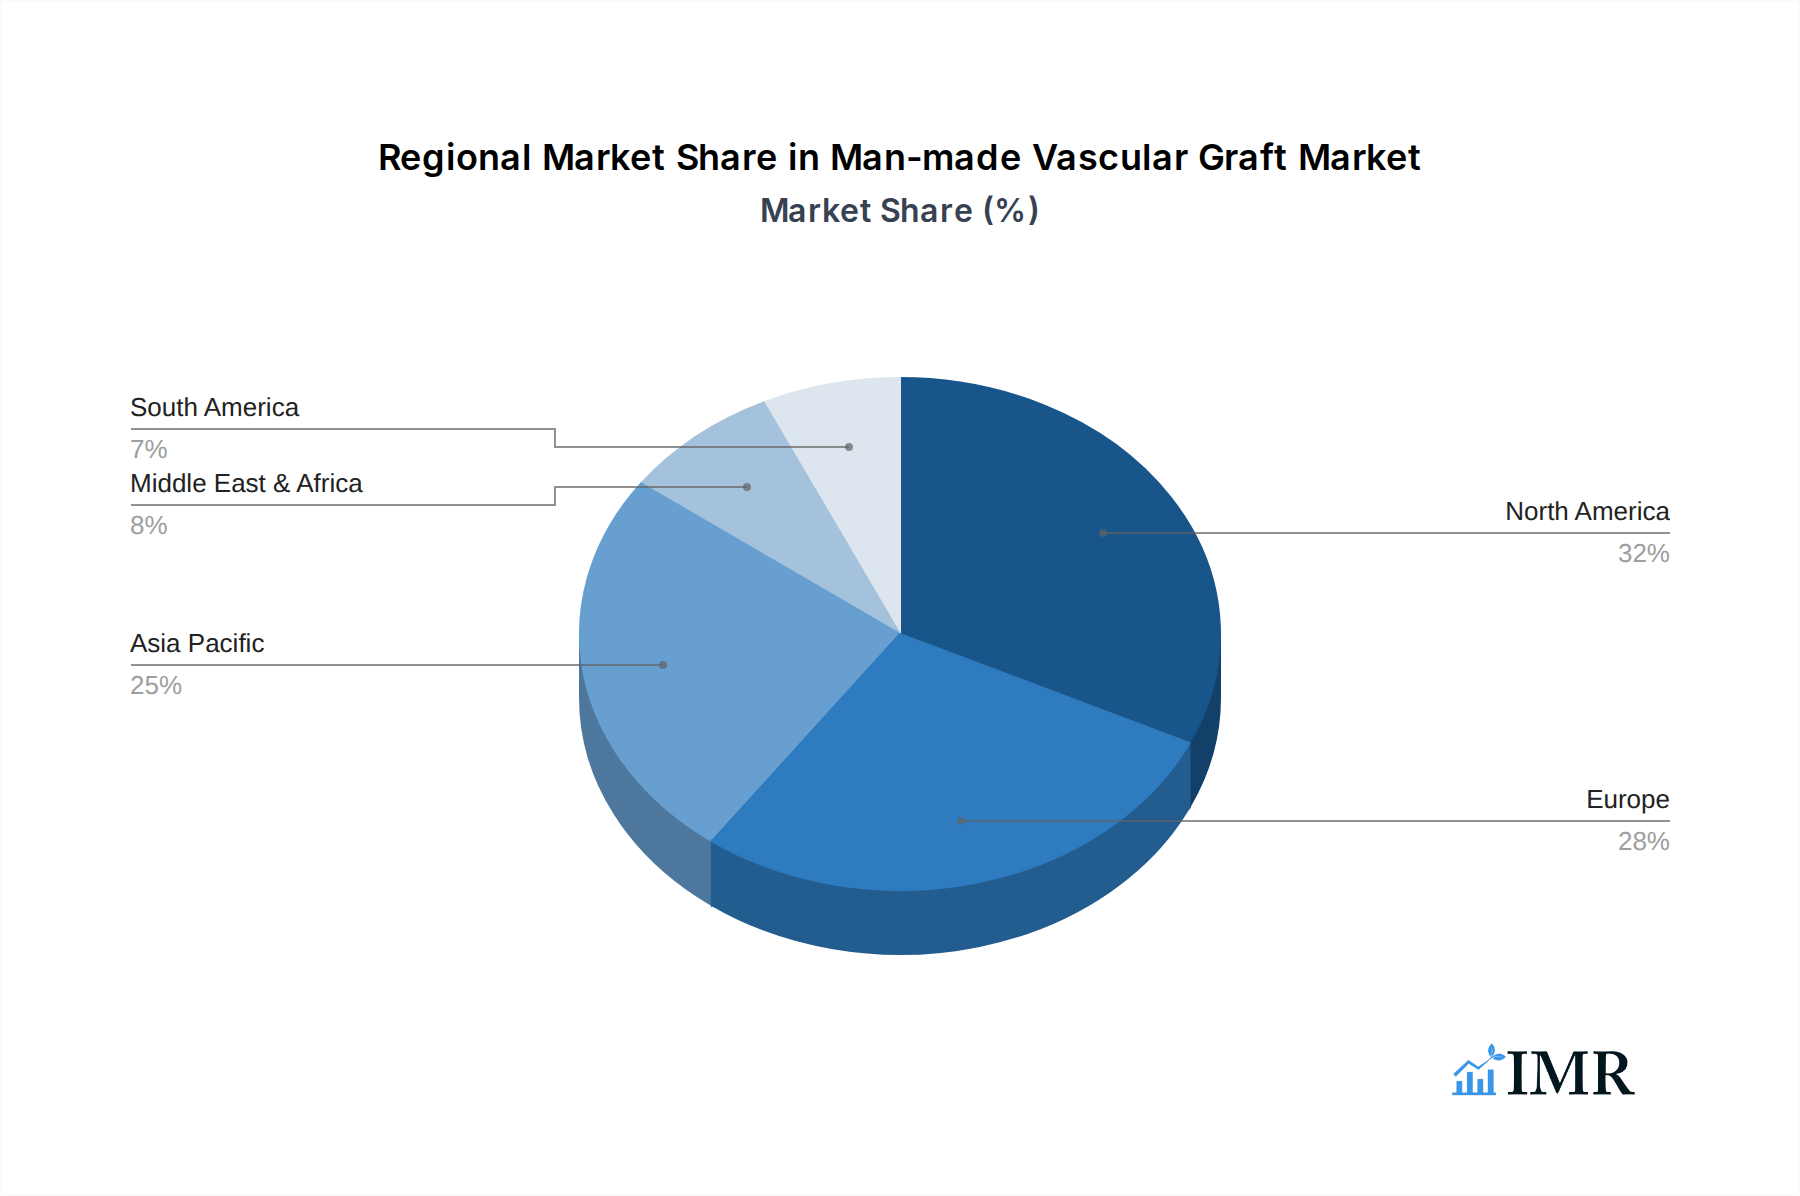
Man-made Vascular Graft Regional Market Share
Geographic Coverage of Man-made Vascular Graft
Man-made Vascular Graft REPORT HIGHLIGHTS
| Aspects | Details |
|---|---|
| Study Period | 2020-2034 |
| Base Year | 2025 |
| Estimated Year | 2026 |
| Forecast Period | 2026-2034 |
| Historical Period | 2020-2025 |
| Growth Rate | CAGR of 6.9% from 2020-2034 |
| Segmentation |
|
Table of Contents
- 1. Introduction
- 1.1. Research Scope
- 1.2. Market Segmentation
- 1.3. Research Objective
- 1.4. Definitions and Assumptions
- 2. Executive Summary
- 2.1. Market Snapshot
- 3. Market Dynamics
- 3.1. Market Drivers
- 3.2. Market Restrains
- 3.3. Market Trends
- 3.4. Market Opportunities
- 4. Market Factor Analysis
- 4.1. Porters Five Forces
- 4.1.1. Bargaining Power of Suppliers
- 4.1.2. Bargaining Power of Buyers
- 4.1.3. Threat of New Entrants
- 4.1.4. Threat of Substitutes
- 4.1.5. Competitive Rivalry
- 4.2. PESTEL analysis
- 4.3. BCG Analysis
- 4.3.1. Stars (High Growth, High Market Share)
- 4.3.2. Cash Cows (Low Growth, High Market Share)
- 4.3.3. Question Mark (High Growth, Low Market Share)
- 4.3.4. Dogs (Low Growth, Low Market Share)
- 4.4. Ansoff Matrix Analysis
- 4.5. Supply Chain Analysis
- 4.6. Regulatory Landscape
- 4.7. Current Market Potential and Opportunity Assessment (TAM–SAM–SOM Framework)
- 4.8. IMR Analyst Note
- 4.1. Porters Five Forces
- 5. Market Analysis, Insights and Forecast 2021-2033
- 5.1. Market Analysis, Insights and Forecast - by Application
- 5.1.1. Cardiovascular Diseases
- 5.1.2. Aneurysm
- 5.1.3. Vascular Occlusion
- 5.1.4. Others
- 5.2. Market Analysis, Insights and Forecast - by Types
- 5.2.1. ePTFE Man-made Vascular Graft
- 5.2.2. Polyester Man-made Vascular Graft
- 5.2.3. PTFE Man-made Vascular Graft
- 5.2.4. Others
- 5.3. Market Analysis, Insights and Forecast - by Region
- 5.3.1. North America
- 5.3.2. South America
- 5.3.3. Europe
- 5.3.4. Middle East & Africa
- 5.3.5. Asia Pacific
- 5.1. Market Analysis, Insights and Forecast - by Application
- 6. Global Man-made Vascular Graft Analysis, Insights and Forecast, 2021-2033
- 6.1. Market Analysis, Insights and Forecast - by Application
- 6.1.1. Cardiovascular Diseases
- 6.1.2. Aneurysm
- 6.1.3. Vascular Occlusion
- 6.1.4. Others
- 6.2. Market Analysis, Insights and Forecast - by Types
- 6.2.1. ePTFE Man-made Vascular Graft
- 6.2.2. Polyester Man-made Vascular Graft
- 6.2.3. PTFE Man-made Vascular Graft
- 6.2.4. Others
- 6.1. Market Analysis, Insights and Forecast - by Application
- 7. North America Man-made Vascular Graft Analysis, Insights and Forecast, 2020-2032
- 7.1. Market Analysis, Insights and Forecast - by Application
- 7.1.1. Cardiovascular Diseases
- 7.1.2. Aneurysm
- 7.1.3. Vascular Occlusion
- 7.1.4. Others
- 7.2. Market Analysis, Insights and Forecast - by Types
- 7.2.1. ePTFE Man-made Vascular Graft
- 7.2.2. Polyester Man-made Vascular Graft
- 7.2.3. PTFE Man-made Vascular Graft
- 7.2.4. Others
- 7.1. Market Analysis, Insights and Forecast - by Application
- 8. South America Man-made Vascular Graft Analysis, Insights and Forecast, 2020-2032
- 8.1. Market Analysis, Insights and Forecast - by Application
- 8.1.1. Cardiovascular Diseases
- 8.1.2. Aneurysm
- 8.1.3. Vascular Occlusion
- 8.1.4. Others
- 8.2. Market Analysis, Insights and Forecast - by Types
- 8.2.1. ePTFE Man-made Vascular Graft
- 8.2.2. Polyester Man-made Vascular Graft
- 8.2.3. PTFE Man-made Vascular Graft
- 8.2.4. Others
- 8.1. Market Analysis, Insights and Forecast - by Application
- 9. Europe Man-made Vascular Graft Analysis, Insights and Forecast, 2020-2032
- 9.1. Market Analysis, Insights and Forecast - by Application
- 9.1.1. Cardiovascular Diseases
- 9.1.2. Aneurysm
- 9.1.3. Vascular Occlusion
- 9.1.4. Others
- 9.2. Market Analysis, Insights and Forecast - by Types
- 9.2.1. ePTFE Man-made Vascular Graft
- 9.2.2. Polyester Man-made Vascular Graft
- 9.2.3. PTFE Man-made Vascular Graft
- 9.2.4. Others
- 9.1. Market Analysis, Insights and Forecast - by Application
- 10. Middle East & Africa Man-made Vascular Graft Analysis, Insights and Forecast, 2020-2032
- 10.1. Market Analysis, Insights and Forecast - by Application
- 10.1.1. Cardiovascular Diseases
- 10.1.2. Aneurysm
- 10.1.3. Vascular Occlusion
- 10.1.4. Others
- 10.2. Market Analysis, Insights and Forecast - by Types
- 10.2.1. ePTFE Man-made Vascular Graft
- 10.2.2. Polyester Man-made Vascular Graft
- 10.2.3. PTFE Man-made Vascular Graft
- 10.2.4. Others
- 10.1. Market Analysis, Insights and Forecast - by Application
- 11. Asia Pacific Man-made Vascular Graft Analysis, Insights and Forecast, 2020-2032
- 11.1. Market Analysis, Insights and Forecast - by Application
- 11.1.1. Cardiovascular Diseases
- 11.1.2. Aneurysm
- 11.1.3. Vascular Occlusion
- 11.1.4. Others
- 11.2. Market Analysis, Insights and Forecast - by Types
- 11.2.1. ePTFE Man-made Vascular Graft
- 11.2.2. Polyester Man-made Vascular Graft
- 11.2.3. PTFE Man-made Vascular Graft
- 11.2.4. Others
- 11.1. Market Analysis, Insights and Forecast - by Application
- 12. Competitive Analysis
- 12.1. Company Profiles
- 12.1.1 Getinge
- 12.1.1.1. Company Overview
- 12.1.1.2. Products
- 12.1.1.3. Company Financials
- 12.1.1.4. SWOT Analysis
- 12.1.2 Bard PV
- 12.1.2.1. Company Overview
- 12.1.2.2. Products
- 12.1.2.3. Company Financials
- 12.1.2.4. SWOT Analysis
- 12.1.3 Terumo
- 12.1.3.1. Company Overview
- 12.1.3.2. Products
- 12.1.3.3. Company Financials
- 12.1.3.4. SWOT Analysis
- 12.1.4 W. L. Gore
- 12.1.4.1. Company Overview
- 12.1.4.2. Products
- 12.1.4.3. Company Financials
- 12.1.4.4. SWOT Analysis
- 12.1.5 Junkne Medical
- 12.1.5.1. Company Overview
- 12.1.5.2. Products
- 12.1.5.3. Company Financials
- 12.1.5.4. SWOT Analysis
- 12.1.6 B.Braun
- 12.1.6.1. Company Overview
- 12.1.6.2. Products
- 12.1.6.3. Company Financials
- 12.1.6.4. SWOT Analysis
- 12.1.7 LeMaitre Vascular
- 12.1.7.1. Company Overview
- 12.1.7.2. Products
- 12.1.7.3. Company Financials
- 12.1.7.4. SWOT Analysis
- 12.1.8 Suokang
- 12.1.8.1. Company Overview
- 12.1.8.2. Products
- 12.1.8.3. Company Financials
- 12.1.8.4. SWOT Analysis
- 12.1.9 Chest Medical
- 12.1.9.1. Company Overview
- 12.1.9.2. Products
- 12.1.9.3. Company Financials
- 12.1.9.4. SWOT Analysis
- 12.1.1 Getinge
- 12.2. Market Entropy
- 12.2.1 Company's Key Areas Served
- 12.2.2 Recent Developments
- 12.3. Company Market Share Analysis 2025
- 12.3.1 Top 5 Companies Market Share Analysis
- 12.3.2 Top 3 Companies Market Share Analysis
- 12.4. List of Potential Customers
- 13. Research Methodology
List of Figures
- Figure 1: Global Man-made Vascular Graft Revenue Breakdown (undefined, %) by Region 2025 & 2033
- Figure 2: Global Man-made Vascular Graft Volume Breakdown (K, %) by Region 2025 & 2033
- Figure 3: North America Man-made Vascular Graft Revenue (undefined), by Application 2025 & 2033
- Figure 4: North America Man-made Vascular Graft Volume (K), by Application 2025 & 2033
- Figure 5: North America Man-made Vascular Graft Revenue Share (%), by Application 2025 & 2033
- Figure 6: North America Man-made Vascular Graft Volume Share (%), by Application 2025 & 2033
- Figure 7: North America Man-made Vascular Graft Revenue (undefined), by Types 2025 & 2033
- Figure 8: North America Man-made Vascular Graft Volume (K), by Types 2025 & 2033
- Figure 9: North America Man-made Vascular Graft Revenue Share (%), by Types 2025 & 2033
- Figure 10: North America Man-made Vascular Graft Volume Share (%), by Types 2025 & 2033
- Figure 11: North America Man-made Vascular Graft Revenue (undefined), by Country 2025 & 2033
- Figure 12: North America Man-made Vascular Graft Volume (K), by Country 2025 & 2033
- Figure 13: North America Man-made Vascular Graft Revenue Share (%), by Country 2025 & 2033
- Figure 14: North America Man-made Vascular Graft Volume Share (%), by Country 2025 & 2033
- Figure 15: South America Man-made Vascular Graft Revenue (undefined), by Application 2025 & 2033
- Figure 16: South America Man-made Vascular Graft Volume (K), by Application 2025 & 2033
- Figure 17: South America Man-made Vascular Graft Revenue Share (%), by Application 2025 & 2033
- Figure 18: South America Man-made Vascular Graft Volume Share (%), by Application 2025 & 2033
- Figure 19: South America Man-made Vascular Graft Revenue (undefined), by Types 2025 & 2033
- Figure 20: South America Man-made Vascular Graft Volume (K), by Types 2025 & 2033
- Figure 21: South America Man-made Vascular Graft Revenue Share (%), by Types 2025 & 2033
- Figure 22: South America Man-made Vascular Graft Volume Share (%), by Types 2025 & 2033
- Figure 23: South America Man-made Vascular Graft Revenue (undefined), by Country 2025 & 2033
- Figure 24: South America Man-made Vascular Graft Volume (K), by Country 2025 & 2033
- Figure 25: South America Man-made Vascular Graft Revenue Share (%), by Country 2025 & 2033
- Figure 26: South America Man-made Vascular Graft Volume Share (%), by Country 2025 & 2033
- Figure 27: Europe Man-made Vascular Graft Revenue (undefined), by Application 2025 & 2033
- Figure 28: Europe Man-made Vascular Graft Volume (K), by Application 2025 & 2033
- Figure 29: Europe Man-made Vascular Graft Revenue Share (%), by Application 2025 & 2033
- Figure 30: Europe Man-made Vascular Graft Volume Share (%), by Application 2025 & 2033
- Figure 31: Europe Man-made Vascular Graft Revenue (undefined), by Types 2025 & 2033
- Figure 32: Europe Man-made Vascular Graft Volume (K), by Types 2025 & 2033
- Figure 33: Europe Man-made Vascular Graft Revenue Share (%), by Types 2025 & 2033
- Figure 34: Europe Man-made Vascular Graft Volume Share (%), by Types 2025 & 2033
- Figure 35: Europe Man-made Vascular Graft Revenue (undefined), by Country 2025 & 2033
- Figure 36: Europe Man-made Vascular Graft Volume (K), by Country 2025 & 2033
- Figure 37: Europe Man-made Vascular Graft Revenue Share (%), by Country 2025 & 2033
- Figure 38: Europe Man-made Vascular Graft Volume Share (%), by Country 2025 & 2033
- Figure 39: Middle East & Africa Man-made Vascular Graft Revenue (undefined), by Application 2025 & 2033
- Figure 40: Middle East & Africa Man-made Vascular Graft Volume (K), by Application 2025 & 2033
- Figure 41: Middle East & Africa Man-made Vascular Graft Revenue Share (%), by Application 2025 & 2033
- Figure 42: Middle East & Africa Man-made Vascular Graft Volume Share (%), by Application 2025 & 2033
- Figure 43: Middle East & Africa Man-made Vascular Graft Revenue (undefined), by Types 2025 & 2033
- Figure 44: Middle East & Africa Man-made Vascular Graft Volume (K), by Types 2025 & 2033
- Figure 45: Middle East & Africa Man-made Vascular Graft Revenue Share (%), by Types 2025 & 2033
- Figure 46: Middle East & Africa Man-made Vascular Graft Volume Share (%), by Types 2025 & 2033
- Figure 47: Middle East & Africa Man-made Vascular Graft Revenue (undefined), by Country 2025 & 2033
- Figure 48: Middle East & Africa Man-made Vascular Graft Volume (K), by Country 2025 & 2033
- Figure 49: Middle East & Africa Man-made Vascular Graft Revenue Share (%), by Country 2025 & 2033
- Figure 50: Middle East & Africa Man-made Vascular Graft Volume Share (%), by Country 2025 & 2033
- Figure 51: Asia Pacific Man-made Vascular Graft Revenue (undefined), by Application 2025 & 2033
- Figure 52: Asia Pacific Man-made Vascular Graft Volume (K), by Application 2025 & 2033
- Figure 53: Asia Pacific Man-made Vascular Graft Revenue Share (%), by Application 2025 & 2033
- Figure 54: Asia Pacific Man-made Vascular Graft Volume Share (%), by Application 2025 & 2033
- Figure 55: Asia Pacific Man-made Vascular Graft Revenue (undefined), by Types 2025 & 2033
- Figure 56: Asia Pacific Man-made Vascular Graft Volume (K), by Types 2025 & 2033
- Figure 57: Asia Pacific Man-made Vascular Graft Revenue Share (%), by Types 2025 & 2033
- Figure 58: Asia Pacific Man-made Vascular Graft Volume Share (%), by Types 2025 & 2033
- Figure 59: Asia Pacific Man-made Vascular Graft Revenue (undefined), by Country 2025 & 2033
- Figure 60: Asia Pacific Man-made Vascular Graft Volume (K), by Country 2025 & 2033
- Figure 61: Asia Pacific Man-made Vascular Graft Revenue Share (%), by Country 2025 & 2033
- Figure 62: Asia Pacific Man-made Vascular Graft Volume Share (%), by Country 2025 & 2033
List of Tables
- Table 1: Global Man-made Vascular Graft Revenue undefined Forecast, by Application 2020 & 2033
- Table 2: Global Man-made Vascular Graft Volume K Forecast, by Application 2020 & 2033
- Table 3: Global Man-made Vascular Graft Revenue undefined Forecast, by Types 2020 & 2033
- Table 4: Global Man-made Vascular Graft Volume K Forecast, by Types 2020 & 2033
- Table 5: Global Man-made Vascular Graft Revenue undefined Forecast, by Region 2020 & 2033
- Table 6: Global Man-made Vascular Graft Volume K Forecast, by Region 2020 & 2033
- Table 7: Global Man-made Vascular Graft Revenue undefined Forecast, by Application 2020 & 2033
- Table 8: Global Man-made Vascular Graft Volume K Forecast, by Application 2020 & 2033
- Table 9: Global Man-made Vascular Graft Revenue undefined Forecast, by Types 2020 & 2033
- Table 10: Global Man-made Vascular Graft Volume K Forecast, by Types 2020 & 2033
- Table 11: Global Man-made Vascular Graft Revenue undefined Forecast, by Country 2020 & 2033
- Table 12: Global Man-made Vascular Graft Volume K Forecast, by Country 2020 & 2033
- Table 13: United States Man-made Vascular Graft Revenue (undefined) Forecast, by Application 2020 & 2033
- Table 14: United States Man-made Vascular Graft Volume (K) Forecast, by Application 2020 & 2033
- Table 15: Canada Man-made Vascular Graft Revenue (undefined) Forecast, by Application 2020 & 2033
- Table 16: Canada Man-made Vascular Graft Volume (K) Forecast, by Application 2020 & 2033
- Table 17: Mexico Man-made Vascular Graft Revenue (undefined) Forecast, by Application 2020 & 2033
- Table 18: Mexico Man-made Vascular Graft Volume (K) Forecast, by Application 2020 & 2033
- Table 19: Global Man-made Vascular Graft Revenue undefined Forecast, by Application 2020 & 2033
- Table 20: Global Man-made Vascular Graft Volume K Forecast, by Application 2020 & 2033
- Table 21: Global Man-made Vascular Graft Revenue undefined Forecast, by Types 2020 & 2033
- Table 22: Global Man-made Vascular Graft Volume K Forecast, by Types 2020 & 2033
- Table 23: Global Man-made Vascular Graft Revenue undefined Forecast, by Country 2020 & 2033
- Table 24: Global Man-made Vascular Graft Volume K Forecast, by Country 2020 & 2033
- Table 25: Brazil Man-made Vascular Graft Revenue (undefined) Forecast, by Application 2020 & 2033
- Table 26: Brazil Man-made Vascular Graft Volume (K) Forecast, by Application 2020 & 2033
- Table 27: Argentina Man-made Vascular Graft Revenue (undefined) Forecast, by Application 2020 & 2033
- Table 28: Argentina Man-made Vascular Graft Volume (K) Forecast, by Application 2020 & 2033
- Table 29: Rest of South America Man-made Vascular Graft Revenue (undefined) Forecast, by Application 2020 & 2033
- Table 30: Rest of South America Man-made Vascular Graft Volume (K) Forecast, by Application 2020 & 2033
- Table 31: Global Man-made Vascular Graft Revenue undefined Forecast, by Application 2020 & 2033
- Table 32: Global Man-made Vascular Graft Volume K Forecast, by Application 2020 & 2033
- Table 33: Global Man-made Vascular Graft Revenue undefined Forecast, by Types 2020 & 2033
- Table 34: Global Man-made Vascular Graft Volume K Forecast, by Types 2020 & 2033
- Table 35: Global Man-made Vascular Graft Revenue undefined Forecast, by Country 2020 & 2033
- Table 36: Global Man-made Vascular Graft Volume K Forecast, by Country 2020 & 2033
- Table 37: United Kingdom Man-made Vascular Graft Revenue (undefined) Forecast, by Application 2020 & 2033
- Table 38: United Kingdom Man-made Vascular Graft Volume (K) Forecast, by Application 2020 & 2033
- Table 39: Germany Man-made Vascular Graft Revenue (undefined) Forecast, by Application 2020 & 2033
- Table 40: Germany Man-made Vascular Graft Volume (K) Forecast, by Application 2020 & 2033
- Table 41: France Man-made Vascular Graft Revenue (undefined) Forecast, by Application 2020 & 2033
- Table 42: France Man-made Vascular Graft Volume (K) Forecast, by Application 2020 & 2033
- Table 43: Italy Man-made Vascular Graft Revenue (undefined) Forecast, by Application 2020 & 2033
- Table 44: Italy Man-made Vascular Graft Volume (K) Forecast, by Application 2020 & 2033
- Table 45: Spain Man-made Vascular Graft Revenue (undefined) Forecast, by Application 2020 & 2033
- Table 46: Spain Man-made Vascular Graft Volume (K) Forecast, by Application 2020 & 2033
- Table 47: Russia Man-made Vascular Graft Revenue (undefined) Forecast, by Application 2020 & 2033
- Table 48: Russia Man-made Vascular Graft Volume (K) Forecast, by Application 2020 & 2033
- Table 49: Benelux Man-made Vascular Graft Revenue (undefined) Forecast, by Application 2020 & 2033
- Table 50: Benelux Man-made Vascular Graft Volume (K) Forecast, by Application 2020 & 2033
- Table 51: Nordics Man-made Vascular Graft Revenue (undefined) Forecast, by Application 2020 & 2033
- Table 52: Nordics Man-made Vascular Graft Volume (K) Forecast, by Application 2020 & 2033
- Table 53: Rest of Europe Man-made Vascular Graft Revenue (undefined) Forecast, by Application 2020 & 2033
- Table 54: Rest of Europe Man-made Vascular Graft Volume (K) Forecast, by Application 2020 & 2033
- Table 55: Global Man-made Vascular Graft Revenue undefined Forecast, by Application 2020 & 2033
- Table 56: Global Man-made Vascular Graft Volume K Forecast, by Application 2020 & 2033
- Table 57: Global Man-made Vascular Graft Revenue undefined Forecast, by Types 2020 & 2033
- Table 58: Global Man-made Vascular Graft Volume K Forecast, by Types 2020 & 2033
- Table 59: Global Man-made Vascular Graft Revenue undefined Forecast, by Country 2020 & 2033
- Table 60: Global Man-made Vascular Graft Volume K Forecast, by Country 2020 & 2033
- Table 61: Turkey Man-made Vascular Graft Revenue (undefined) Forecast, by Application 2020 & 2033
- Table 62: Turkey Man-made Vascular Graft Volume (K) Forecast, by Application 2020 & 2033
- Table 63: Israel Man-made Vascular Graft Revenue (undefined) Forecast, by Application 2020 & 2033
- Table 64: Israel Man-made Vascular Graft Volume (K) Forecast, by Application 2020 & 2033
- Table 65: GCC Man-made Vascular Graft Revenue (undefined) Forecast, by Application 2020 & 2033
- Table 66: GCC Man-made Vascular Graft Volume (K) Forecast, by Application 2020 & 2033
- Table 67: North Africa Man-made Vascular Graft Revenue (undefined) Forecast, by Application 2020 & 2033
- Table 68: North Africa Man-made Vascular Graft Volume (K) Forecast, by Application 2020 & 2033
- Table 69: South Africa Man-made Vascular Graft Revenue (undefined) Forecast, by Application 2020 & 2033
- Table 70: South Africa Man-made Vascular Graft Volume (K) Forecast, by Application 2020 & 2033
- Table 71: Rest of Middle East & Africa Man-made Vascular Graft Revenue (undefined) Forecast, by Application 2020 & 2033
- Table 72: Rest of Middle East & Africa Man-made Vascular Graft Volume (K) Forecast, by Application 2020 & 2033
- Table 73: Global Man-made Vascular Graft Revenue undefined Forecast, by Application 2020 & 2033
- Table 74: Global Man-made Vascular Graft Volume K Forecast, by Application 2020 & 2033
- Table 75: Global Man-made Vascular Graft Revenue undefined Forecast, by Types 2020 & 2033
- Table 76: Global Man-made Vascular Graft Volume K Forecast, by Types 2020 & 2033
- Table 77: Global Man-made Vascular Graft Revenue undefined Forecast, by Country 2020 & 2033
- Table 78: Global Man-made Vascular Graft Volume K Forecast, by Country 2020 & 2033
- Table 79: China Man-made Vascular Graft Revenue (undefined) Forecast, by Application 2020 & 2033
- Table 80: China Man-made Vascular Graft Volume (K) Forecast, by Application 2020 & 2033
- Table 81: India Man-made Vascular Graft Revenue (undefined) Forecast, by Application 2020 & 2033
- Table 82: India Man-made Vascular Graft Volume (K) Forecast, by Application 2020 & 2033
- Table 83: Japan Man-made Vascular Graft Revenue (undefined) Forecast, by Application 2020 & 2033
- Table 84: Japan Man-made Vascular Graft Volume (K) Forecast, by Application 2020 & 2033
- Table 85: South Korea Man-made Vascular Graft Revenue (undefined) Forecast, by Application 2020 & 2033
- Table 86: South Korea Man-made Vascular Graft Volume (K) Forecast, by Application 2020 & 2033
- Table 87: ASEAN Man-made Vascular Graft Revenue (undefined) Forecast, by Application 2020 & 2033
- Table 88: ASEAN Man-made Vascular Graft Volume (K) Forecast, by Application 2020 & 2033
- Table 89: Oceania Man-made Vascular Graft Revenue (undefined) Forecast, by Application 2020 & 2033
- Table 90: Oceania Man-made Vascular Graft Volume (K) Forecast, by Application 2020 & 2033
- Table 91: Rest of Asia Pacific Man-made Vascular Graft Revenue (undefined) Forecast, by Application 2020 & 2033
- Table 92: Rest of Asia Pacific Man-made Vascular Graft Volume (K) Forecast, by Application 2020 & 2033
Frequently Asked Questions
1. What is the projected Compound Annual Growth Rate (CAGR) of the Man-made Vascular Graft?
The projected CAGR is approximately 6.9%.
2. Which companies are prominent players in the Man-made Vascular Graft?
Key companies in the market include Getinge, Bard PV, Terumo, W. L. Gore, Junkne Medical, B.Braun, LeMaitre Vascular, Suokang, Chest Medical.
3. What are the main segments of the Man-made Vascular Graft?
The market segments include Application, Types.
4. Can you provide details about the market size?
The market size is estimated to be USD XXX N/A as of 2022.
5. What are some drivers contributing to market growth?
N/A
6. What are the notable trends driving market growth?
N/A
7. Are there any restraints impacting market growth?
N/A
8. Can you provide examples of recent developments in the market?
N/A
9. What pricing options are available for accessing the report?
Pricing options include single-user, multi-user, and enterprise licenses priced at USD 4000.00, USD 6000.00, and USD 8000.00 respectively.
10. Is the market size provided in terms of value or volume?
The market size is provided in terms of value, measured in N/A and volume, measured in K.
11. Are there any specific market keywords associated with the report?
Yes, the market keyword associated with the report is "Man-made Vascular Graft," which aids in identifying and referencing the specific market segment covered.
12. How do I determine which pricing option suits my needs best?
The pricing options vary based on user requirements and access needs. Individual users may opt for single-user licenses, while businesses requiring broader access may choose multi-user or enterprise licenses for cost-effective access to the report.
13. Are there any additional resources or data provided in the Man-made Vascular Graft report?
While the report offers comprehensive insights, it's advisable to review the specific contents or supplementary materials provided to ascertain if additional resources or data are available.
14. How can I stay updated on further developments or reports in the Man-made Vascular Graft?
To stay informed about further developments, trends, and reports in the Man-made Vascular Graft, consider subscribing to industry newsletters, following relevant companies and organizations, or regularly checking reputable industry news sources and publications.
Methodology
Step 1 - Identification of Relevant Samples Size from Population Database


Step 2 - Approaches for Defining Global Market Size (Value, Volume* & Price*)

Note*: In applicable scenarios
Step 3 - Data Sources
Primary Research
- Web Analytics
- Survey Reports
- Research Institute
- Latest Research Reports
- Opinion Leaders
Secondary Research
- Annual Reports
- White Paper
- Latest Press Release
- Industry Association
- Paid Database
- Investor Presentations

Step 4 - Data Triangulation
Involves using different sources of information in order to increase the validity of a study
These sources are likely to be stakeholders in a program - participants, other researchers, program staff, other community members, and so on.
Then we put all data in single framework & apply various statistical tools to find out the dynamic on the market.
During the analysis stage, feedback from the stakeholder groups would be compared to determine areas of agreement as well as areas of divergence