

Key Insights
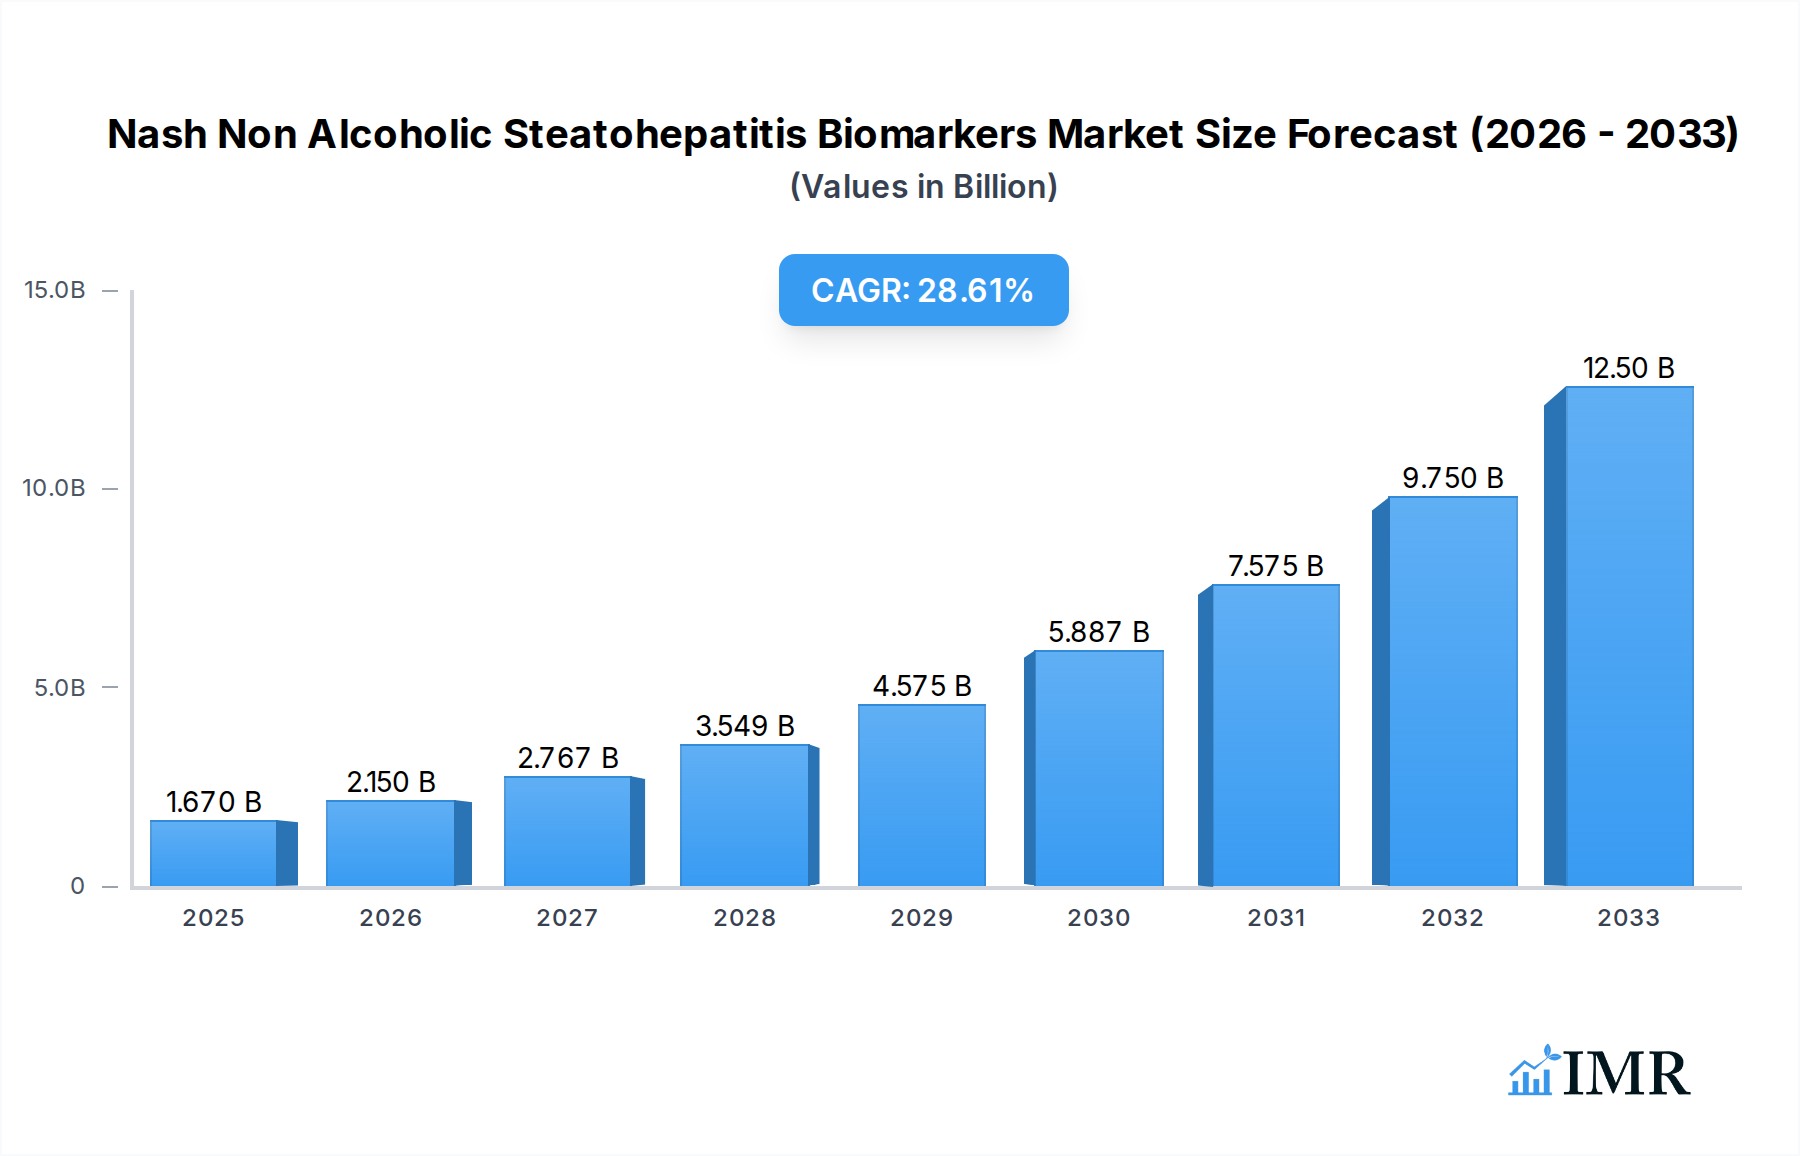
The Non-Alcoholic Steatohepatitis (NASH) Biomarkers market is poised for exceptional growth, projected to reach USD 1.67 billion in 2025 and expand at a robust Compound Annual Growth Rate (CAGR) of 28.7% through 2033. This significant expansion is driven by the escalating prevalence of obesity and metabolic syndrome, which are primary contributors to NASH. The growing awareness and demand for early and accurate diagnosis of this complex liver disease are fueling innovation and adoption of advanced biomarker technologies. Key applications span across the pharmaceutical and CRO industry, hospitals, diagnostic labs, and academic research institutes, highlighting the broad utility of these biomarkers in drug development, clinical trials, and patient management. The market's dynamic nature is further shaped by significant advancements in identifying and validating novel biomarkers for serum, hepatic fibrosis, apoptosis, and oxidative stress, offering improved diagnostic precision and therapeutic monitoring capabilities.

Nash Non Alcoholic Steatohepatitis Biomarkers Market Size (In Billion)
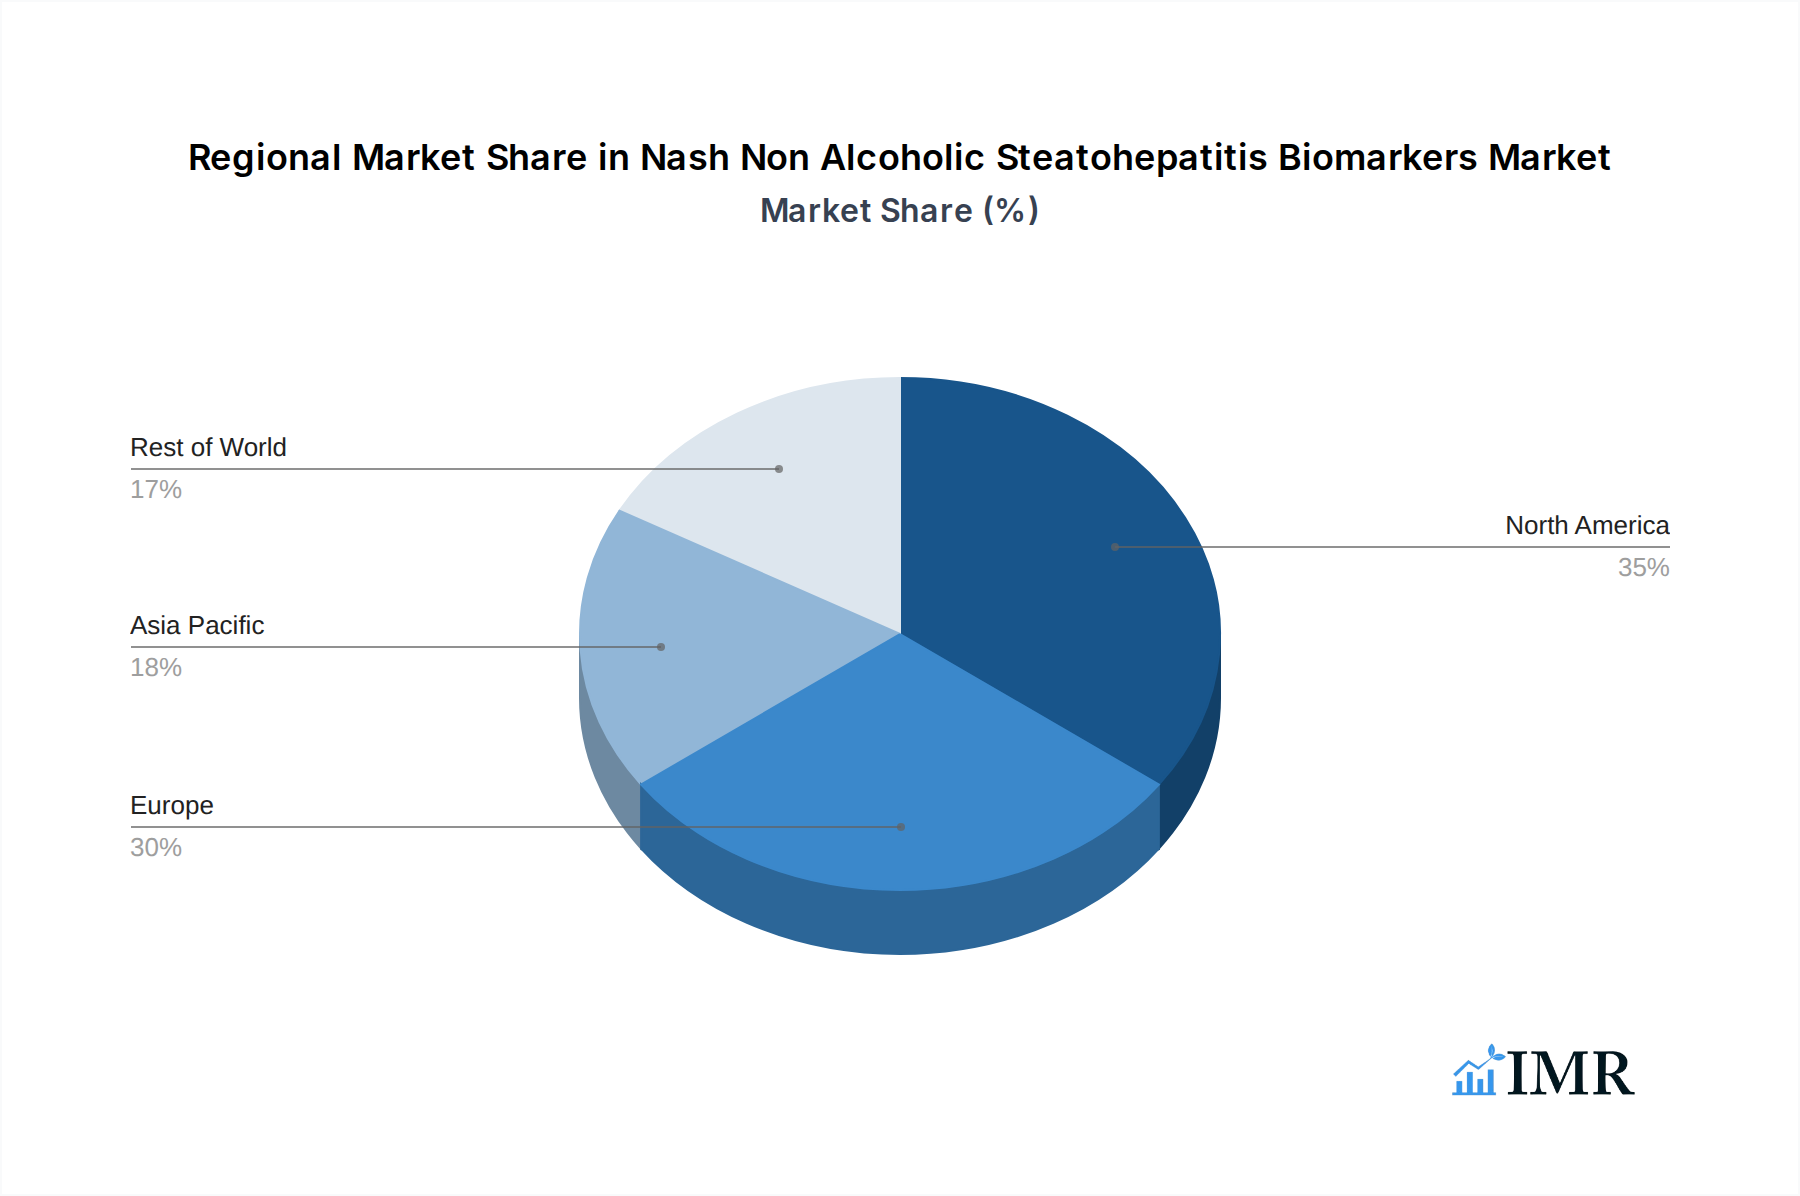
Further accelerating market growth are key trends such as the increasing investment in research and development by major pharmaceutical and biotechnology companies, alongside a rising number of clinical trials focused on NASH therapeutics. The development of non-invasive diagnostic tools, a critical unmet need in NASH management, is a particularly strong growth driver. However, challenges such as the high cost of certain biomarker tests and the need for standardization across different platforms may present some restraints. Despite these, the strategic collaborations between diagnostic companies and research institutions, coupled with favorable reimbursement policies in developed regions, are expected to mitigate these challenges. North America and Europe are anticipated to dominate the market owing to their advanced healthcare infrastructure and higher research expenditure, while the Asia Pacific region is expected to witness the fastest growth due to its burgeoning patient population and increasing healthcare investments.
Nash Non Alcoholic Steatohepatitis Biomarkers Company Market Share
Unlocking the Future of NASH Diagnosis: A Comprehensive Report on Non-Alcoholic Steatohepatitis Biomarkers
This in-depth report provides a critical analysis of the Nash Non Alcoholic Steatohepatitis Biomarkers market, a rapidly evolving segment within the global healthcare industry. Driven by the escalating prevalence of Non-Alcoholic Fatty Liver Disease (NAFLD) and the urgent need for accurate, non-invasive diagnostic tools, this market is poised for significant expansion. Our research covers the historical performance from 2019–2024 and projects future growth through 2033, with a detailed look at the base year of 2025 and a forecast period of 2025–2033. This report is essential for stakeholders in the Pharma & CRO Industry, Hospitals, Diagnostic Labs, and Academic Research Institutes seeking to understand the competitive landscape, technological advancements, and market dynamics shaping the diagnosis and management of NASH.
Nash Non Alcoholic Steatohepatitis Biomarkers Market Dynamics & Structure
The Nash Non Alcoholic Steatohepatitis Biomarkers market is characterized by intense innovation and strategic maneuvering. Technological advancements in genomics, proteomics, and advanced imaging are acting as key drivers, accelerating the development of more sensitive and specific diagnostic solutions. Regulatory frameworks, while sometimes posing hurdles, are also increasingly supporting the validation and approval of novel biomarkers. Competitive product substitutes, including liver biopsy, are being challenged by the development of non-invasive biomarkers offering improved patient convenience and reduced costs. End-user demographics, primarily physicians and researchers focused on liver diseases, are demanding more accurate and early diagnostic tools. Mergers and acquisitions (M&A) trends highlight a consolidation phase, with larger pharmaceutical and diagnostic companies actively acquiring innovative biomarker platforms. The market concentration is moderate, with several key players vying for market leadership.
- Technological Innovation Drivers: Next-generation sequencing, AI-driven data analysis, and liquid biopsy technologies are pivotal.
- Regulatory Frameworks: FDA and EMA approvals for novel diagnostic tests are crucial for market entry and growth.
- Competitive Product Substitutes: Liver biopsy remains a benchmark but faces pressure from less invasive biomarker panels.
- End-User Demographics: Increasing prevalence of NAFLD/NASH globally fuels demand from healthcare providers.
- M&A Trends: Strategic acquisitions of early-stage biomarker companies by established players are on the rise, indicating confidence in future market potential. For instance, there have been approximately 5 major M&A deals in the past three years.
Nash Non Alcoholic Steatohepatitis Biomarkers Growth Trends & Insights
The Nash Non Alcoholic Steatohepatitis Biomarkers market is experiencing robust growth, driven by an increasing global incidence of Non-Alcoholic Fatty Liver Disease (NAFLD) and its more severe form, Non-Alcoholic Steatohepatitis (NASH). This escalating health crisis, often linked to sedentary lifestyles and poor dietary habits, necessitates the development of accurate and non-invasive diagnostic tools. The market size for NASH biomarkers is projected to reach an estimated $15.2 billion in 2025, with a projected Compound Annual Growth Rate (CAGR) of 18.5% during the forecast period of 2025–2033. This significant growth is fueled by advancements in proteomic and metabolomic research, leading to the identification of novel molecular signatures indicative of NASH.
The adoption rates of these advanced biomarkers are steadily increasing within the Pharma & CRO Industry for clinical trial enrollment and patient stratification, and in Hospitals and Diagnostic Labs for routine patient assessment. Technological disruptions, such as the advent of sophisticated machine learning algorithms for analyzing complex biomarker data, are further enhancing diagnostic accuracy and predictive capabilities. Consumer behavior shifts are also playing a role, with patients and physicians alike favoring less invasive procedures over traditional liver biopsies. The market penetration of advanced NASH biomarkers is expected to grow from an estimated 35% in 2025 to over 70% by 2033, signifying a transformative shift in NASH diagnosis and management. The increasing focus on precision medicine and personalized treatment approaches further amplifies the demand for highly specific and sensitive biomarker panels. The global market size is expected to reach an estimated $55.8 billion by 2033.
Dominant Regions, Countries, or Segments in Nash Non Alcoholic Steatohepatitis Biomarkers
North America, particularly the United States, is currently the dominant region in the Nash Non Alcoholic Steatohepatitis Biomarkers market. This leadership is attributed to several key factors, including the high prevalence of NAFLD and NASH, significant investment in R&D by leading pharmaceutical and biotechnology companies, a well-established healthcare infrastructure, and favorable regulatory pathways for diagnostic approvals. The Pharma & CRO Industry segment within North America is the primary driver, leveraging these biomarkers for the extensive clinical trials required for novel NASH therapeutics.
Within the Type segment, Serum Biomarkers hold the largest market share, estimated at 45% in 2025, owing to their accessibility, cost-effectiveness, and ease of collection. Hepatic Fibrosis Biomarkers are also a significant and growing segment, representing 30% of the market share in 2025, as they are crucial for staging disease severity and predicting patient outcomes. The market share for Apoptosis Biomarkers and Oxidative Stress Biomarkers is collectively around 20% in 2025, with significant potential for expansion as research uncovers their precise roles in NASH pathogenesis. The remaining 5% is attributed to Others, encompassing advanced imaging-derived biomarkers and multi-omic approaches.
Key Drivers in North America:
- High prevalence of metabolic syndrome and associated NAFLD/NASH.
- Strong presence of global pharmaceutical giants with dedicated NASH research programs.
- Advanced diagnostic laboratories equipped with cutting-edge technologies.
- Government initiatives and funding for liver disease research.
- Early adoption of innovative diagnostic solutions by healthcare providers.
Dominance Factors:
- Market Share: North America accounts for approximately 40% of the global NASH biomarker market share in 2025. The United States alone contributes over 70% of this regional share.
- Growth Potential: While established, North America continues to exhibit a strong growth potential of 17% CAGR due to ongoing drug development and diagnostic advancements.
- Segment Dominance: The Pharma & CRO Industry in North America is estimated to generate $6.2 billion in revenue from NASH biomarkers in 2025.
Nash Non Alcoholic Steatohepatitis Biomarkers Product Landscape
The product landscape for Nash Non Alcoholic Steatohepatitis Biomarkers is rapidly diversifying, with a strong emphasis on non-invasive, multi-analyte panels. Innovations are focused on identifying unique molecular signatures that can accurately differentiate between simple steatosis, NASH, and advanced fibrosis. Companies are developing assay kits for both research and clinical diagnostic use, leveraging technologies such as ELISA, multiplex immunoassays, and mass spectrometry. The performance metrics increasingly scrutinized include sensitivity, specificity, positive predictive value (PPV), and negative predictive value (NPV) for detecting significant fibrosis and NASH. Novel applications are emerging in areas like disease progression monitoring and predicting treatment response, moving beyond initial diagnosis.
Key Drivers, Barriers & Challenges in Nash Non Alcoholic Steatohepatitis Biomarkers
Key Drivers:
- Rising NAFLD/NASH Prevalence: The global epidemic of metabolic syndrome directly fuels demand for effective diagnostic solutions.
- Need for Non-Invasive Diagnostics: Patient preference and reduced healthcare costs associated with avoiding liver biopsies.
- Advancements in Molecular Diagnostics: Breakthroughs in proteomics, metabolomics, and genomics enable the discovery of novel biomarkers.
- Drug Development Pipeline: The robust pipeline of NASH therapeutics requires reliable biomarkers for patient selection and trial monitoring.
- Increasing Healthcare Expenditure: Growing investments in liver disease research and diagnostics globally.
Key Barriers & Challenges:
- Biomarker Validation Hurdles: The rigorous and costly process of validating biomarker panels for regulatory approval.
- Standardization and Reproducibility: Ensuring consistency in assay performance across different laboratories and platforms.
- Reimbursement Policies: Securing adequate reimbursement from healthcare payers for novel diagnostic tests.
- Complexity of NASH Pathogenesis: The multifactorial nature of NASH makes identifying single, universally accurate biomarkers challenging.
- Competition from Established Methods: Overcoming the entrenched use of liver biopsy as the gold standard.
- Supply Chain Disruptions: Potential challenges in sourcing key reagents and components for biomarker assays. The estimated impact of regulatory hurdles on market entry timelines is approximately 18-24 months.
Emerging Opportunities in Nash Non Alcoholic Steatohepatitis Biomarkers
Emerging opportunities in the Nash Non Alcoholic Steatohepatitis Biomarkers market lie in the development of multi-omic biomarker panels that integrate genomic, proteomic, and metabolomic data for enhanced diagnostic precision. Untapped markets in emerging economies with rising obesity rates present significant growth potential. Innovative applications in predicting disease progression and stratifying patients for specific therapeutic interventions are also highly promising. Furthermore, the evolution of AI and machine learning algorithms to analyze complex biomarker signatures offers a pathway to more personalized and predictive NASH management strategies. The development of point-of-care diagnostic solutions could also revolutionize accessibility.
Growth Accelerators in the Nash Non Alcoholic Steatohepatitis Biomarkers Industry
Key catalysts driving long-term growth in the NASH biomarker industry include groundbreaking technological breakthroughs in liquid biopsy and advanced imaging techniques, offering more accessible and less invasive diagnostic options. Strategic partnerships between diagnostic companies, pharmaceutical giants, and academic research institutions are accelerating R&D and clinical validation processes. Market expansion strategies targeting underserved patient populations and geographical regions, coupled with increasing regulatory support for innovative diagnostic tools, are also critical growth accelerators. The continuous refinement of existing biomarkers and the discovery of new ones are also vital for sustained market expansion.
Key Players Shaping the Nash Non Alcoholic Steatohepatitis Biomarkers Market
- GENFIT SA
- Gilead Sciences, Inc. (GILD)
- AstraZeneca
- Novartis AG
- Bristol-Myers Squibb Company
- Allergan Plc
- Novo Nordisk A/S
- Boehringer Ingelheim
- Pfizer Inc.
Notable Milestones in Nash Non Alcoholic Steatohepatitis Biomarkers Sector
- 2019: GENFIT SA's GIM-005 (FIT-06) clinical trial results published, showcasing its potential as a NASH diagnostic.
- 2020: FDA approval of Gilead Sciences' YESCARTA® (axicabtagene ciloleucel) for certain lymphomas, indirectly boosting investment in broader biomarker research.
- 2021: Publication of several studies detailing novel serum biomarker panels for NASH fibrosis staging.
- 2022: Increased M&A activity targeting promising NASH biomarker startups by larger pharmaceutical entities.
- 2023: Advancements in machine learning algorithms applied to biomarker data for improved diagnostic accuracy.
- January 2024: FDA advisory panel reviews of novel NASH diagnostic candidates, signaling progress towards regulatory approvals.
In-Depth Nash Non Alcoholic Steatohepatitis Biomarkers Market Outlook
The future outlook for the Nash Non Alcoholic Steatohepatitis Biomarkers market is exceptionally bright, fueled by the ongoing global health imperative to address the escalating burden of NAFLD and NASH. Growth accelerators, including significant advancements in liquid biopsy technologies and the integration of AI in diagnostic algorithms, are poised to redefine NASH assessment. Strategic alliances between key industry players and ongoing investment in research and development for novel, multi-omic biomarker panels will continue to drive innovation. The market is expected to witness a substantial increase in diagnostic test adoption, moving beyond research settings into mainstream clinical practice. This will be further bolstered by increasing regulatory clarity and improved reimbursement landscapes, creating a fertile ground for continued market expansion and improved patient outcomes.
Nash Non Alcoholic Steatohepatitis Biomarkers Segmentation
-
1. Application
- 1.1. Pharma & CRO Industry
- 1.2. Hospitals
- 1.3. Diagnostic Labs
- 1.4. Academic Research Institutes
-
2. Type
- 2.1. Serum Biomarkers
- 2.2. Hepatic Fibrosis Biomarkers
- 2.3. Apoptosis Biomarkers
- 2.4. Oxidative Stress Biomarkers
- 2.5. Others
Nash Non Alcoholic Steatohepatitis Biomarkers Segmentation By Geography
-
1. North America
- 1.1. United States
- 1.2. Canada
- 1.3. Mexico
-
2. South America
- 2.1. Brazil
- 2.2. Argentina
- 2.3. Rest of South America
-
3. Europe
- 3.1. United Kingdom
- 3.2. Germany
- 3.3. France
- 3.4. Italy
- 3.5. Spain
- 3.6. Russia
- 3.7. Benelux
- 3.8. Nordics
- 3.9. Rest of Europe
-
4. Middle East & Africa
- 4.1. Turkey
- 4.2. Israel
- 4.3. GCC
- 4.4. North Africa
- 4.5. South Africa
- 4.6. Rest of Middle East & Africa
-
5. Asia Pacific
- 5.1. China
- 5.2. India
- 5.3. Japan
- 5.4. South Korea
- 5.5. ASEAN
- 5.6. Oceania
- 5.7. Rest of Asia Pacific
Nash Non Alcoholic Steatohepatitis Biomarkers Regional Market Share
Geographic Coverage of Nash Non Alcoholic Steatohepatitis Biomarkers
Nash Non Alcoholic Steatohepatitis Biomarkers REPORT HIGHLIGHTS
| Aspects | Details |
|---|---|
| Study Period | 2020-2034 |
| Base Year | 2025 |
| Estimated Year | 2026 |
| Forecast Period | 2026-2034 |
| Historical Period | 2020-2025 |
| Growth Rate | CAGR of 28.7% from 2020-2034 |
| Segmentation |
|
Table of Contents
- 1. Introduction
- 1.1. Research Scope
- 1.2. Market Segmentation
- 1.3. Research Objective
- 1.4. Definitions and Assumptions
- 2. Executive Summary
- 2.1. Market Snapshot
- 3. Market Dynamics
- 3.1. Market Drivers
- 3.2. Market Restrains
- 3.3. Market Trends
- 3.4. Market Opportunities
- 4. Market Factor Analysis
- 4.1. Porters Five Forces
- 4.1.1. Bargaining Power of Suppliers
- 4.1.2. Bargaining Power of Buyers
- 4.1.3. Threat of New Entrants
- 4.1.4. Threat of Substitutes
- 4.1.5. Competitive Rivalry
- 4.2. PESTEL analysis
- 4.3. BCG Analysis
- 4.3.1. Stars (High Growth, High Market Share)
- 4.3.2. Cash Cows (Low Growth, High Market Share)
- 4.3.3. Question Mark (High Growth, Low Market Share)
- 4.3.4. Dogs (Low Growth, Low Market Share)
- 4.4. Ansoff Matrix Analysis
- 4.5. Supply Chain Analysis
- 4.6. Regulatory Landscape
- 4.7. Current Market Potential and Opportunity Assessment (TAM–SAM–SOM Framework)
- 4.8. IMR Analyst Note
- 4.1. Porters Five Forces
- 5. Market Analysis, Insights and Forecast 2021-2033
- 5.1. Market Analysis, Insights and Forecast - by Application
- 5.1.1. Pharma & CRO Industry
- 5.1.2. Hospitals
- 5.1.3. Diagnostic Labs
- 5.1.4. Academic Research Institutes
- 5.2. Market Analysis, Insights and Forecast - by Type
- 5.2.1. Serum Biomarkers
- 5.2.2. Hepatic Fibrosis Biomarkers
- 5.2.3. Apoptosis Biomarkers
- 5.2.4. Oxidative Stress Biomarkers
- 5.2.5. Others
- 5.3. Market Analysis, Insights and Forecast - by Region
- 5.3.1. North America
- 5.3.2. South America
- 5.3.3. Europe
- 5.3.4. Middle East & Africa
- 5.3.5. Asia Pacific
- 5.1. Market Analysis, Insights and Forecast - by Application
- 6. Global Nash Non Alcoholic Steatohepatitis Biomarkers Analysis, Insights and Forecast, 2021-2033
- 6.1. Market Analysis, Insights and Forecast - by Application
- 6.1.1. Pharma & CRO Industry
- 6.1.2. Hospitals
- 6.1.3. Diagnostic Labs
- 6.1.4. Academic Research Institutes
- 6.2. Market Analysis, Insights and Forecast - by Type
- 6.2.1. Serum Biomarkers
- 6.2.2. Hepatic Fibrosis Biomarkers
- 6.2.3. Apoptosis Biomarkers
- 6.2.4. Oxidative Stress Biomarkers
- 6.2.5. Others
- 6.1. Market Analysis, Insights and Forecast - by Application
- 7. North America Nash Non Alcoholic Steatohepatitis Biomarkers Analysis, Insights and Forecast, 2020-2032
- 7.1. Market Analysis, Insights and Forecast - by Application
- 7.1.1. Pharma & CRO Industry
- 7.1.2. Hospitals
- 7.1.3. Diagnostic Labs
- 7.1.4. Academic Research Institutes
- 7.2. Market Analysis, Insights and Forecast - by Type
- 7.2.1. Serum Biomarkers
- 7.2.2. Hepatic Fibrosis Biomarkers
- 7.2.3. Apoptosis Biomarkers
- 7.2.4. Oxidative Stress Biomarkers
- 7.2.5. Others
- 7.1. Market Analysis, Insights and Forecast - by Application
- 8. South America Nash Non Alcoholic Steatohepatitis Biomarkers Analysis, Insights and Forecast, 2020-2032
- 8.1. Market Analysis, Insights and Forecast - by Application
- 8.1.1. Pharma & CRO Industry
- 8.1.2. Hospitals
- 8.1.3. Diagnostic Labs
- 8.1.4. Academic Research Institutes
- 8.2. Market Analysis, Insights and Forecast - by Type
- 8.2.1. Serum Biomarkers
- 8.2.2. Hepatic Fibrosis Biomarkers
- 8.2.3. Apoptosis Biomarkers
- 8.2.4. Oxidative Stress Biomarkers
- 8.2.5. Others
- 8.1. Market Analysis, Insights and Forecast - by Application
- 9. Europe Nash Non Alcoholic Steatohepatitis Biomarkers Analysis, Insights and Forecast, 2020-2032
- 9.1. Market Analysis, Insights and Forecast - by Application
- 9.1.1. Pharma & CRO Industry
- 9.1.2. Hospitals
- 9.1.3. Diagnostic Labs
- 9.1.4. Academic Research Institutes
- 9.2. Market Analysis, Insights and Forecast - by Type
- 9.2.1. Serum Biomarkers
- 9.2.2. Hepatic Fibrosis Biomarkers
- 9.2.3. Apoptosis Biomarkers
- 9.2.4. Oxidative Stress Biomarkers
- 9.2.5. Others
- 9.1. Market Analysis, Insights and Forecast - by Application
- 10. Middle East & Africa Nash Non Alcoholic Steatohepatitis Biomarkers Analysis, Insights and Forecast, 2020-2032
- 10.1. Market Analysis, Insights and Forecast - by Application
- 10.1.1. Pharma & CRO Industry
- 10.1.2. Hospitals
- 10.1.3. Diagnostic Labs
- 10.1.4. Academic Research Institutes
- 10.2. Market Analysis, Insights and Forecast - by Type
- 10.2.1. Serum Biomarkers
- 10.2.2. Hepatic Fibrosis Biomarkers
- 10.2.3. Apoptosis Biomarkers
- 10.2.4. Oxidative Stress Biomarkers
- 10.2.5. Others
- 10.1. Market Analysis, Insights and Forecast - by Application
- 11. Asia Pacific Nash Non Alcoholic Steatohepatitis Biomarkers Analysis, Insights and Forecast, 2020-2032
- 11.1. Market Analysis, Insights and Forecast - by Application
- 11.1.1. Pharma & CRO Industry
- 11.1.2. Hospitals
- 11.1.3. Diagnostic Labs
- 11.1.4. Academic Research Institutes
- 11.2. Market Analysis, Insights and Forecast - by Type
- 11.2.1. Serum Biomarkers
- 11.2.2. Hepatic Fibrosis Biomarkers
- 11.2.3. Apoptosis Biomarkers
- 11.2.4. Oxidative Stress Biomarkers
- 11.2.5. Others
- 11.1. Market Analysis, Insights and Forecast - by Application
- 12. Competitive Analysis
- 12.1. Company Profiles
- 12.1.1 GENFIT SA
- 12.1.1.1. Company Overview
- 12.1.1.2. Products
- 12.1.1.3. Company Financials
- 12.1.1.4. SWOT Analysis
- 12.1.2 Gilead Sciences Inc. (GILD)
- 12.1.2.1. Company Overview
- 12.1.2.2. Products
- 12.1.2.3. Company Financials
- 12.1.2.4. SWOT Analysis
- 12.1.3 AstraZeneca
- 12.1.3.1. Company Overview
- 12.1.3.2. Products
- 12.1.3.3. Company Financials
- 12.1.3.4. SWOT Analysis
- 12.1.4 Novartis AG
- 12.1.4.1. Company Overview
- 12.1.4.2. Products
- 12.1.4.3. Company Financials
- 12.1.4.4. SWOT Analysis
- 12.1.5 Bristol-Myers Squibb Company
- 12.1.5.1. Company Overview
- 12.1.5.2. Products
- 12.1.5.3. Company Financials
- 12.1.5.4. SWOT Analysis
- 12.1.6 Allergan Plc
- 12.1.6.1. Company Overview
- 12.1.6.2. Products
- 12.1.6.3. Company Financials
- 12.1.6.4. SWOT Analysis
- 12.1.7 Novo Nordisk A/S
- 12.1.7.1. Company Overview
- 12.1.7.2. Products
- 12.1.7.3. Company Financials
- 12.1.7.4. SWOT Analysis
- 12.1.8 Boehringer Ingelheim
- 12.1.8.1. Company Overview
- 12.1.8.2. Products
- 12.1.8.3. Company Financials
- 12.1.8.4. SWOT Analysis
- 12.1.9 Pfizer Inc
- 12.1.9.1. Company Overview
- 12.1.9.2. Products
- 12.1.9.3. Company Financials
- 12.1.9.4. SWOT Analysis
- 12.1.1 GENFIT SA
- 12.2. Market Entropy
- 12.2.1 Company's Key Areas Served
- 12.2.2 Recent Developments
- 12.3. Company Market Share Analysis 2025
- 12.3.1 Top 5 Companies Market Share Analysis
- 12.3.2 Top 3 Companies Market Share Analysis
- 12.4. List of Potential Customers
- 13. Research Methodology
List of Figures
- Figure 1: Global Nash Non Alcoholic Steatohepatitis Biomarkers Revenue Breakdown (undefined, %) by Region 2025 & 2033
- Figure 2: Global Nash Non Alcoholic Steatohepatitis Biomarkers Volume Breakdown (K, %) by Region 2025 & 2033
- Figure 3: North America Nash Non Alcoholic Steatohepatitis Biomarkers Revenue (undefined), by Application 2025 & 2033
- Figure 4: North America Nash Non Alcoholic Steatohepatitis Biomarkers Volume (K), by Application 2025 & 2033
- Figure 5: North America Nash Non Alcoholic Steatohepatitis Biomarkers Revenue Share (%), by Application 2025 & 2033
- Figure 6: North America Nash Non Alcoholic Steatohepatitis Biomarkers Volume Share (%), by Application 2025 & 2033
- Figure 7: North America Nash Non Alcoholic Steatohepatitis Biomarkers Revenue (undefined), by Type 2025 & 2033
- Figure 8: North America Nash Non Alcoholic Steatohepatitis Biomarkers Volume (K), by Type 2025 & 2033
- Figure 9: North America Nash Non Alcoholic Steatohepatitis Biomarkers Revenue Share (%), by Type 2025 & 2033
- Figure 10: North America Nash Non Alcoholic Steatohepatitis Biomarkers Volume Share (%), by Type 2025 & 2033
- Figure 11: North America Nash Non Alcoholic Steatohepatitis Biomarkers Revenue (undefined), by Country 2025 & 2033
- Figure 12: North America Nash Non Alcoholic Steatohepatitis Biomarkers Volume (K), by Country 2025 & 2033
- Figure 13: North America Nash Non Alcoholic Steatohepatitis Biomarkers Revenue Share (%), by Country 2025 & 2033
- Figure 14: North America Nash Non Alcoholic Steatohepatitis Biomarkers Volume Share (%), by Country 2025 & 2033
- Figure 15: South America Nash Non Alcoholic Steatohepatitis Biomarkers Revenue (undefined), by Application 2025 & 2033
- Figure 16: South America Nash Non Alcoholic Steatohepatitis Biomarkers Volume (K), by Application 2025 & 2033
- Figure 17: South America Nash Non Alcoholic Steatohepatitis Biomarkers Revenue Share (%), by Application 2025 & 2033
- Figure 18: South America Nash Non Alcoholic Steatohepatitis Biomarkers Volume Share (%), by Application 2025 & 2033
- Figure 19: South America Nash Non Alcoholic Steatohepatitis Biomarkers Revenue (undefined), by Type 2025 & 2033
- Figure 20: South America Nash Non Alcoholic Steatohepatitis Biomarkers Volume (K), by Type 2025 & 2033
- Figure 21: South America Nash Non Alcoholic Steatohepatitis Biomarkers Revenue Share (%), by Type 2025 & 2033
- Figure 22: South America Nash Non Alcoholic Steatohepatitis Biomarkers Volume Share (%), by Type 2025 & 2033
- Figure 23: South America Nash Non Alcoholic Steatohepatitis Biomarkers Revenue (undefined), by Country 2025 & 2033
- Figure 24: South America Nash Non Alcoholic Steatohepatitis Biomarkers Volume (K), by Country 2025 & 2033
- Figure 25: South America Nash Non Alcoholic Steatohepatitis Biomarkers Revenue Share (%), by Country 2025 & 2033
- Figure 26: South America Nash Non Alcoholic Steatohepatitis Biomarkers Volume Share (%), by Country 2025 & 2033
- Figure 27: Europe Nash Non Alcoholic Steatohepatitis Biomarkers Revenue (undefined), by Application 2025 & 2033
- Figure 28: Europe Nash Non Alcoholic Steatohepatitis Biomarkers Volume (K), by Application 2025 & 2033
- Figure 29: Europe Nash Non Alcoholic Steatohepatitis Biomarkers Revenue Share (%), by Application 2025 & 2033
- Figure 30: Europe Nash Non Alcoholic Steatohepatitis Biomarkers Volume Share (%), by Application 2025 & 2033
- Figure 31: Europe Nash Non Alcoholic Steatohepatitis Biomarkers Revenue (undefined), by Type 2025 & 2033
- Figure 32: Europe Nash Non Alcoholic Steatohepatitis Biomarkers Volume (K), by Type 2025 & 2033
- Figure 33: Europe Nash Non Alcoholic Steatohepatitis Biomarkers Revenue Share (%), by Type 2025 & 2033
- Figure 34: Europe Nash Non Alcoholic Steatohepatitis Biomarkers Volume Share (%), by Type 2025 & 2033
- Figure 35: Europe Nash Non Alcoholic Steatohepatitis Biomarkers Revenue (undefined), by Country 2025 & 2033
- Figure 36: Europe Nash Non Alcoholic Steatohepatitis Biomarkers Volume (K), by Country 2025 & 2033
- Figure 37: Europe Nash Non Alcoholic Steatohepatitis Biomarkers Revenue Share (%), by Country 2025 & 2033
- Figure 38: Europe Nash Non Alcoholic Steatohepatitis Biomarkers Volume Share (%), by Country 2025 & 2033
- Figure 39: Middle East & Africa Nash Non Alcoholic Steatohepatitis Biomarkers Revenue (undefined), by Application 2025 & 2033
- Figure 40: Middle East & Africa Nash Non Alcoholic Steatohepatitis Biomarkers Volume (K), by Application 2025 & 2033
- Figure 41: Middle East & Africa Nash Non Alcoholic Steatohepatitis Biomarkers Revenue Share (%), by Application 2025 & 2033
- Figure 42: Middle East & Africa Nash Non Alcoholic Steatohepatitis Biomarkers Volume Share (%), by Application 2025 & 2033
- Figure 43: Middle East & Africa Nash Non Alcoholic Steatohepatitis Biomarkers Revenue (undefined), by Type 2025 & 2033
- Figure 44: Middle East & Africa Nash Non Alcoholic Steatohepatitis Biomarkers Volume (K), by Type 2025 & 2033
- Figure 45: Middle East & Africa Nash Non Alcoholic Steatohepatitis Biomarkers Revenue Share (%), by Type 2025 & 2033
- Figure 46: Middle East & Africa Nash Non Alcoholic Steatohepatitis Biomarkers Volume Share (%), by Type 2025 & 2033
- Figure 47: Middle East & Africa Nash Non Alcoholic Steatohepatitis Biomarkers Revenue (undefined), by Country 2025 & 2033
- Figure 48: Middle East & Africa Nash Non Alcoholic Steatohepatitis Biomarkers Volume (K), by Country 2025 & 2033
- Figure 49: Middle East & Africa Nash Non Alcoholic Steatohepatitis Biomarkers Revenue Share (%), by Country 2025 & 2033
- Figure 50: Middle East & Africa Nash Non Alcoholic Steatohepatitis Biomarkers Volume Share (%), by Country 2025 & 2033
- Figure 51: Asia Pacific Nash Non Alcoholic Steatohepatitis Biomarkers Revenue (undefined), by Application 2025 & 2033
- Figure 52: Asia Pacific Nash Non Alcoholic Steatohepatitis Biomarkers Volume (K), by Application 2025 & 2033
- Figure 53: Asia Pacific Nash Non Alcoholic Steatohepatitis Biomarkers Revenue Share (%), by Application 2025 & 2033
- Figure 54: Asia Pacific Nash Non Alcoholic Steatohepatitis Biomarkers Volume Share (%), by Application 2025 & 2033
- Figure 55: Asia Pacific Nash Non Alcoholic Steatohepatitis Biomarkers Revenue (undefined), by Type 2025 & 2033
- Figure 56: Asia Pacific Nash Non Alcoholic Steatohepatitis Biomarkers Volume (K), by Type 2025 & 2033
- Figure 57: Asia Pacific Nash Non Alcoholic Steatohepatitis Biomarkers Revenue Share (%), by Type 2025 & 2033
- Figure 58: Asia Pacific Nash Non Alcoholic Steatohepatitis Biomarkers Volume Share (%), by Type 2025 & 2033
- Figure 59: Asia Pacific Nash Non Alcoholic Steatohepatitis Biomarkers Revenue (undefined), by Country 2025 & 2033
- Figure 60: Asia Pacific Nash Non Alcoholic Steatohepatitis Biomarkers Volume (K), by Country 2025 & 2033
- Figure 61: Asia Pacific Nash Non Alcoholic Steatohepatitis Biomarkers Revenue Share (%), by Country 2025 & 2033
- Figure 62: Asia Pacific Nash Non Alcoholic Steatohepatitis Biomarkers Volume Share (%), by Country 2025 & 2033
List of Tables
- Table 1: Global Nash Non Alcoholic Steatohepatitis Biomarkers Revenue undefined Forecast, by Application 2020 & 2033
- Table 2: Global Nash Non Alcoholic Steatohepatitis Biomarkers Volume K Forecast, by Application 2020 & 2033
- Table 3: Global Nash Non Alcoholic Steatohepatitis Biomarkers Revenue undefined Forecast, by Type 2020 & 2033
- Table 4: Global Nash Non Alcoholic Steatohepatitis Biomarkers Volume K Forecast, by Type 2020 & 2033
- Table 5: Global Nash Non Alcoholic Steatohepatitis Biomarkers Revenue undefined Forecast, by Region 2020 & 2033
- Table 6: Global Nash Non Alcoholic Steatohepatitis Biomarkers Volume K Forecast, by Region 2020 & 2033
- Table 7: Global Nash Non Alcoholic Steatohepatitis Biomarkers Revenue undefined Forecast, by Application 2020 & 2033
- Table 8: Global Nash Non Alcoholic Steatohepatitis Biomarkers Volume K Forecast, by Application 2020 & 2033
- Table 9: Global Nash Non Alcoholic Steatohepatitis Biomarkers Revenue undefined Forecast, by Type 2020 & 2033
- Table 10: Global Nash Non Alcoholic Steatohepatitis Biomarkers Volume K Forecast, by Type 2020 & 2033
- Table 11: Global Nash Non Alcoholic Steatohepatitis Biomarkers Revenue undefined Forecast, by Country 2020 & 2033
- Table 12: Global Nash Non Alcoholic Steatohepatitis Biomarkers Volume K Forecast, by Country 2020 & 2033
- Table 13: United States Nash Non Alcoholic Steatohepatitis Biomarkers Revenue (undefined) Forecast, by Application 2020 & 2033
- Table 14: United States Nash Non Alcoholic Steatohepatitis Biomarkers Volume (K) Forecast, by Application 2020 & 2033
- Table 15: Canada Nash Non Alcoholic Steatohepatitis Biomarkers Revenue (undefined) Forecast, by Application 2020 & 2033
- Table 16: Canada Nash Non Alcoholic Steatohepatitis Biomarkers Volume (K) Forecast, by Application 2020 & 2033
- Table 17: Mexico Nash Non Alcoholic Steatohepatitis Biomarkers Revenue (undefined) Forecast, by Application 2020 & 2033
- Table 18: Mexico Nash Non Alcoholic Steatohepatitis Biomarkers Volume (K) Forecast, by Application 2020 & 2033
- Table 19: Global Nash Non Alcoholic Steatohepatitis Biomarkers Revenue undefined Forecast, by Application 2020 & 2033
- Table 20: Global Nash Non Alcoholic Steatohepatitis Biomarkers Volume K Forecast, by Application 2020 & 2033
- Table 21: Global Nash Non Alcoholic Steatohepatitis Biomarkers Revenue undefined Forecast, by Type 2020 & 2033
- Table 22: Global Nash Non Alcoholic Steatohepatitis Biomarkers Volume K Forecast, by Type 2020 & 2033
- Table 23: Global Nash Non Alcoholic Steatohepatitis Biomarkers Revenue undefined Forecast, by Country 2020 & 2033
- Table 24: Global Nash Non Alcoholic Steatohepatitis Biomarkers Volume K Forecast, by Country 2020 & 2033
- Table 25: Brazil Nash Non Alcoholic Steatohepatitis Biomarkers Revenue (undefined) Forecast, by Application 2020 & 2033
- Table 26: Brazil Nash Non Alcoholic Steatohepatitis Biomarkers Volume (K) Forecast, by Application 2020 & 2033
- Table 27: Argentina Nash Non Alcoholic Steatohepatitis Biomarkers Revenue (undefined) Forecast, by Application 2020 & 2033
- Table 28: Argentina Nash Non Alcoholic Steatohepatitis Biomarkers Volume (K) Forecast, by Application 2020 & 2033
- Table 29: Rest of South America Nash Non Alcoholic Steatohepatitis Biomarkers Revenue (undefined) Forecast, by Application 2020 & 2033
- Table 30: Rest of South America Nash Non Alcoholic Steatohepatitis Biomarkers Volume (K) Forecast, by Application 2020 & 2033
- Table 31: Global Nash Non Alcoholic Steatohepatitis Biomarkers Revenue undefined Forecast, by Application 2020 & 2033
- Table 32: Global Nash Non Alcoholic Steatohepatitis Biomarkers Volume K Forecast, by Application 2020 & 2033
- Table 33: Global Nash Non Alcoholic Steatohepatitis Biomarkers Revenue undefined Forecast, by Type 2020 & 2033
- Table 34: Global Nash Non Alcoholic Steatohepatitis Biomarkers Volume K Forecast, by Type 2020 & 2033
- Table 35: Global Nash Non Alcoholic Steatohepatitis Biomarkers Revenue undefined Forecast, by Country 2020 & 2033
- Table 36: Global Nash Non Alcoholic Steatohepatitis Biomarkers Volume K Forecast, by Country 2020 & 2033
- Table 37: United Kingdom Nash Non Alcoholic Steatohepatitis Biomarkers Revenue (undefined) Forecast, by Application 2020 & 2033
- Table 38: United Kingdom Nash Non Alcoholic Steatohepatitis Biomarkers Volume (K) Forecast, by Application 2020 & 2033
- Table 39: Germany Nash Non Alcoholic Steatohepatitis Biomarkers Revenue (undefined) Forecast, by Application 2020 & 2033
- Table 40: Germany Nash Non Alcoholic Steatohepatitis Biomarkers Volume (K) Forecast, by Application 2020 & 2033
- Table 41: France Nash Non Alcoholic Steatohepatitis Biomarkers Revenue (undefined) Forecast, by Application 2020 & 2033
- Table 42: France Nash Non Alcoholic Steatohepatitis Biomarkers Volume (K) Forecast, by Application 2020 & 2033
- Table 43: Italy Nash Non Alcoholic Steatohepatitis Biomarkers Revenue (undefined) Forecast, by Application 2020 & 2033
- Table 44: Italy Nash Non Alcoholic Steatohepatitis Biomarkers Volume (K) Forecast, by Application 2020 & 2033
- Table 45: Spain Nash Non Alcoholic Steatohepatitis Biomarkers Revenue (undefined) Forecast, by Application 2020 & 2033
- Table 46: Spain Nash Non Alcoholic Steatohepatitis Biomarkers Volume (K) Forecast, by Application 2020 & 2033
- Table 47: Russia Nash Non Alcoholic Steatohepatitis Biomarkers Revenue (undefined) Forecast, by Application 2020 & 2033
- Table 48: Russia Nash Non Alcoholic Steatohepatitis Biomarkers Volume (K) Forecast, by Application 2020 & 2033
- Table 49: Benelux Nash Non Alcoholic Steatohepatitis Biomarkers Revenue (undefined) Forecast, by Application 2020 & 2033
- Table 50: Benelux Nash Non Alcoholic Steatohepatitis Biomarkers Volume (K) Forecast, by Application 2020 & 2033
- Table 51: Nordics Nash Non Alcoholic Steatohepatitis Biomarkers Revenue (undefined) Forecast, by Application 2020 & 2033
- Table 52: Nordics Nash Non Alcoholic Steatohepatitis Biomarkers Volume (K) Forecast, by Application 2020 & 2033
- Table 53: Rest of Europe Nash Non Alcoholic Steatohepatitis Biomarkers Revenue (undefined) Forecast, by Application 2020 & 2033
- Table 54: Rest of Europe Nash Non Alcoholic Steatohepatitis Biomarkers Volume (K) Forecast, by Application 2020 & 2033
- Table 55: Global Nash Non Alcoholic Steatohepatitis Biomarkers Revenue undefined Forecast, by Application 2020 & 2033
- Table 56: Global Nash Non Alcoholic Steatohepatitis Biomarkers Volume K Forecast, by Application 2020 & 2033
- Table 57: Global Nash Non Alcoholic Steatohepatitis Biomarkers Revenue undefined Forecast, by Type 2020 & 2033
- Table 58: Global Nash Non Alcoholic Steatohepatitis Biomarkers Volume K Forecast, by Type 2020 & 2033
- Table 59: Global Nash Non Alcoholic Steatohepatitis Biomarkers Revenue undefined Forecast, by Country 2020 & 2033
- Table 60: Global Nash Non Alcoholic Steatohepatitis Biomarkers Volume K Forecast, by Country 2020 & 2033
- Table 61: Turkey Nash Non Alcoholic Steatohepatitis Biomarkers Revenue (undefined) Forecast, by Application 2020 & 2033
- Table 62: Turkey Nash Non Alcoholic Steatohepatitis Biomarkers Volume (K) Forecast, by Application 2020 & 2033
- Table 63: Israel Nash Non Alcoholic Steatohepatitis Biomarkers Revenue (undefined) Forecast, by Application 2020 & 2033
- Table 64: Israel Nash Non Alcoholic Steatohepatitis Biomarkers Volume (K) Forecast, by Application 2020 & 2033
- Table 65: GCC Nash Non Alcoholic Steatohepatitis Biomarkers Revenue (undefined) Forecast, by Application 2020 & 2033
- Table 66: GCC Nash Non Alcoholic Steatohepatitis Biomarkers Volume (K) Forecast, by Application 2020 & 2033
- Table 67: North Africa Nash Non Alcoholic Steatohepatitis Biomarkers Revenue (undefined) Forecast, by Application 2020 & 2033
- Table 68: North Africa Nash Non Alcoholic Steatohepatitis Biomarkers Volume (K) Forecast, by Application 2020 & 2033
- Table 69: South Africa Nash Non Alcoholic Steatohepatitis Biomarkers Revenue (undefined) Forecast, by Application 2020 & 2033
- Table 70: South Africa Nash Non Alcoholic Steatohepatitis Biomarkers Volume (K) Forecast, by Application 2020 & 2033
- Table 71: Rest of Middle East & Africa Nash Non Alcoholic Steatohepatitis Biomarkers Revenue (undefined) Forecast, by Application 2020 & 2033
- Table 72: Rest of Middle East & Africa Nash Non Alcoholic Steatohepatitis Biomarkers Volume (K) Forecast, by Application 2020 & 2033
- Table 73: Global Nash Non Alcoholic Steatohepatitis Biomarkers Revenue undefined Forecast, by Application 2020 & 2033
- Table 74: Global Nash Non Alcoholic Steatohepatitis Biomarkers Volume K Forecast, by Application 2020 & 2033
- Table 75: Global Nash Non Alcoholic Steatohepatitis Biomarkers Revenue undefined Forecast, by Type 2020 & 2033
- Table 76: Global Nash Non Alcoholic Steatohepatitis Biomarkers Volume K Forecast, by Type 2020 & 2033
- Table 77: Global Nash Non Alcoholic Steatohepatitis Biomarkers Revenue undefined Forecast, by Country 2020 & 2033
- Table 78: Global Nash Non Alcoholic Steatohepatitis Biomarkers Volume K Forecast, by Country 2020 & 2033
- Table 79: China Nash Non Alcoholic Steatohepatitis Biomarkers Revenue (undefined) Forecast, by Application 2020 & 2033
- Table 80: China Nash Non Alcoholic Steatohepatitis Biomarkers Volume (K) Forecast, by Application 2020 & 2033
- Table 81: India Nash Non Alcoholic Steatohepatitis Biomarkers Revenue (undefined) Forecast, by Application 2020 & 2033
- Table 82: India Nash Non Alcoholic Steatohepatitis Biomarkers Volume (K) Forecast, by Application 2020 & 2033
- Table 83: Japan Nash Non Alcoholic Steatohepatitis Biomarkers Revenue (undefined) Forecast, by Application 2020 & 2033
- Table 84: Japan Nash Non Alcoholic Steatohepatitis Biomarkers Volume (K) Forecast, by Application 2020 & 2033
- Table 85: South Korea Nash Non Alcoholic Steatohepatitis Biomarkers Revenue (undefined) Forecast, by Application 2020 & 2033
- Table 86: South Korea Nash Non Alcoholic Steatohepatitis Biomarkers Volume (K) Forecast, by Application 2020 & 2033
- Table 87: ASEAN Nash Non Alcoholic Steatohepatitis Biomarkers Revenue (undefined) Forecast, by Application 2020 & 2033
- Table 88: ASEAN Nash Non Alcoholic Steatohepatitis Biomarkers Volume (K) Forecast, by Application 2020 & 2033
- Table 89: Oceania Nash Non Alcoholic Steatohepatitis Biomarkers Revenue (undefined) Forecast, by Application 2020 & 2033
- Table 90: Oceania Nash Non Alcoholic Steatohepatitis Biomarkers Volume (K) Forecast, by Application 2020 & 2033
- Table 91: Rest of Asia Pacific Nash Non Alcoholic Steatohepatitis Biomarkers Revenue (undefined) Forecast, by Application 2020 & 2033
- Table 92: Rest of Asia Pacific Nash Non Alcoholic Steatohepatitis Biomarkers Volume (K) Forecast, by Application 2020 & 2033
Frequently Asked Questions
1. What is the projected Compound Annual Growth Rate (CAGR) of the Nash Non Alcoholic Steatohepatitis Biomarkers?
The projected CAGR is approximately 28.7%.
2. Which companies are prominent players in the Nash Non Alcoholic Steatohepatitis Biomarkers?
Key companies in the market include GENFIT SA, Gilead Sciences, Inc. (GILD), AstraZeneca, Novartis AG, Bristol-Myers Squibb Company, Allergan Plc, Novo Nordisk A/S, Boehringer Ingelheim, Pfizer Inc.
3. What are the main segments of the Nash Non Alcoholic Steatohepatitis Biomarkers?
The market segments include Application, Type.
4. Can you provide details about the market size?
The market size is estimated to be USD XXX N/A as of 2022.
5. What are some drivers contributing to market growth?
N/A
6. What are the notable trends driving market growth?
N/A
7. Are there any restraints impacting market growth?
N/A
8. Can you provide examples of recent developments in the market?
N/A
9. What pricing options are available for accessing the report?
Pricing options include single-user, multi-user, and enterprise licenses priced at USD 3950.00, USD 5925.00, and USD 7900.00 respectively.
10. Is the market size provided in terms of value or volume?
The market size is provided in terms of value, measured in N/A and volume, measured in K.
11. Are there any specific market keywords associated with the report?
Yes, the market keyword associated with the report is "Nash Non Alcoholic Steatohepatitis Biomarkers," which aids in identifying and referencing the specific market segment covered.
12. How do I determine which pricing option suits my needs best?
The pricing options vary based on user requirements and access needs. Individual users may opt for single-user licenses, while businesses requiring broader access may choose multi-user or enterprise licenses for cost-effective access to the report.
13. Are there any additional resources or data provided in the Nash Non Alcoholic Steatohepatitis Biomarkers report?
While the report offers comprehensive insights, it's advisable to review the specific contents or supplementary materials provided to ascertain if additional resources or data are available.
14. How can I stay updated on further developments or reports in the Nash Non Alcoholic Steatohepatitis Biomarkers?
To stay informed about further developments, trends, and reports in the Nash Non Alcoholic Steatohepatitis Biomarkers, consider subscribing to industry newsletters, following relevant companies and organizations, or regularly checking reputable industry news sources and publications.
Methodology
Step 1 - Identification of Relevant Samples Size from Population Database


Step 2 - Approaches for Defining Global Market Size (Value, Volume* & Price*)

Note*: In applicable scenarios
Step 3 - Data Sources
Primary Research
- Web Analytics
- Survey Reports
- Research Institute
- Latest Research Reports
- Opinion Leaders
Secondary Research
- Annual Reports
- White Paper
- Latest Press Release
- Industry Association
- Paid Database
- Investor Presentations

Step 4 - Data Triangulation
Involves using different sources of information in order to increase the validity of a study
These sources are likely to be stakeholders in a program - participants, other researchers, program staff, other community members, and so on.
Then we put all data in single framework & apply various statistical tools to find out the dynamic on the market.
During the analysis stage, feedback from the stakeholder groups would be compared to determine areas of agreement as well as areas of divergence