

Key Insights
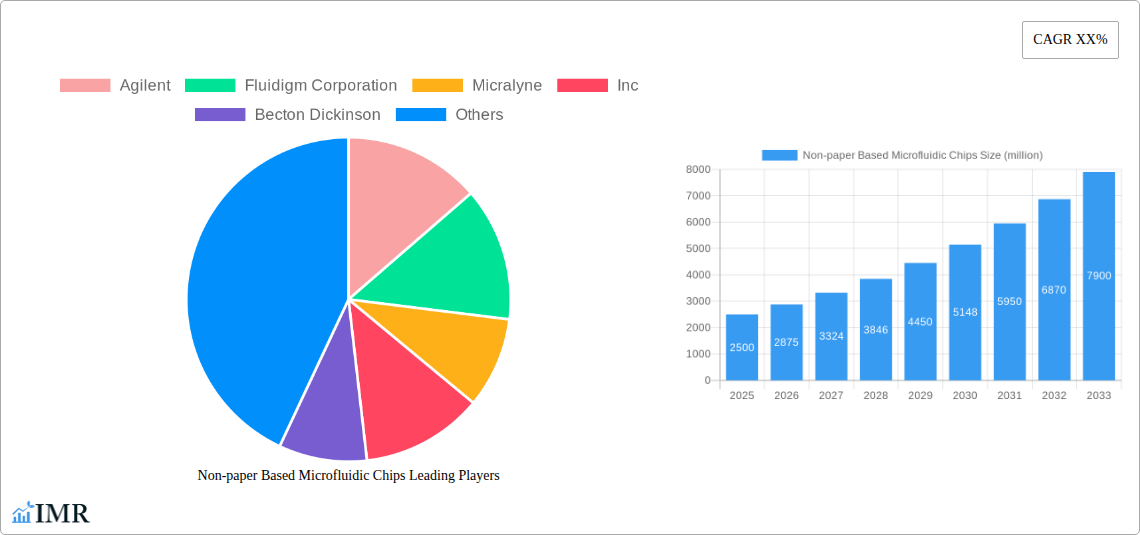
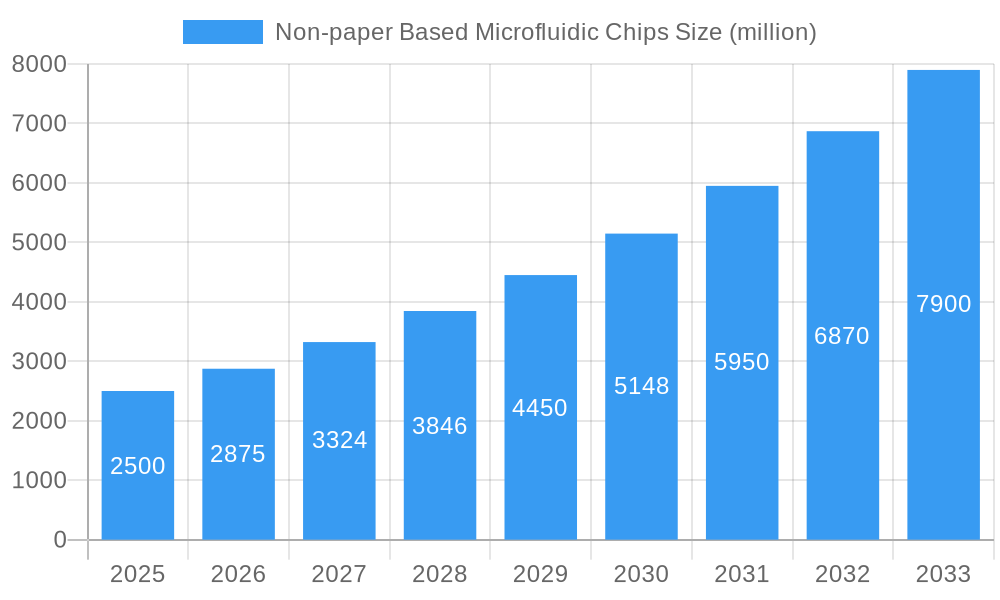
The global non-paper-based microfluidic chips market is poised for significant expansion, driven by innovation in healthcare diagnostics, drug discovery, and environmental monitoring. The market, valued at $24.96 billion in the base year 2025, is projected to grow at a Compound Annual Growth Rate (CAGR) of 8.3% from 2025 to 2033, reaching an estimated $45.2 billion by 2033. Key growth drivers include the increasing demand for point-of-care diagnostics and personalized medicine, facilitating rapid, accurate, and cost-effective microfluidic solutions. Advancements in the miniaturization of analytical instruments and the integration of lab-on-a-chip capabilities further enhance the market's potential. Substantial R&D investments and strategic partnerships among leading players like Agilent, Becton Dickinson, and Illumina are accelerating this progress.
Non-paper Based Microfluidic Chips Market Size (In Billion)
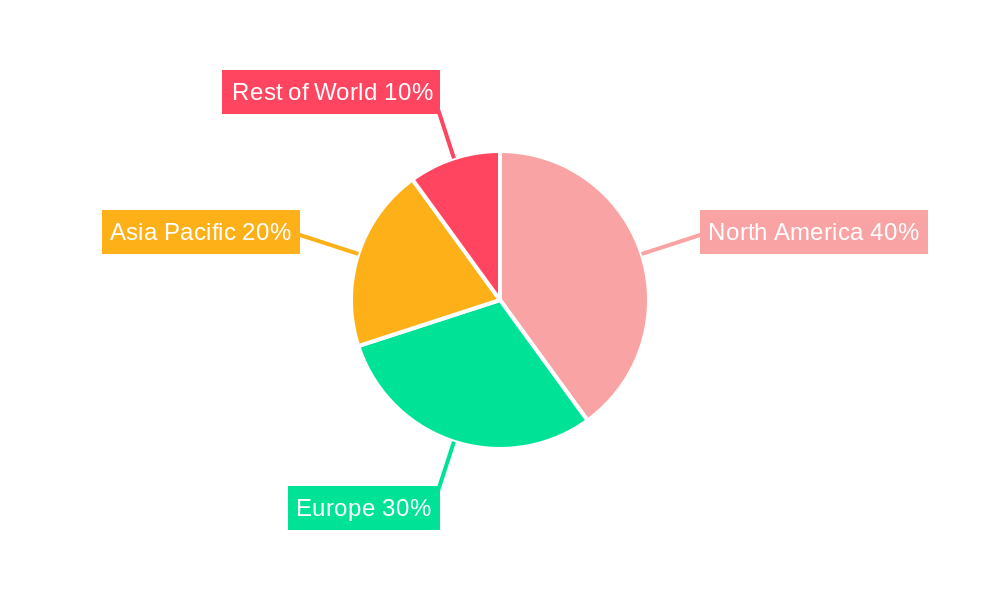
While the market presents considerable opportunities, challenges such as high manufacturing costs, complex integration of functionalities, and evolving regulatory landscapes need to be addressed. Nevertheless, continuous technological innovation and industry collaboration are expected to overcome these barriers, ensuring a positive market outlook. The market is anticipated to diversify across various applications (e.g., diagnostics, drug discovery, environmental monitoring), chip materials (silicon, glass, polymers), and geographies, with North America and Europe anticipated to lead due to robust healthcare infrastructure and advanced research capabilities.
Non-paper Based Microfluidic Chips Company Market Share
Non-Paper Based Microfluidic Chips Market Report: 2019-2033 Analysis
This comprehensive report analyzes the non-paper based microfluidic chips market from 2019 to 2033, providing crucial insights for stakeholders. With 2025 as the base and estimated year, the forecast period extends from 2025 to 2033, building upon historical data from 2019-2024. Market segmentation includes applications and geographical regions. This report forecasts a market value of $24.96 billion in 2025, projected to reach $45.2 billion by 2033, reflecting a CAGR of 8.3%.
Non-paper Based Microfluidic Chips Market Dynamics & Structure
The non-paper based microfluidic chips market is characterized by moderate concentration, with key players like Agilent, Fluidigm Corporation, and Becton Dickinson holding significant market share. However, the emergence of innovative startups and the continuous development of advanced technologies are fostering competition. The market is driven by technological advancements such as 3D printing and integration of lab-on-a-chip functionalities. Stringent regulatory approvals influence market dynamics, particularly in the healthcare and diagnostics sectors. Substitute technologies, including traditional lab equipment, pose some competitive pressure but the growing demand for miniaturization and automation in various applications favors microfluidic chips. The end-user demographics are predominantly comprised of research institutions, pharmaceutical companies, and diagnostic laboratories. The market has witnessed several mergers and acquisitions (M&A) deals in the past few years, further consolidating market share and driving innovation.
- Market Concentration: Moderately concentrated with top 5 players holding approximately xx% market share in 2025.
- Technological Innovation: Continuous advancements in materials science, microfabrication, and integration of sensors are key drivers.
- Regulatory Framework: Stringent regulatory pathways, particularly in the healthcare segment, influence market growth.
- Competitive Substitutes: Traditional laboratory equipment and other analytical methods present some competition.
- End-User Demographics: Primarily research institutions, pharmaceutical companies, biotech firms, and diagnostic laboratories.
- M&A Trends: A moderate number of M&A deals in recent years indicating consolidation and increased investment. The total value of M&A deals between 2019-2024 estimated at xx million USD.
Non-paper Based Microfluidic Chips Growth Trends & Insights
The non-paper based microfluidic chips market has exhibited strong growth over the historical period (2019-2024), with market size increasing from xx million USD in 2019 to xx million USD in 2024. This growth is primarily attributed to increasing demand for point-of-care diagnostics, the rise of personalized medicine, and the growing adoption of automation in various industries. Technological disruptions, such as the integration of artificial intelligence (AI) and machine learning (ML) for enhanced data analysis, are further accelerating market growth. Consumer behavior is shifting towards more convenient and rapid diagnostic solutions, which benefits the adoption of microfluidic chips. The market is expected to witness continued growth, driven by advancements in microfabrication, new applications, and increasing investment in research and development.
- Market Size Evolution: Significant growth from xx million USD in 2019 to xx million USD in 2024.
- Adoption Rates: Increasing adoption across diverse industries due to advantages in speed, efficiency, and cost-effectiveness.
- Technological Disruptions: Integration of AI/ML and other advanced technologies is revolutionizing applications.
- Consumer Behavior Shifts: Demand for faster, more convenient, and cost-effective solutions is driving market growth.
- CAGR (2019-2024): xx%
- Market Penetration: xx% in key segments in 2024.
Dominant Regions, Countries, or Segments in Non-Paper Based Microfluidic Chips
North America currently holds the largest market share, driven by robust R&D activities, strong technological advancements, and the significant presence of major players in the region. Europe follows as a major market, fueled by rising healthcare expenditure and increasing demand for advanced diagnostic tools. The Asia-Pacific region demonstrates significant growth potential due to rapid economic development, expanding healthcare infrastructure, and a growing number of research institutions.
- Key Drivers in North America: Strong R&D investments, established healthcare infrastructure, and high adoption rates in various industries.
- Key Drivers in Europe: Increasing healthcare expenditure and investments in advanced medical technologies.
- Key Drivers in Asia-Pacific: Rapid economic growth, expanding healthcare infrastructure, and growing research activities.
- Market Share: North America (xx%), Europe (xx%), Asia-Pacific (xx%), Rest of World (xx%) in 2025.
- Growth Potential: Asia-Pacific exhibits the highest growth potential due to the rapid expansion of its healthcare sector.
Non-Paper Based Microfluidic Chips Product Landscape
Non-paper based microfluidic chips encompass a wide range of products, from simple lab-on-a-chip devices for diagnostics to sophisticated systems integrating multiple functionalities. These chips utilize various materials, including polymers, glass, and silicon, and are designed for diverse applications, including diagnostics, drug discovery, and environmental monitoring. Key product innovations focus on improved sensitivity, miniaturization, portability, and integration with other technologies. Unique selling propositions often center around ease of use, high throughput, and cost-effectiveness. Technological advancements like 3D printing and advanced microfabrication techniques continue to drive innovation.
Key Drivers, Barriers & Challenges in Non-Paper Based Microfluidic Chips
Key Drivers:
- Rising demand for point-of-care diagnostics.
- Growing adoption of automation in various industries.
- Increasing investments in research and development.
- Advancements in microfabrication technologies.
Key Challenges:
- High initial investment costs associated with manufacturing and development.
- Stringent regulatory requirements for healthcare applications.
- Competition from traditional laboratory equipment.
- Supply chain disruptions impacting manufacturing and distribution. The estimated impact of supply chain issues on market growth in 2025 is xx%.
Emerging Opportunities in Non-paper Based Microfluidic Chips
- Expanding applications in personalized medicine and point-of-care diagnostics.
- Integration of microfluidic chips with AI and machine learning.
- Development of disposable and low-cost microfluidic devices for resource-limited settings.
- Exploration of new materials and fabrication methods to improve chip performance.
Growth Accelerators in the Non-paper Based Microfluidic Chips Industry
The market is poised for accelerated growth fueled by significant technological breakthroughs, such as the development of highly sensitive and specific biosensors integrated into microfluidic devices. Strategic partnerships between microfluidic chip manufacturers and healthcare providers are also fostering market expansion. Moreover, the ongoing expansion of microfluidic chip applications across diverse industries is contributing to market growth.
Key Players Shaping the Non-Paper Based Microfluidic Chips Market
- Agilent
- Fluidigm Corporation
- Micralyne, Inc
- Becton Dickinson
- Danaher
- PerkinElmer
- Bio-Rad Laboratories
- Dolomite
- 908 Devices
- MicroLIQUID
- MicruX Technologies
- Micronit
- Fluigent
- Enplas
- Carville
- Suzhou Wenhao Microfluidic Technology Co.,Ltd.
- Hicomp Microtech (Suzhou) Co.,Ltd
- Caliper Life Sciences(PerkinElmer)
- Illumina
- MiNAN Technologies
- BOE Technology Group Co.,Ltd.
- Tianma Microelectronics Co.,Ltd.
- Mengyiai
Notable Milestones in Non-Paper Based Microfluidic Chips Sector
- 2021: Fluidigm Corporation launched a new generation of microfluidic chips with enhanced sensitivity.
- 2022: Agilent acquired a smaller microfluidic technology company, expanding its product portfolio.
- 2023: Significant advancements in 3D-printed microfluidic chips were reported, potentially revolutionizing manufacturing processes.
- 2024: Several new applications of microfluidic chips in environmental monitoring and food safety were announced.
In-Depth Non-Paper Based Microfluidic Chips Market Outlook
The future of the non-paper based microfluidic chips market is exceptionally promising. Continued technological advancements, coupled with the rising adoption of microfluidics across diverse sectors, will drive substantial growth. Strategic partnerships and increased investments in research and development will further accelerate market expansion. The increasing demand for rapid, efficient, and cost-effective diagnostic solutions will continue to fuel market growth. Significant opportunities exist in emerging markets and untapped applications, presenting lucrative prospects for market players.
Non-paper Based Microfluidic Chips Segmentation
-
1. Application
- 1.1. Chemical Synthesis
- 1.2. Biological Analysis
- 1.3. In Vitro Diagnostics
- 1.4. Other
-
2. Types
- 2.1. Silicon-based
- 2.2. Glass-based
- 2.3. Polymer-based
Non-paper Based Microfluidic Chips Segmentation By Geography
-
1. North America
- 1.1. United States
- 1.2. Canada
- 1.3. Mexico
-
2. South America
- 2.1. Brazil
- 2.2. Argentina
- 2.3. Rest of South America
-
3. Europe
- 3.1. United Kingdom
- 3.2. Germany
- 3.3. France
- 3.4. Italy
- 3.5. Spain
- 3.6. Russia
- 3.7. Benelux
- 3.8. Nordics
- 3.9. Rest of Europe
-
4. Middle East & Africa
- 4.1. Turkey
- 4.2. Israel
- 4.3. GCC
- 4.4. North Africa
- 4.5. South Africa
- 4.6. Rest of Middle East & Africa
-
5. Asia Pacific
- 5.1. China
- 5.2. India
- 5.3. Japan
- 5.4. South Korea
- 5.5. ASEAN
- 5.6. Oceania
- 5.7. Rest of Asia Pacific
Non-paper Based Microfluidic Chips Regional Market Share
Geographic Coverage of Non-paper Based Microfluidic Chips
Non-paper Based Microfluidic Chips REPORT HIGHLIGHTS
| Aspects | Details |
|---|---|
| Study Period | 2020-2034 |
| Base Year | 2025 |
| Estimated Year | 2026 |
| Forecast Period | 2026-2034 |
| Historical Period | 2020-2025 |
| Growth Rate | CAGR of 8.3% from 2020-2034 |
| Segmentation |
|
Table of Contents
- 1. Introduction
- 1.1. Research Scope
- 1.2. Market Segmentation
- 1.3. Research Objective
- 1.4. Definitions and Assumptions
- 2. Executive Summary
- 2.1. Market Snapshot
- 3. Market Dynamics
- 3.1. Market Drivers
- 3.2. Market Restrains
- 3.3. Market Trends
- 3.4. Market Opportunities
- 4. Market Factor Analysis
- 4.1. Porters Five Forces
- 4.1.1. Bargaining Power of Suppliers
- 4.1.2. Bargaining Power of Buyers
- 4.1.3. Threat of New Entrants
- 4.1.4. Threat of Substitutes
- 4.1.5. Competitive Rivalry
- 4.2. PESTEL analysis
- 4.3. BCG Analysis
- 4.3.1. Stars (High Growth, High Market Share)
- 4.3.2. Cash Cows (Low Growth, High Market Share)
- 4.3.3. Question Mark (High Growth, Low Market Share)
- 4.3.4. Dogs (Low Growth, Low Market Share)
- 4.4. Ansoff Matrix Analysis
- 4.5. Supply Chain Analysis
- 4.6. Regulatory Landscape
- 4.7. Current Market Potential and Opportunity Assessment (TAM–SAM–SOM Framework)
- 4.8. IMR Analyst Note
- 4.1. Porters Five Forces
- 5. Market Analysis, Insights and Forecast 2021-2033
- 5.1. Market Analysis, Insights and Forecast - by Application
- 5.1.1. Chemical Synthesis
- 5.1.2. Biological Analysis
- 5.1.3. In Vitro Diagnostics
- 5.1.4. Other
- 5.2. Market Analysis, Insights and Forecast - by Types
- 5.2.1. Silicon-based
- 5.2.2. Glass-based
- 5.2.3. Polymer-based
- 5.3. Market Analysis, Insights and Forecast - by Region
- 5.3.1. North America
- 5.3.2. South America
- 5.3.3. Europe
- 5.3.4. Middle East & Africa
- 5.3.5. Asia Pacific
- 5.1. Market Analysis, Insights and Forecast - by Application
- 6. Global Non-paper Based Microfluidic Chips Analysis, Insights and Forecast, 2021-2033
- 6.1. Market Analysis, Insights and Forecast - by Application
- 6.1.1. Chemical Synthesis
- 6.1.2. Biological Analysis
- 6.1.3. In Vitro Diagnostics
- 6.1.4. Other
- 6.2. Market Analysis, Insights and Forecast - by Types
- 6.2.1. Silicon-based
- 6.2.2. Glass-based
- 6.2.3. Polymer-based
- 6.1. Market Analysis, Insights and Forecast - by Application
- 7. North America Non-paper Based Microfluidic Chips Analysis, Insights and Forecast, 2020-2032
- 7.1. Market Analysis, Insights and Forecast - by Application
- 7.1.1. Chemical Synthesis
- 7.1.2. Biological Analysis
- 7.1.3. In Vitro Diagnostics
- 7.1.4. Other
- 7.2. Market Analysis, Insights and Forecast - by Types
- 7.2.1. Silicon-based
- 7.2.2. Glass-based
- 7.2.3. Polymer-based
- 7.1. Market Analysis, Insights and Forecast - by Application
- 8. South America Non-paper Based Microfluidic Chips Analysis, Insights and Forecast, 2020-2032
- 8.1. Market Analysis, Insights and Forecast - by Application
- 8.1.1. Chemical Synthesis
- 8.1.2. Biological Analysis
- 8.1.3. In Vitro Diagnostics
- 8.1.4. Other
- 8.2. Market Analysis, Insights and Forecast - by Types
- 8.2.1. Silicon-based
- 8.2.2. Glass-based
- 8.2.3. Polymer-based
- 8.1. Market Analysis, Insights and Forecast - by Application
- 9. Europe Non-paper Based Microfluidic Chips Analysis, Insights and Forecast, 2020-2032
- 9.1. Market Analysis, Insights and Forecast - by Application
- 9.1.1. Chemical Synthesis
- 9.1.2. Biological Analysis
- 9.1.3. In Vitro Diagnostics
- 9.1.4. Other
- 9.2. Market Analysis, Insights and Forecast - by Types
- 9.2.1. Silicon-based
- 9.2.2. Glass-based
- 9.2.3. Polymer-based
- 9.1. Market Analysis, Insights and Forecast - by Application
- 10. Middle East & Africa Non-paper Based Microfluidic Chips Analysis, Insights and Forecast, 2020-2032
- 10.1. Market Analysis, Insights and Forecast - by Application
- 10.1.1. Chemical Synthesis
- 10.1.2. Biological Analysis
- 10.1.3. In Vitro Diagnostics
- 10.1.4. Other
- 10.2. Market Analysis, Insights and Forecast - by Types
- 10.2.1. Silicon-based
- 10.2.2. Glass-based
- 10.2.3. Polymer-based
- 10.1. Market Analysis, Insights and Forecast - by Application
- 11. Asia Pacific Non-paper Based Microfluidic Chips Analysis, Insights and Forecast, 2020-2032
- 11.1. Market Analysis, Insights and Forecast - by Application
- 11.1.1. Chemical Synthesis
- 11.1.2. Biological Analysis
- 11.1.3. In Vitro Diagnostics
- 11.1.4. Other
- 11.2. Market Analysis, Insights and Forecast - by Types
- 11.2.1. Silicon-based
- 11.2.2. Glass-based
- 11.2.3. Polymer-based
- 11.1. Market Analysis, Insights and Forecast - by Application
- 12. Competitive Analysis
- 12.1. Company Profiles
- 12.1.1 Agilent
- 12.1.1.1. Company Overview
- 12.1.1.2. Products
- 12.1.1.3. Company Financials
- 12.1.1.4. SWOT Analysis
- 12.1.2 Fluidigm Corporation
- 12.1.2.1. Company Overview
- 12.1.2.2. Products
- 12.1.2.3. Company Financials
- 12.1.2.4. SWOT Analysis
- 12.1.3 Micralyne
- 12.1.3.1. Company Overview
- 12.1.3.2. Products
- 12.1.3.3. Company Financials
- 12.1.3.4. SWOT Analysis
- 12.1.4 Inc
- 12.1.4.1. Company Overview
- 12.1.4.2. Products
- 12.1.4.3. Company Financials
- 12.1.4.4. SWOT Analysis
- 12.1.5 Becton Dickinson
- 12.1.5.1. Company Overview
- 12.1.5.2. Products
- 12.1.5.3. Company Financials
- 12.1.5.4. SWOT Analysis
- 12.1.6 Danaher
- 12.1.6.1. Company Overview
- 12.1.6.2. Products
- 12.1.6.3. Company Financials
- 12.1.6.4. SWOT Analysis
- 12.1.7 PerkinElmer
- 12.1.7.1. Company Overview
- 12.1.7.2. Products
- 12.1.7.3. Company Financials
- 12.1.7.4. SWOT Analysis
- 12.1.8 Bio-Rad Laboratories
- 12.1.8.1. Company Overview
- 12.1.8.2. Products
- 12.1.8.3. Company Financials
- 12.1.8.4. SWOT Analysis
- 12.1.9 Dolomite
- 12.1.9.1. Company Overview
- 12.1.9.2. Products
- 12.1.9.3. Company Financials
- 12.1.9.4. SWOT Analysis
- 12.1.10 908 Devices
- 12.1.10.1. Company Overview
- 12.1.10.2. Products
- 12.1.10.3. Company Financials
- 12.1.10.4. SWOT Analysis
- 12.1.11 MicroLIQUID
- 12.1.11.1. Company Overview
- 12.1.11.2. Products
- 12.1.11.3. Company Financials
- 12.1.11.4. SWOT Analysis
- 12.1.12 MicruX Technologies
- 12.1.12.1. Company Overview
- 12.1.12.2. Products
- 12.1.12.3. Company Financials
- 12.1.12.4. SWOT Analysis
- 12.1.13 Micronit
- 12.1.13.1. Company Overview
- 12.1.13.2. Products
- 12.1.13.3. Company Financials
- 12.1.13.4. SWOT Analysis
- 12.1.14 Fluigent
- 12.1.14.1. Company Overview
- 12.1.14.2. Products
- 12.1.14.3. Company Financials
- 12.1.14.4. SWOT Analysis
- 12.1.15 Enplas
- 12.1.15.1. Company Overview
- 12.1.15.2. Products
- 12.1.15.3. Company Financials
- 12.1.15.4. SWOT Analysis
- 12.1.16 Carville
- 12.1.16.1. Company Overview
- 12.1.16.2. Products
- 12.1.16.3. Company Financials
- 12.1.16.4. SWOT Analysis
- 12.1.17 Suzhou Wenhao Microfluidic Technology Co.
- 12.1.17.1. Company Overview
- 12.1.17.2. Products
- 12.1.17.3. Company Financials
- 12.1.17.4. SWOT Analysis
- 12.1.18 Ltd.
- 12.1.18.1. Company Overview
- 12.1.18.2. Products
- 12.1.18.3. Company Financials
- 12.1.18.4. SWOT Analysis
- 12.1.19 Hicomp Microtech (Suzhou) Co.
- 12.1.19.1. Company Overview
- 12.1.19.2. Products
- 12.1.19.3. Company Financials
- 12.1.19.4. SWOT Analysis
- 12.1.20 Ltd
- 12.1.20.1. Company Overview
- 12.1.20.2. Products
- 12.1.20.3. Company Financials
- 12.1.20.4. SWOT Analysis
- 12.1.21 Caliper Life Sciences(PerkinElmer)
- 12.1.21.1. Company Overview
- 12.1.21.2. Products
- 12.1.21.3. Company Financials
- 12.1.21.4. SWOT Analysis
- 12.1.22 Illumina
- 12.1.22.1. Company Overview
- 12.1.22.2. Products
- 12.1.22.3. Company Financials
- 12.1.22.4. SWOT Analysis
- 12.1.23 MiNAN Technologies
- 12.1.23.1. Company Overview
- 12.1.23.2. Products
- 12.1.23.3. Company Financials
- 12.1.23.4. SWOT Analysis
- 12.1.24 BOE Technology Group Co.
- 12.1.24.1. Company Overview
- 12.1.24.2. Products
- 12.1.24.3. Company Financials
- 12.1.24.4. SWOT Analysis
- 12.1.25 Ltd.
- 12.1.25.1. Company Overview
- 12.1.25.2. Products
- 12.1.25.3. Company Financials
- 12.1.25.4. SWOT Analysis
- 12.1.26 Tianma Microelectronics Co.
- 12.1.26.1. Company Overview
- 12.1.26.2. Products
- 12.1.26.3. Company Financials
- 12.1.26.4. SWOT Analysis
- 12.1.27 Ltd.
- 12.1.27.1. Company Overview
- 12.1.27.2. Products
- 12.1.27.3. Company Financials
- 12.1.27.4. SWOT Analysis
- 12.1.28 Mengyiai
- 12.1.28.1. Company Overview
- 12.1.28.2. Products
- 12.1.28.3. Company Financials
- 12.1.28.4. SWOT Analysis
- 12.1.1 Agilent
- 12.2. Market Entropy
- 12.2.1 Company's Key Areas Served
- 12.2.2 Recent Developments
- 12.3. Company Market Share Analysis 2025
- 12.3.1 Top 5 Companies Market Share Analysis
- 12.3.2 Top 3 Companies Market Share Analysis
- 12.4. List of Potential Customers
- 13. Research Methodology
List of Figures
- Figure 1: Global Non-paper Based Microfluidic Chips Revenue Breakdown (billion, %) by Region 2025 & 2033
- Figure 2: North America Non-paper Based Microfluidic Chips Revenue (billion), by Application 2025 & 2033
- Figure 3: North America Non-paper Based Microfluidic Chips Revenue Share (%), by Application 2025 & 2033
- Figure 4: North America Non-paper Based Microfluidic Chips Revenue (billion), by Types 2025 & 2033
- Figure 5: North America Non-paper Based Microfluidic Chips Revenue Share (%), by Types 2025 & 2033
- Figure 6: North America Non-paper Based Microfluidic Chips Revenue (billion), by Country 2025 & 2033
- Figure 7: North America Non-paper Based Microfluidic Chips Revenue Share (%), by Country 2025 & 2033
- Figure 8: South America Non-paper Based Microfluidic Chips Revenue (billion), by Application 2025 & 2033
- Figure 9: South America Non-paper Based Microfluidic Chips Revenue Share (%), by Application 2025 & 2033
- Figure 10: South America Non-paper Based Microfluidic Chips Revenue (billion), by Types 2025 & 2033
- Figure 11: South America Non-paper Based Microfluidic Chips Revenue Share (%), by Types 2025 & 2033
- Figure 12: South America Non-paper Based Microfluidic Chips Revenue (billion), by Country 2025 & 2033
- Figure 13: South America Non-paper Based Microfluidic Chips Revenue Share (%), by Country 2025 & 2033
- Figure 14: Europe Non-paper Based Microfluidic Chips Revenue (billion), by Application 2025 & 2033
- Figure 15: Europe Non-paper Based Microfluidic Chips Revenue Share (%), by Application 2025 & 2033
- Figure 16: Europe Non-paper Based Microfluidic Chips Revenue (billion), by Types 2025 & 2033
- Figure 17: Europe Non-paper Based Microfluidic Chips Revenue Share (%), by Types 2025 & 2033
- Figure 18: Europe Non-paper Based Microfluidic Chips Revenue (billion), by Country 2025 & 2033
- Figure 19: Europe Non-paper Based Microfluidic Chips Revenue Share (%), by Country 2025 & 2033
- Figure 20: Middle East & Africa Non-paper Based Microfluidic Chips Revenue (billion), by Application 2025 & 2033
- Figure 21: Middle East & Africa Non-paper Based Microfluidic Chips Revenue Share (%), by Application 2025 & 2033
- Figure 22: Middle East & Africa Non-paper Based Microfluidic Chips Revenue (billion), by Types 2025 & 2033
- Figure 23: Middle East & Africa Non-paper Based Microfluidic Chips Revenue Share (%), by Types 2025 & 2033
- Figure 24: Middle East & Africa Non-paper Based Microfluidic Chips Revenue (billion), by Country 2025 & 2033
- Figure 25: Middle East & Africa Non-paper Based Microfluidic Chips Revenue Share (%), by Country 2025 & 2033
- Figure 26: Asia Pacific Non-paper Based Microfluidic Chips Revenue (billion), by Application 2025 & 2033
- Figure 27: Asia Pacific Non-paper Based Microfluidic Chips Revenue Share (%), by Application 2025 & 2033
- Figure 28: Asia Pacific Non-paper Based Microfluidic Chips Revenue (billion), by Types 2025 & 2033
- Figure 29: Asia Pacific Non-paper Based Microfluidic Chips Revenue Share (%), by Types 2025 & 2033
- Figure 30: Asia Pacific Non-paper Based Microfluidic Chips Revenue (billion), by Country 2025 & 2033
- Figure 31: Asia Pacific Non-paper Based Microfluidic Chips Revenue Share (%), by Country 2025 & 2033
List of Tables
- Table 1: Global Non-paper Based Microfluidic Chips Revenue billion Forecast, by Application 2020 & 2033
- Table 2: Global Non-paper Based Microfluidic Chips Revenue billion Forecast, by Types 2020 & 2033
- Table 3: Global Non-paper Based Microfluidic Chips Revenue billion Forecast, by Region 2020 & 2033
- Table 4: Global Non-paper Based Microfluidic Chips Revenue billion Forecast, by Application 2020 & 2033
- Table 5: Global Non-paper Based Microfluidic Chips Revenue billion Forecast, by Types 2020 & 2033
- Table 6: Global Non-paper Based Microfluidic Chips Revenue billion Forecast, by Country 2020 & 2033
- Table 7: United States Non-paper Based Microfluidic Chips Revenue (billion) Forecast, by Application 2020 & 2033
- Table 8: Canada Non-paper Based Microfluidic Chips Revenue (billion) Forecast, by Application 2020 & 2033
- Table 9: Mexico Non-paper Based Microfluidic Chips Revenue (billion) Forecast, by Application 2020 & 2033
- Table 10: Global Non-paper Based Microfluidic Chips Revenue billion Forecast, by Application 2020 & 2033
- Table 11: Global Non-paper Based Microfluidic Chips Revenue billion Forecast, by Types 2020 & 2033
- Table 12: Global Non-paper Based Microfluidic Chips Revenue billion Forecast, by Country 2020 & 2033
- Table 13: Brazil Non-paper Based Microfluidic Chips Revenue (billion) Forecast, by Application 2020 & 2033
- Table 14: Argentina Non-paper Based Microfluidic Chips Revenue (billion) Forecast, by Application 2020 & 2033
- Table 15: Rest of South America Non-paper Based Microfluidic Chips Revenue (billion) Forecast, by Application 2020 & 2033
- Table 16: Global Non-paper Based Microfluidic Chips Revenue billion Forecast, by Application 2020 & 2033
- Table 17: Global Non-paper Based Microfluidic Chips Revenue billion Forecast, by Types 2020 & 2033
- Table 18: Global Non-paper Based Microfluidic Chips Revenue billion Forecast, by Country 2020 & 2033
- Table 19: United Kingdom Non-paper Based Microfluidic Chips Revenue (billion) Forecast, by Application 2020 & 2033
- Table 20: Germany Non-paper Based Microfluidic Chips Revenue (billion) Forecast, by Application 2020 & 2033
- Table 21: France Non-paper Based Microfluidic Chips Revenue (billion) Forecast, by Application 2020 & 2033
- Table 22: Italy Non-paper Based Microfluidic Chips Revenue (billion) Forecast, by Application 2020 & 2033
- Table 23: Spain Non-paper Based Microfluidic Chips Revenue (billion) Forecast, by Application 2020 & 2033
- Table 24: Russia Non-paper Based Microfluidic Chips Revenue (billion) Forecast, by Application 2020 & 2033
- Table 25: Benelux Non-paper Based Microfluidic Chips Revenue (billion) Forecast, by Application 2020 & 2033
- Table 26: Nordics Non-paper Based Microfluidic Chips Revenue (billion) Forecast, by Application 2020 & 2033
- Table 27: Rest of Europe Non-paper Based Microfluidic Chips Revenue (billion) Forecast, by Application 2020 & 2033
- Table 28: Global Non-paper Based Microfluidic Chips Revenue billion Forecast, by Application 2020 & 2033
- Table 29: Global Non-paper Based Microfluidic Chips Revenue billion Forecast, by Types 2020 & 2033
- Table 30: Global Non-paper Based Microfluidic Chips Revenue billion Forecast, by Country 2020 & 2033
- Table 31: Turkey Non-paper Based Microfluidic Chips Revenue (billion) Forecast, by Application 2020 & 2033
- Table 32: Israel Non-paper Based Microfluidic Chips Revenue (billion) Forecast, by Application 2020 & 2033
- Table 33: GCC Non-paper Based Microfluidic Chips Revenue (billion) Forecast, by Application 2020 & 2033
- Table 34: North Africa Non-paper Based Microfluidic Chips Revenue (billion) Forecast, by Application 2020 & 2033
- Table 35: South Africa Non-paper Based Microfluidic Chips Revenue (billion) Forecast, by Application 2020 & 2033
- Table 36: Rest of Middle East & Africa Non-paper Based Microfluidic Chips Revenue (billion) Forecast, by Application 2020 & 2033
- Table 37: Global Non-paper Based Microfluidic Chips Revenue billion Forecast, by Application 2020 & 2033
- Table 38: Global Non-paper Based Microfluidic Chips Revenue billion Forecast, by Types 2020 & 2033
- Table 39: Global Non-paper Based Microfluidic Chips Revenue billion Forecast, by Country 2020 & 2033
- Table 40: China Non-paper Based Microfluidic Chips Revenue (billion) Forecast, by Application 2020 & 2033
- Table 41: India Non-paper Based Microfluidic Chips Revenue (billion) Forecast, by Application 2020 & 2033
- Table 42: Japan Non-paper Based Microfluidic Chips Revenue (billion) Forecast, by Application 2020 & 2033
- Table 43: South Korea Non-paper Based Microfluidic Chips Revenue (billion) Forecast, by Application 2020 & 2033
- Table 44: ASEAN Non-paper Based Microfluidic Chips Revenue (billion) Forecast, by Application 2020 & 2033
- Table 45: Oceania Non-paper Based Microfluidic Chips Revenue (billion) Forecast, by Application 2020 & 2033
- Table 46: Rest of Asia Pacific Non-paper Based Microfluidic Chips Revenue (billion) Forecast, by Application 2020 & 2033
Frequently Asked Questions
1. What is the projected Compound Annual Growth Rate (CAGR) of the Non-paper Based Microfluidic Chips?
The projected CAGR is approximately 8.3%.
2. Which companies are prominent players in the Non-paper Based Microfluidic Chips?
Key companies in the market include Agilent, Fluidigm Corporation, Micralyne, Inc, Becton Dickinson, Danaher, PerkinElmer, Bio-Rad Laboratories, Dolomite, 908 Devices, MicroLIQUID, MicruX Technologies, Micronit, Fluigent, Enplas, Carville, Suzhou Wenhao Microfluidic Technology Co., Ltd., Hicomp Microtech (Suzhou) Co., Ltd, Caliper Life Sciences(PerkinElmer), Illumina, MiNAN Technologies, BOE Technology Group Co., Ltd., Tianma Microelectronics Co., Ltd., Mengyiai.
3. What are the main segments of the Non-paper Based Microfluidic Chips?
The market segments include Application, Types.
4. Can you provide details about the market size?
The market size is estimated to be USD 24.96 billion as of 2022.
5. What are some drivers contributing to market growth?
N/A
6. What are the notable trends driving market growth?
N/A
7. Are there any restraints impacting market growth?
N/A
8. Can you provide examples of recent developments in the market?
N/A
9. What pricing options are available for accessing the report?
Pricing options include single-user, multi-user, and enterprise licenses priced at USD 4900.00, USD 7350.00, and USD 9800.00 respectively.
10. Is the market size provided in terms of value or volume?
The market size is provided in terms of value, measured in billion.
11. Are there any specific market keywords associated with the report?
Yes, the market keyword associated with the report is "Non-paper Based Microfluidic Chips," which aids in identifying and referencing the specific market segment covered.
12. How do I determine which pricing option suits my needs best?
The pricing options vary based on user requirements and access needs. Individual users may opt for single-user licenses, while businesses requiring broader access may choose multi-user or enterprise licenses for cost-effective access to the report.
13. Are there any additional resources or data provided in the Non-paper Based Microfluidic Chips report?
While the report offers comprehensive insights, it's advisable to review the specific contents or supplementary materials provided to ascertain if additional resources or data are available.
14. How can I stay updated on further developments or reports in the Non-paper Based Microfluidic Chips?
To stay informed about further developments, trends, and reports in the Non-paper Based Microfluidic Chips, consider subscribing to industry newsletters, following relevant companies and organizations, or regularly checking reputable industry news sources and publications.
Methodology
Step 1 - Identification of Relevant Samples Size from Population Database


Step 2 - Approaches for Defining Global Market Size (Value, Volume* & Price*)

Note*: In applicable scenarios
Step 3 - Data Sources
Primary Research
- Web Analytics
- Survey Reports
- Research Institute
- Latest Research Reports
- Opinion Leaders
Secondary Research
- Annual Reports
- White Paper
- Latest Press Release
- Industry Association
- Paid Database
- Investor Presentations

Step 4 - Data Triangulation
Involves using different sources of information in order to increase the validity of a study
These sources are likely to be stakeholders in a program - participants, other researchers, program staff, other community members, and so on.
Then we put all data in single framework & apply various statistical tools to find out the dynamic on the market.
During the analysis stage, feedback from the stakeholder groups would be compared to determine areas of agreement as well as areas of divergence