

Key Insights
The global Power Connection Box market is poised for robust growth, projected to reach an estimated $4563 million in 2025. This expansion is driven by a compound annual growth rate (CAGR) of 8.3% throughout the forecast period of 2025-2033. This significant market size and strong growth trajectory are largely attributed to the increasing demand for sophisticated electrical systems in burgeoning sectors such as automotive, industrial automation, and renewable energy infrastructure. The automotive industry, in particular, is a key contributor, with the proliferation of electric vehicles (EVs) and advanced driver-assistance systems (ADAS) necessitating more complex and reliable power distribution solutions. Industrial automation, characterized by the rise of smart factories and the Internet of Things (IoT), also requires highly integrated power connection boxes for seamless operation and data transmission. Furthermore, the expansion of renewable energy projects, including solar and wind farms, demands robust power management systems, further fueling market expansion. Emerging economies are expected to witness accelerated adoption rates due to increasing industrialization and infrastructural development, presenting substantial opportunities for market players.
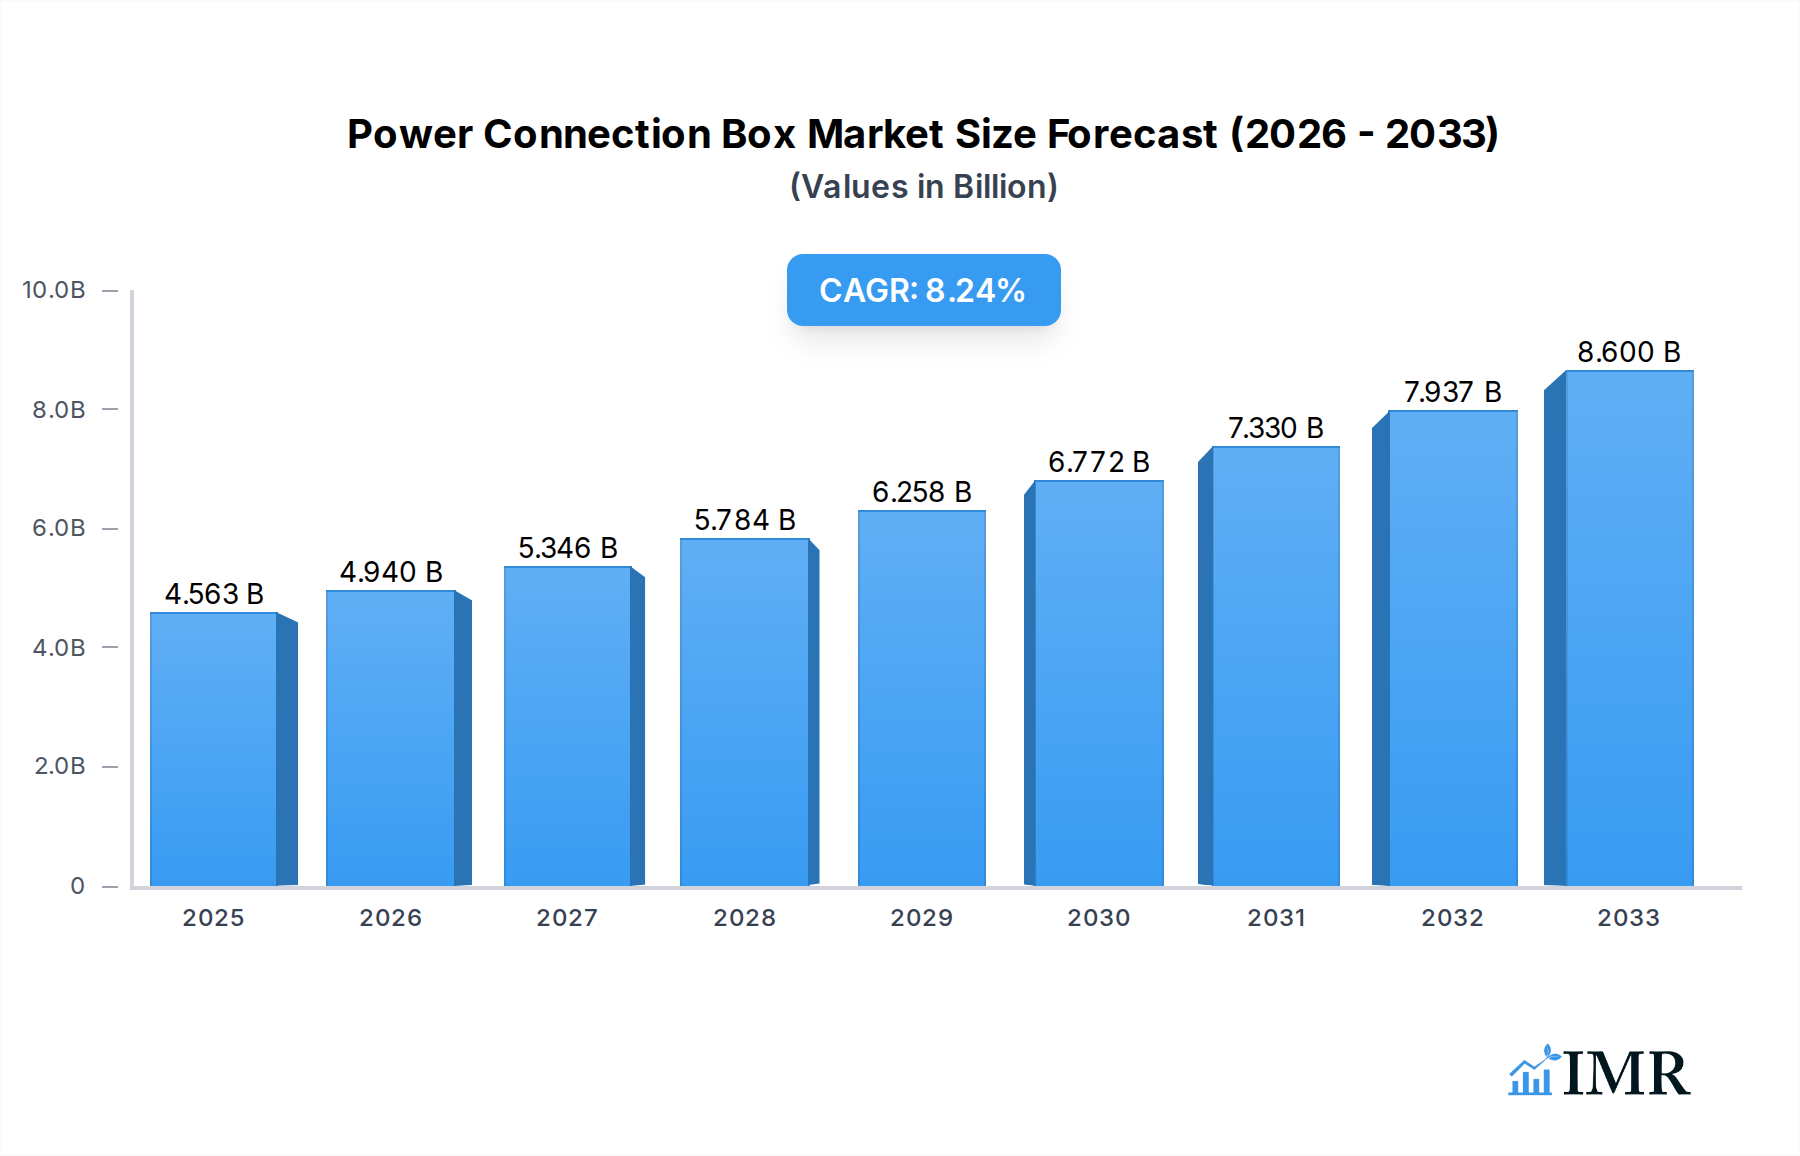
Power Connection Box Market Size (In Billion)
Despite the promising outlook, certain factors may influence the market's trajectory. Potential restraints could include stringent regulatory compliances for electrical components, the cost associated with advanced materials and manufacturing processes, and intense competition among established players and emerging entrants. However, the market is also characterized by significant technological advancements, including miniaturization, enhanced durability, and integration of smart functionalities, which are expected to drive innovation and offset some of these challenges. Key players like TE Connectivity, Amphenol, Molex, Delphi, Yazaki, and Sumitomo are continuously investing in research and development to introduce cutting-edge solutions, catering to the evolving needs of various end-use applications. The market segmentation by application (e.g., automotive, industrial, telecommunications) and type (e.g., sealed, unsealed) will likely see varied growth rates, with automotive and industrial segments anticipated to lead the charge. Regional dynamics, particularly in North America and Europe, will remain crucial, while Asia Pacific is expected to emerge as a significant growth hub.

Power Connection Box Company Market Share
Power Connection Box Market Report: Navigating the Future of Electrical Connectivity (2019-2033)
This comprehensive report provides an in-depth analysis of the global Power Connection Box market, a critical component in diverse electrical systems. Spanning the historical period of 2019-2024, the base year of 2025, and a robust forecast period from 2025 to 2033, this study leverages advanced market intelligence to offer actionable insights. We dissect market dynamics, growth trajectories, regional dominance, product innovations, and the strategic landscape for industry stakeholders. The report employs a meticulous methodology, with all quantitative values presented in million units for clarity and industry relevance.
Power Connection Box Market Dynamics & Structure
The Power Connection Box market exhibits a moderately concentrated structure, with leading players like TE Connectivity, Amphenol, and Molex holding significant market shares. Technological innovation serves as a primary driver, fueled by the increasing demand for miniaturization, enhanced thermal management, and higher power density in applications ranging from electric vehicles to renewable energy infrastructure. Regulatory frameworks, particularly those mandating safety standards and environmental compliance, play a crucial role in shaping product development and market entry. Competitive product substitutes, such as direct wiring solutions and integrated busbars, pose a challenge but are often outmaneuvered by the flexibility and modularity offered by power connection boxes. End-user demographics are shifting towards industries with high electrical demand and a focus on efficiency and sustainability. Mergers and acquisitions (M&A) are a notable trend, with companies consolidating to expand their product portfolios and geographical reach. For instance, recent M&A activity has seen a surge in consolidation within the automotive and industrial automation segments, accounting for approximately 15 M&A deals in the last two years, with an estimated value of $XXX million. Innovation barriers include the high cost of advanced material research and the complexity of developing solutions that meet stringent global electrical standards.
- Market Concentration: Moderately concentrated, with key players dominating market share.
- Technological Innovation Drivers: Miniaturization, enhanced thermal management, higher power density, electrification trends.
- Regulatory Frameworks: Evolving safety standards (e.g., UL, CE), environmental regulations (e.g., RoHS, REACH).
- Competitive Product Substitutes: Direct wiring, integrated busbars, specialized connectors.
- End-User Demographics: Growing adoption in electric vehicles, renewable energy, industrial automation, and telecommunications.
- M&A Trends: Strategic acquisitions to expand product offerings and market presence, particularly in automotive and industrial sectors.
- Innovation Barriers: High R&D costs, complex certification processes, material science challenges.
Power Connection Box Growth Trends & Insights
The global Power Connection Box market is poised for substantial growth, driven by the relentless march of electrification across multiple industries. The market size is projected to expand from an estimated $X,XXX million in the base year of 2025 to a commanding $Y,YYY million by the forecast year of 2033, signifying a Compound Annual Growth Rate (CAGR) of approximately XX.X% during the forecast period. This robust expansion is underpinned by escalating adoption rates in key segments such as electric vehicles (EVs), where the demand for sophisticated and reliable power distribution systems is paramount. Technological disruptions, particularly in advanced materials and intelligent connectivity, are further accelerating market penetration. The increasing sophistication of power management systems within EVs, for instance, necessitates highly integrated and efficient power connection boxes, leading to a projected XX% increase in EV-related power connection box installations by 2030. Consumer behavior shifts are also influencing this growth; end-users are increasingly prioritizing safety, reliability, and the ability to accommodate future technological upgrades, factors that power connection boxes are well-positioned to address. The growing trend towards vehicle-to-grid (V2G) technology will further necessitate advanced power connection solutions, creating new avenues for market expansion. The industrial automation sector, driven by the Industry 4.0 revolution, is witnessing a surge in demand for modular and scalable power distribution, directly benefiting the power connection box market. In renewable energy, particularly solar and wind installations, efficient and durable power connection boxes are crucial for managing high-voltage direct current (HVDC) and alternating current (AC) power flows, contributing significantly to market growth. The telecommunications industry, with its ongoing 5G deployment and data center expansion, also presents a substantial opportunity, requiring robust and high-capacity power distribution solutions. The shift towards decentralized power generation and microgrids further amplifies the need for flexible and resilient power connection box solutions. The increasing complexity of electronic systems in modern machinery and equipment necessitates solutions that can efficiently manage multiple power inputs and outputs, a core competency of advanced power connection boxes. The market is also seeing a growing demand for customized power connection box solutions tailored to specific application requirements, moving beyond standard offerings. This trend is supported by advancements in design and manufacturing technologies that allow for greater customization at competitive costs.
Dominant Regions, Countries, or Segments in Power Connection Box
The Automotive Application segment, particularly within the Electric Vehicle (EV) sub-segment, is identified as the dominant force driving growth in the global Power Connection Box market. This dominance is fueled by several interconnected factors, including aggressive government policies promoting EV adoption, substantial investments in charging infrastructure, and the inherent need for advanced electrical architectures in electric powertrains. Within the automotive application, North America and Europe currently lead in EV adoption, with projected market shares of approximately XX% and YY% respectively in the overall power connection box market by 2025. The United States, driven by federal incentives and robust state-level initiatives, is expected to remain a key market for EV-related power connection boxes, with an estimated market penetration of XX% in new vehicle sales by 2030. Germany, France, and the UK are also significant contributors due to strong regulatory push and consumer demand for sustainable transportation.
The burgeoning Type: High-Power Connection Box segment within the broader power connection box market is also exhibiting exceptional growth, directly correlating with the increasing power requirements of EVs and industrial machinery. The need for efficient and safe distribution of high voltages (e.g., 400V to 800V and beyond) in EVs, along with the growing capacity demands in data centers and renewable energy systems, is propelling the demand for these specialized connection boxes. China's aggressive push towards electric mobility and its position as a global manufacturing hub for automotive components further solidify its importance in this segment, contributing an estimated ZZ% to the global high-power connection box market by 2025. The economic policies in these dominant regions, such as tax credits for EV purchases and investments in renewable energy projects, are directly stimulating the demand for sophisticated power connection boxes. Infrastructure development, including the expansion of charging networks and the modernization of industrial facilities, creates a continuous need for these essential components. The market share of the automotive application segment is projected to reach XX% of the total power connection box market by 2025, and this share is expected to grow to YY% by 2033, highlighting its pivotal role. The inherent growth potential within these applications, coupled with ongoing technological advancements, ensures their continued dominance.
- Dominant Application: Automotive (especially Electric Vehicles)
- Key Drivers: Government incentives for EV adoption, expanding charging infrastructure, increasing vehicle electrification, demand for integrated power management systems.
- Market Share Contribution: Projected to account for approximately XX% of the global market by 2025.
- Regional Leaders: North America (US), Europe (Germany, France, UK), Asia-Pacific (China).
- Dominant Type: High-Power Connection Box
- Key Drivers: Rising voltage requirements in EVs, increasing power demands in data centers and industrial applications, need for efficient and safe high-voltage distribution.
- Growth Potential: Expected to witness a CAGR of XX.X% during the forecast period.
- Technological Advancements: Development of advanced materials for thermal management and insulation.
Power Connection Box Product Landscape
The Power Connection Box product landscape is characterized by a steady stream of innovations focused on enhancing performance, safety, and versatility. Key advancements include the development of compact and lightweight designs that are crucial for weight-sensitive applications like electric vehicles, with some new designs reducing weight by up to XX%. Enhanced thermal management solutions, incorporating advanced heat sinks and conductive materials, are enabling higher power densities without compromising reliability. Product innovations are also centered on modularity, allowing for easy integration and customization to meet diverse application needs, with a focus on plug-and-play capabilities. The integration of smart features, such as sensors for monitoring temperature and current, is emerging as a significant trend, offering predictive maintenance capabilities and improved system diagnostics. The use of high-performance materials, including specialized polymers and corrosion-resistant alloys, is improving the durability and longevity of power connection boxes in harsh environments. Unique selling propositions often revolve around superior electrical insulation, high ingress protection (IP) ratings for water and dust resistance, and robust mechanical integrity to withstand vibrations and shock. Technological advancements are continuously pushing the boundaries of voltage and current handling capacities, catering to the evolving demands of high-power applications.
Key Drivers, Barriers & Challenges in Power Connection Box
Key Drivers:
- Electrification of Transportation: The exponential growth of electric vehicles is the primary market catalyst, demanding sophisticated and reliable power distribution.
- Renewable Energy Expansion: Increasing deployment of solar, wind, and other renewable sources requires robust power connection solutions for grid integration.
- Industrial Automation & IoT: The rise of Industry 4.0 and the Internet of Things (IoT) drives demand for modular and intelligent power distribution in manufacturing and logistics.
- Advancements in Electronics: Miniaturization and increasing power density in electronic devices necessitate compact and efficient power connection solutions.
- Government Regulations & Incentives: Favorable policies promoting electrification and renewable energy adoption significantly boost market demand.
Barriers & Challenges:
- Supply Chain Volatility: Disruptions in the supply of critical raw materials and components can impact production timelines and costs, with recent disruptions leading to an average cost increase of XX% for key materials.
- Stringent Safety & Regulatory Standards: Meeting diverse and evolving international safety and environmental standards (e.g., UL, CE, RoHS) requires significant investment and testing, adding to product development costs.
- High R&D Investment: Developing advanced materials, miniaturized designs, and smart features necessitates substantial research and development expenditure.
- Intense Competition: The market features a mix of established global players and emerging regional manufacturers, leading to price pressures and the need for continuous innovation.
- Integration Complexity: Ensuring seamless integration with existing electrical systems and powertrains can be a technical challenge, requiring extensive testing and validation.
Emerging Opportunities in Power Connection Box
Emerging opportunities in the Power Connection Box market lie in the integration of advanced sensor technology for real-time diagnostics and predictive maintenance. This trend, driven by the burgeoning Industrial Internet of Things (IIoT) and the increasing complexity of electrical systems, allows for proactive identification of potential failures, thereby enhancing system uptime and reducing maintenance costs. Another significant opportunity is in the development of lightweight and high-strength composite materials that can withstand extreme temperatures and harsh environmental conditions, particularly relevant for aerospace and defense applications. Furthermore, the growing demand for customized and modular power connection solutions tailored to specific niche applications, such as advanced robotics and specialized medical equipment, presents a lucrative avenue for growth. The expansion of smart grids and microgrid technologies also opens up new possibilities for power connection boxes that can efficiently manage decentralized energy sources and provide robust grid stability.
Growth Accelerators in the Power Connection Box Industry
Several key catalysts are accelerating growth in the Power Connection Box industry. Technological breakthroughs in material science, leading to the development of more durable, heat-resistant, and lightweight materials, are crucial. Strategic partnerships between power connection box manufacturers and original equipment manufacturers (OEMs) in the automotive and renewable energy sectors are fostering collaborative innovation and ensuring market alignment. Furthermore, strategic market expansion into emerging economies with rapidly developing industrial bases and increasing adoption of electric mobility presents significant growth potential. The continuous drive for miniaturization and higher power density, coupled with the increasing demand for smart and connected solutions, is also a major growth accelerator. Investments in R&D to develop next-generation connection technologies that can handle higher voltages and currents are vital for sustained growth.
Key Players Shaping the Power Connection Box Market
- Magtrol
- TE Connectivity
- Amphenol
- Molex
- Delphi
- Yazaki
- Sumitomo
- JST
- Deutsch
- FCI
- Hirose
Notable Milestones in Power Connection Box Sector
- 2019: TE Connectivity launches a new series of compact, high-voltage connection boxes for electric vehicles, addressing the growing demand for space-saving solutions.
- 2020: Amphenol acquires a leading manufacturer of specialized connectors for industrial automation, expanding its portfolio in this key growth segment.
- 2021: Molex introduces innovative thermal management solutions for power connection boxes, enhancing reliability in high-temperature applications.
- 2022: Delphi Technologies (now part of BorgWarner) showcases advanced power distribution modules for next-generation electric powertrains, highlighting integrated power connection solutions.
- 2023: Yazaki expands its production capacity for automotive wiring harnesses and connection systems to meet the surging demand from EV manufacturers globally.
- 2024 (Q1): Sumitomo Electric Industries announces a breakthrough in high-performance insulation materials for power connection boxes, enabling higher voltage ratings.
- 2024 (Q2): JST Corporation releases a new line of robust power connectors designed for harsh industrial environments, featuring enhanced sealing and vibration resistance.
In-Depth Power Connection Box Market Outlook
The future of the Power Connection Box market is exceptionally bright, driven by sustained electrification trends across multiple sectors. Growth accelerators like advancements in material science, strategic collaborations with key industry players, and proactive market penetration into high-potential emerging economies will continue to propel expansion. The increasing demand for compact, high-performance, and intelligent power distribution solutions, particularly in electric vehicles and renewable energy infrastructure, presents significant strategic opportunities. The industry is poised for continued innovation, focusing on enhanced safety, reliability, and integration capabilities, ensuring its indispensable role in the evolving electrical landscape.
Power Connection Box Segmentation
-
1. Application
- 1.1. undefined
-
2. Type
- 2.1. undefined
Power Connection Box Segmentation By Geography
- 1. undefined
- 2. undefined
- 3. undefined
- 4. undefined
- 5. undefined
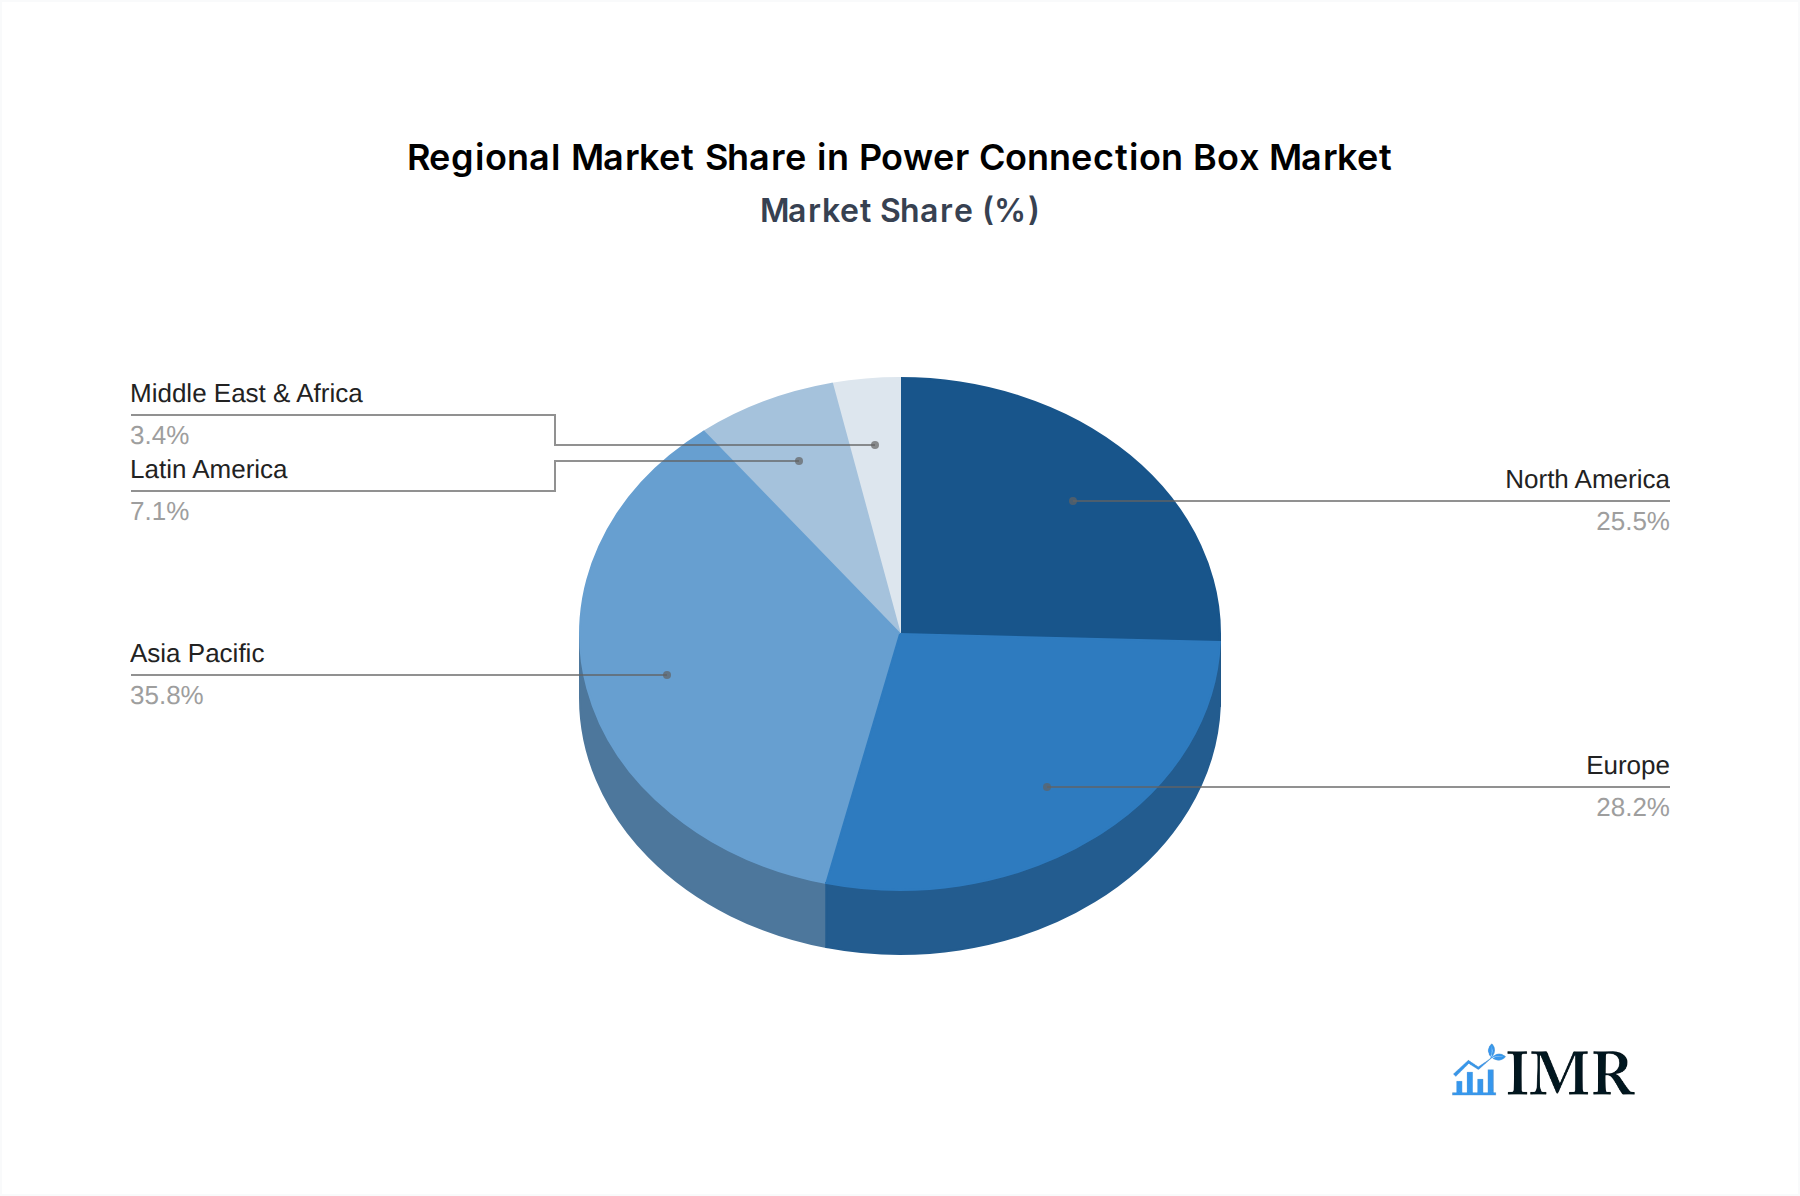
Power Connection Box Regional Market Share
Geographic Coverage of Power Connection Box
Power Connection Box REPORT HIGHLIGHTS
| Aspects | Details |
|---|---|
| Study Period | 2020-2034 |
| Base Year | 2025 |
| Estimated Year | 2026 |
| Forecast Period | 2026-2034 |
| Historical Period | 2020-2025 |
| Growth Rate | CAGR of 8.3% from 2020-2034 |
| Segmentation |
|
Table of Contents
- 1. Introduction
- 1.1. Research Scope
- 1.2. Market Segmentation
- 1.3. Research Objective
- 1.4. Definitions and Assumptions
- 2. Executive Summary
- 2.1. Market Snapshot
- 3. Market Dynamics
- 3.1. Market Drivers
- 3.2. Market Restrains
- 3.3. Market Trends
- 3.4. Market Opportunities
- 4. Market Factor Analysis
- 4.1. Porters Five Forces
- 4.1.1. Bargaining Power of Suppliers
- 4.1.2. Bargaining Power of Buyers
- 4.1.3. Threat of New Entrants
- 4.1.4. Threat of Substitutes
- 4.1.5. Competitive Rivalry
- 4.2. PESTEL analysis
- 4.3. BCG Analysis
- 4.3.1. Stars (High Growth, High Market Share)
- 4.3.2. Cash Cows (Low Growth, High Market Share)
- 4.3.3. Question Mark (High Growth, Low Market Share)
- 4.3.4. Dogs (Low Growth, Low Market Share)
- 4.4. Ansoff Matrix Analysis
- 4.5. Supply Chain Analysis
- 4.6. Regulatory Landscape
- 4.7. Current Market Potential and Opportunity Assessment (TAM–SAM–SOM Framework)
- 4.8. IMR Analyst Note
- 4.1. Porters Five Forces
- 5. Market Analysis, Insights and Forecast 2021-2033
- 5.1. Market Analysis, Insights and Forecast - by Application
- 5.1.1.
- 5.2. Market Analysis, Insights and Forecast - by Type
- 5.2.1.
- 5.3. Market Analysis, Insights and Forecast - by Region
- 5.3.1.
- 5.3.2.
- 5.3.3.
- 5.3.4.
- 5.3.5.
- 5.1. Market Analysis, Insights and Forecast - by Application
- 6. Global Power Connection Box Analysis, Insights and Forecast, 2021-2033
- 6.1. Market Analysis, Insights and Forecast - by Application
- 6.1.1.
- 6.2. Market Analysis, Insights and Forecast - by Type
- 6.2.1.
- 6.1. Market Analysis, Insights and Forecast - by Application
- 7. undefined Power Connection Box Analysis, Insights and Forecast, 2020-2032
- 7.1. Market Analysis, Insights and Forecast - by Application
- 7.1.1.
- 7.2. Market Analysis, Insights and Forecast - by Type
- 7.2.1.
- 7.1. Market Analysis, Insights and Forecast - by Application
- 8. undefined Power Connection Box Analysis, Insights and Forecast, 2020-2032
- 8.1. Market Analysis, Insights and Forecast - by Application
- 8.1.1.
- 8.2. Market Analysis, Insights and Forecast - by Type
- 8.2.1.
- 8.1. Market Analysis, Insights and Forecast - by Application
- 9. undefined Power Connection Box Analysis, Insights and Forecast, 2020-2032
- 9.1. Market Analysis, Insights and Forecast - by Application
- 9.1.1.
- 9.2. Market Analysis, Insights and Forecast - by Type
- 9.2.1.
- 9.1. Market Analysis, Insights and Forecast - by Application
- 10. undefined Power Connection Box Analysis, Insights and Forecast, 2020-2032
- 10.1. Market Analysis, Insights and Forecast - by Application
- 10.1.1.
- 10.2. Market Analysis, Insights and Forecast - by Type
- 10.2.1.
- 10.1. Market Analysis, Insights and Forecast - by Application
- 11. undefined Power Connection Box Analysis, Insights and Forecast, 2020-2032
- 11.1. Market Analysis, Insights and Forecast - by Application
- 11.1.1.
- 11.2. Market Analysis, Insights and Forecast - by Type
- 11.2.1.
- 11.1. Market Analysis, Insights and Forecast - by Application
- 12. Competitive Analysis
- 12.1. Company Profiles
- 12.1.1 Magtrol
- 12.1.1.1. Company Overview
- 12.1.1.2. Products
- 12.1.1.3. Company Financials
- 12.1.1.4. SWOT Analysis
- 12.1.2 TE Connectivity
- 12.1.2.1. Company Overview
- 12.1.2.2. Products
- 12.1.2.3. Company Financials
- 12.1.2.4. SWOT Analysis
- 12.1.3 Amphenol
- 12.1.3.1. Company Overview
- 12.1.3.2. Products
- 12.1.3.3. Company Financials
- 12.1.3.4. SWOT Analysis
- 12.1.4 Molex
- 12.1.4.1. Company Overview
- 12.1.4.2. Products
- 12.1.4.3. Company Financials
- 12.1.4.4. SWOT Analysis
- 12.1.5 Delphi
- 12.1.5.1. Company Overview
- 12.1.5.2. Products
- 12.1.5.3. Company Financials
- 12.1.5.4. SWOT Analysis
- 12.1.6 Yazaki
- 12.1.6.1. Company Overview
- 12.1.6.2. Products
- 12.1.6.3. Company Financials
- 12.1.6.4. SWOT Analysis
- 12.1.7 Sumitomo
- 12.1.7.1. Company Overview
- 12.1.7.2. Products
- 12.1.7.3. Company Financials
- 12.1.7.4. SWOT Analysis
- 12.1.8 JST
- 12.1.8.1. Company Overview
- 12.1.8.2. Products
- 12.1.8.3. Company Financials
- 12.1.8.4. SWOT Analysis
- 12.1.9 Deutsch
- 12.1.9.1. Company Overview
- 12.1.9.2. Products
- 12.1.9.3. Company Financials
- 12.1.9.4. SWOT Analysis
- 12.1.10 FCI
- 12.1.10.1. Company Overview
- 12.1.10.2. Products
- 12.1.10.3. Company Financials
- 12.1.10.4. SWOT Analysis
- 12.1.11 Hirose
- 12.1.11.1. Company Overview
- 12.1.11.2. Products
- 12.1.11.3. Company Financials
- 12.1.11.4. SWOT Analysis
- 12.1.1 Magtrol
- 12.2. Market Entropy
- 12.2.1 Company's Key Areas Served
- 12.2.2 Recent Developments
- 12.3. Company Market Share Analysis 2025
- 12.3.1 Top 5 Companies Market Share Analysis
- 12.3.2 Top 3 Companies Market Share Analysis
- 12.4. List of Potential Customers
- 13. Research Methodology
List of Figures
- Figure 1: Global Power Connection Box Revenue Breakdown (million, %) by Region 2025 & 2033
- Figure 2: undefined Power Connection Box Revenue (million), by Application 2025 & 2033
- Figure 3: undefined Power Connection Box Revenue Share (%), by Application 2025 & 2033
- Figure 4: undefined Power Connection Box Revenue (million), by Type 2025 & 2033
- Figure 5: undefined Power Connection Box Revenue Share (%), by Type 2025 & 2033
- Figure 6: undefined Power Connection Box Revenue (million), by Country 2025 & 2033
- Figure 7: undefined Power Connection Box Revenue Share (%), by Country 2025 & 2033
- Figure 8: undefined Power Connection Box Revenue (million), by Application 2025 & 2033
- Figure 9: undefined Power Connection Box Revenue Share (%), by Application 2025 & 2033
- Figure 10: undefined Power Connection Box Revenue (million), by Type 2025 & 2033
- Figure 11: undefined Power Connection Box Revenue Share (%), by Type 2025 & 2033
- Figure 12: undefined Power Connection Box Revenue (million), by Country 2025 & 2033
- Figure 13: undefined Power Connection Box Revenue Share (%), by Country 2025 & 2033
- Figure 14: undefined Power Connection Box Revenue (million), by Application 2025 & 2033
- Figure 15: undefined Power Connection Box Revenue Share (%), by Application 2025 & 2033
- Figure 16: undefined Power Connection Box Revenue (million), by Type 2025 & 2033
- Figure 17: undefined Power Connection Box Revenue Share (%), by Type 2025 & 2033
- Figure 18: undefined Power Connection Box Revenue (million), by Country 2025 & 2033
- Figure 19: undefined Power Connection Box Revenue Share (%), by Country 2025 & 2033
- Figure 20: undefined Power Connection Box Revenue (million), by Application 2025 & 2033
- Figure 21: undefined Power Connection Box Revenue Share (%), by Application 2025 & 2033
- Figure 22: undefined Power Connection Box Revenue (million), by Type 2025 & 2033
- Figure 23: undefined Power Connection Box Revenue Share (%), by Type 2025 & 2033
- Figure 24: undefined Power Connection Box Revenue (million), by Country 2025 & 2033
- Figure 25: undefined Power Connection Box Revenue Share (%), by Country 2025 & 2033
- Figure 26: undefined Power Connection Box Revenue (million), by Application 2025 & 2033
- Figure 27: undefined Power Connection Box Revenue Share (%), by Application 2025 & 2033
- Figure 28: undefined Power Connection Box Revenue (million), by Type 2025 & 2033
- Figure 29: undefined Power Connection Box Revenue Share (%), by Type 2025 & 2033
- Figure 30: undefined Power Connection Box Revenue (million), by Country 2025 & 2033
- Figure 31: undefined Power Connection Box Revenue Share (%), by Country 2025 & 2033
List of Tables
- Table 1: Global Power Connection Box Revenue million Forecast, by Application 2020 & 2033
- Table 2: Global Power Connection Box Revenue million Forecast, by Type 2020 & 2033
- Table 3: Global Power Connection Box Revenue million Forecast, by Region 2020 & 2033
- Table 4: Global Power Connection Box Revenue million Forecast, by Application 2020 & 2033
- Table 5: Global Power Connection Box Revenue million Forecast, by Type 2020 & 2033
- Table 6: Global Power Connection Box Revenue million Forecast, by Country 2020 & 2033
- Table 7: Global Power Connection Box Revenue million Forecast, by Application 2020 & 2033
- Table 8: Global Power Connection Box Revenue million Forecast, by Type 2020 & 2033
- Table 9: Global Power Connection Box Revenue million Forecast, by Country 2020 & 2033
- Table 10: Global Power Connection Box Revenue million Forecast, by Application 2020 & 2033
- Table 11: Global Power Connection Box Revenue million Forecast, by Type 2020 & 2033
- Table 12: Global Power Connection Box Revenue million Forecast, by Country 2020 & 2033
- Table 13: Global Power Connection Box Revenue million Forecast, by Application 2020 & 2033
- Table 14: Global Power Connection Box Revenue million Forecast, by Type 2020 & 2033
- Table 15: Global Power Connection Box Revenue million Forecast, by Country 2020 & 2033
- Table 16: Global Power Connection Box Revenue million Forecast, by Application 2020 & 2033
- Table 17: Global Power Connection Box Revenue million Forecast, by Type 2020 & 2033
- Table 18: Global Power Connection Box Revenue million Forecast, by Country 2020 & 2033
Frequently Asked Questions
1. What is the projected Compound Annual Growth Rate (CAGR) of the Power Connection Box?
The projected CAGR is approximately 8.3%.
2. Which companies are prominent players in the Power Connection Box?
Key companies in the market include Magtrol, TE Connectivity, Amphenol, Molex, Delphi, Yazaki, Sumitomo, JST, Deutsch, FCI, Hirose.
3. What are the main segments of the Power Connection Box?
The market segments include Application, Type.
4. Can you provide details about the market size?
The market size is estimated to be USD 4563 million as of 2022.
5. What are some drivers contributing to market growth?
N/A
6. What are the notable trends driving market growth?
N/A
7. Are there any restraints impacting market growth?
N/A
8. Can you provide examples of recent developments in the market?
N/A
9. What pricing options are available for accessing the report?
Pricing options include single-user, multi-user, and enterprise licenses priced at USD 4250.00, USD 6375.00, and USD 8500.00 respectively.
10. Is the market size provided in terms of value or volume?
The market size is provided in terms of value, measured in million.
11. Are there any specific market keywords associated with the report?
Yes, the market keyword associated with the report is "Power Connection Box," which aids in identifying and referencing the specific market segment covered.
12. How do I determine which pricing option suits my needs best?
The pricing options vary based on user requirements and access needs. Individual users may opt for single-user licenses, while businesses requiring broader access may choose multi-user or enterprise licenses for cost-effective access to the report.
13. Are there any additional resources or data provided in the Power Connection Box report?
While the report offers comprehensive insights, it's advisable to review the specific contents or supplementary materials provided to ascertain if additional resources or data are available.
14. How can I stay updated on further developments or reports in the Power Connection Box?
To stay informed about further developments, trends, and reports in the Power Connection Box, consider subscribing to industry newsletters, following relevant companies and organizations, or regularly checking reputable industry news sources and publications.
Methodology
Step 1 - Identification of Relevant Samples Size from Population Database


Step 2 - Approaches for Defining Global Market Size (Value, Volume* & Price*)

Note*: In applicable scenarios
Step 3 - Data Sources
Primary Research
- Web Analytics
- Survey Reports
- Research Institute
- Latest Research Reports
- Opinion Leaders
Secondary Research
- Annual Reports
- White Paper
- Latest Press Release
- Industry Association
- Paid Database
- Investor Presentations

Step 4 - Data Triangulation
Involves using different sources of information in order to increase the validity of a study
These sources are likely to be stakeholders in a program - participants, other researchers, program staff, other community members, and so on.
Then we put all data in single framework & apply various statistical tools to find out the dynamic on the market.
During the analysis stage, feedback from the stakeholder groups would be compared to determine areas of agreement as well as areas of divergence