

Key Insights
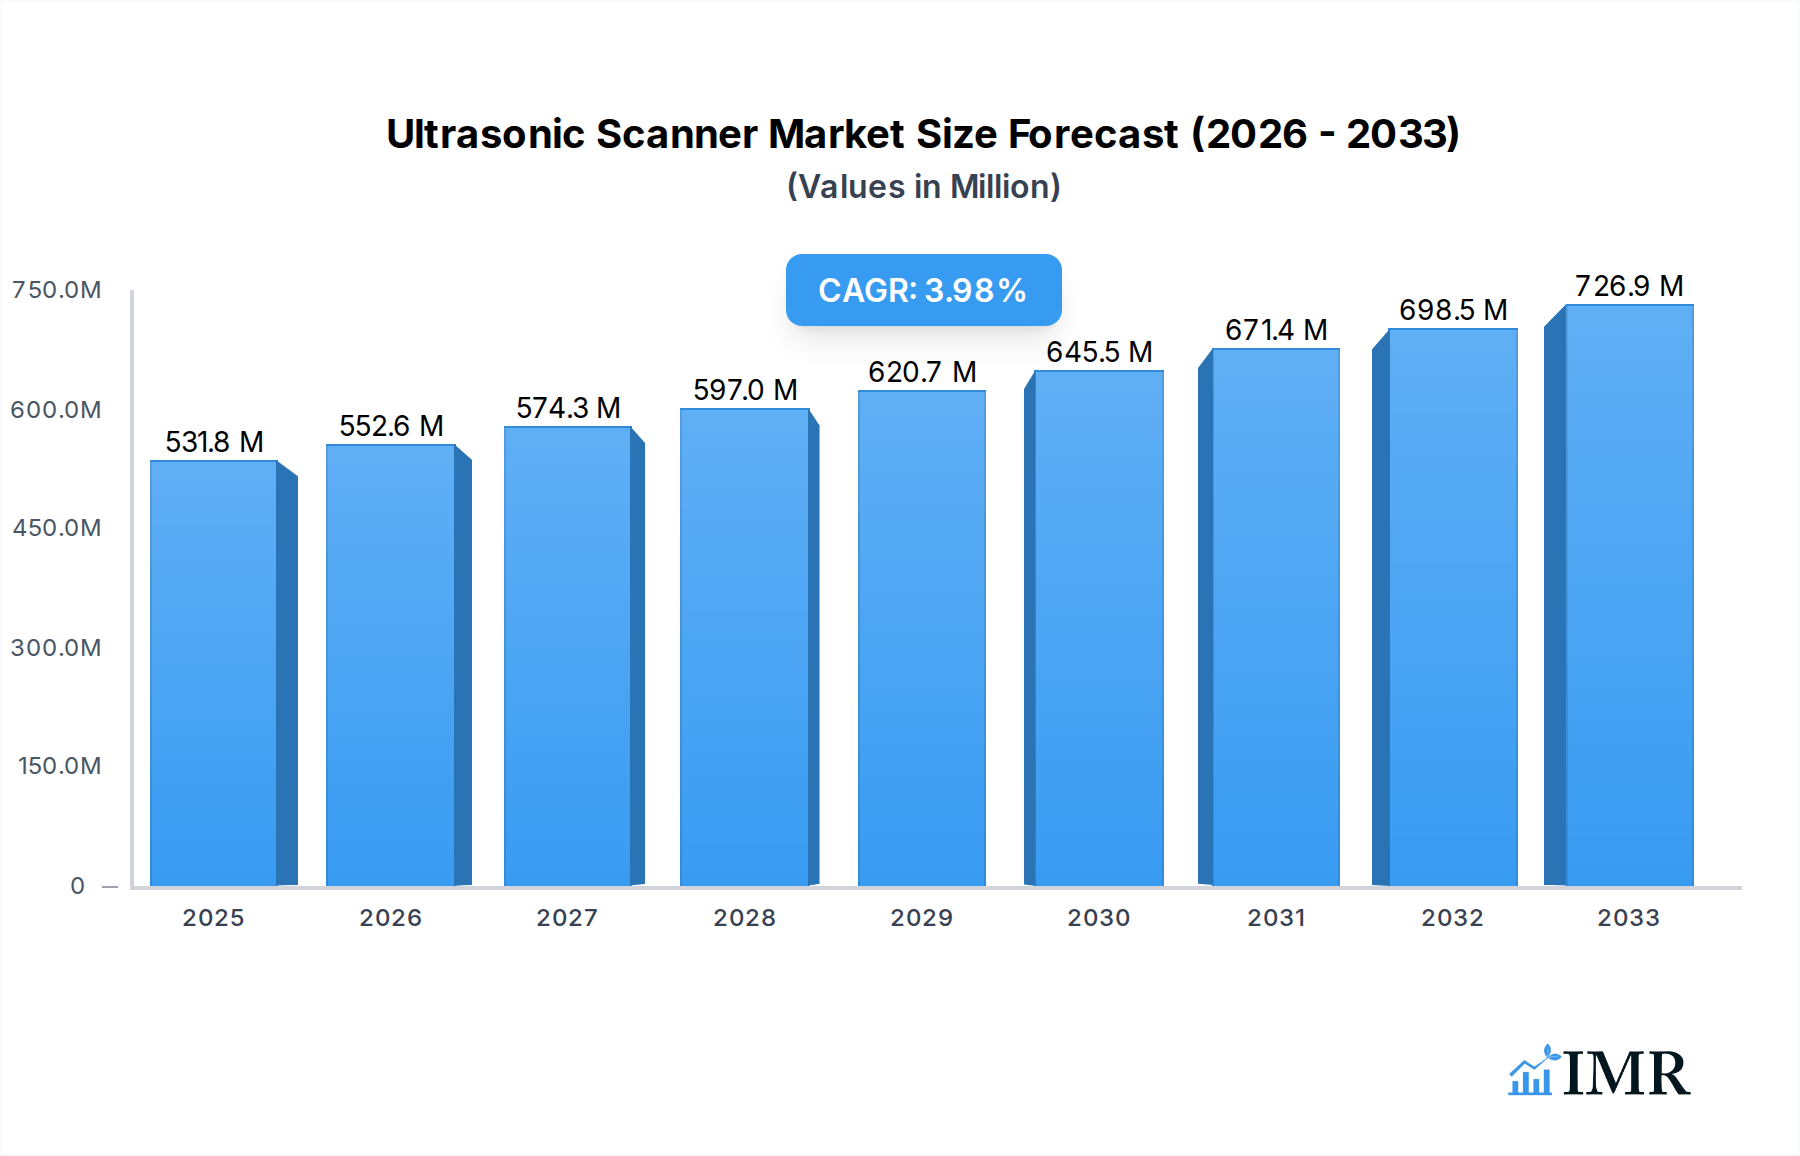
The global ultrasonic scanner market is poised for significant expansion, driven by increasing demand for non-destructive testing (NDT) across various industrial sectors. With an estimated market size of USD 531.8 million in 2025, the market is projected to grow at a robust CAGR of 3.9% through 2033. This growth is primarily fueled by the critical need for ensuring the integrity and safety of components in high-stakes industries such as aerospace and defense, where precision and reliability are paramount. The automotive sector is also contributing substantially, with the increasing complexity of vehicle designs and the adoption of advanced materials necessitating sophisticated inspection techniques. Furthermore, the power generation industry, with its aging infrastructure and stringent safety regulations, relies heavily on ultrasonic scanners for routine maintenance and defect detection. The manufacturing sector, encompassing a broad range of applications from heavy machinery to consumer goods, also benefits from the efficiency and accuracy offered by these devices.

Ultrasonic Scanner Market Size (In Million)
The market's upward trajectory is supported by ongoing technological advancements in ultrasonic scanner capabilities, including enhanced portability, improved resolution, and advanced signal processing features. The growing adoption of phased array ultrasonic testing (PAUT) and total focusing method (TFM) technologies is further expanding the application scope and accuracy of these scanners. While the market presents numerous opportunities, potential restraints include the high initial investment cost for advanced systems and the need for skilled personnel to operate them effectively. However, the increasing awareness of the long-term cost savings and enhanced safety benefits derived from regular inspections is expected to mitigate these challenges. Geographically, North America and Europe are anticipated to remain dominant markets due to the presence of established industrial bases and stringent regulatory frameworks. The Asia Pacific region is expected to witness the fastest growth, propelled by rapid industrialization and increased investments in infrastructure and manufacturing.
Ultrasonic Scanner Company Market Share
Ultrasonic Scanner Market Report: In-Depth Analysis and Future Outlook (2019-2033)
Report Description:
This comprehensive report delivers an in-depth analysis of the global Ultrasonic Scanner market, providing critical insights for industry professionals and stakeholders. We dissect market dynamics, growth trends, regional dominance, product landscape, key drivers, barriers, emerging opportunities, and future outlook, all within the context of the parent and child markets. Leveraging high-traffic keywords, this report is optimized for maximum search engine visibility, ensuring you find essential data on ultrasonic testing (UT) equipment, flaw detection systems, non-destructive testing (NDT) solutions, and advanced NDT scanners. Our analysis covers a robust study period from 2019 to 2033, with a base year of 2025, offering historical context and forward-looking projections. Explore the market for portable ultrasonic scanners and stationary ultrasonic scanners across key applications like Oil and Gas, Aerospace and Defense, Power Generation, Automotive, and Manufacturing. Discover the strategies of leading players including Olympus, GE (Baker Hughes), Sonatest, TecScan System, Ndt Systems, Cygnus Instruments, Amerapex, Zeal International, Ametek, and Eddyfi NDT.
Ultrasonic Scanner Market Dynamics & Structure
The global Ultrasonic Scanner market exhibits a moderately consolidated structure, characterized by the presence of established giants and emerging innovators. Technological innovation acts as a primary driver, with advancements in phased array technology, multi-element transducers, and data processing capabilities continually pushing the boundaries of UT equipment. Regulatory frameworks, particularly those mandating stringent safety and quality control in critical industries like Oil and Gas and Aerospace and Defense, are instrumental in fostering market growth. Competitive product substitutes, such as radiographic testing and eddy current testing, pose a challenge, yet ultrasonic scanners offer superior resolution and portability for many applications. End-user demographics are increasingly sophisticated, demanding user-friendly interfaces, real-time data analysis, and integrated reporting features. Mergers and acquisitions (M&A) trends, while not overly aggressive, indicate strategic consolidation to expand product portfolios and market reach.
- Market Concentration: Moderately consolidated, with top players holding significant market share.
- Technological Innovation Drivers: Phased array UT, 3D imaging, advanced signal processing, automation.
- Regulatory Frameworks: Strict adherence to industry standards (e.g., ASME, API, ASTM) driving adoption.
- Competitive Product Substitutes: Radiographic testing, eddy current testing, magnetic particle testing.
- End-User Demographics: Growing demand for IoT-enabled, AI-driven, and user-friendly solutions.
- M&A Trends: Strategic acquisitions for technology integration and market expansion.
- Innovation Barriers: High R&D costs, complex integration with existing systems, skilled workforce requirements.
Ultrasonic Scanner Growth Trends & Insights
The global Ultrasonic Scanner market is poised for robust expansion, driven by escalating demand for non-destructive testing (NDT) solutions across a multitude of industries. The market size evolution is projected to witness a healthy Compound Annual Growth Rate (CAGR) throughout the forecast period. Adoption rates are accelerating, propelled by increasing awareness of the benefits of early defect detection in ensuring operational safety, preventing costly downtime, and maintaining product integrity. Technological disruptions, particularly the integration of artificial intelligence (AI) and machine learning (ML) into scanner software for automated data analysis and interpretation, are reshaping the market landscape. Consumer behavior shifts are also evident, with a growing preference for portable, wireless, and cloud-connected ultrasonic scanners that offer enhanced flexibility and remote monitoring capabilities. The increasing complexity of manufactured goods and infrastructure necessitates more advanced inspection techniques, further fueling market penetration.
- Market Size Evolution: Projected significant growth from approximately $1,100 million in the historical period to an estimated $1,800 million by 2033.
- CAGR: Expected to grow at a CAGR of approximately 5.5% during the forecast period (2025-2033).
- Adoption Rates: Steadily increasing across all key sectors, particularly in Oil and Gas and Aerospace.
- Technological Disruptions: AI/ML integration for automated defect recognition, advanced beamforming, miniaturization of components.
- Consumer Behavior Shifts: Demand for portable, wireless, IoT-enabled, and data-rich solutions.
- Market Penetration: Deepening across developing economies and expanding into new application areas within traditional sectors.
- Value Chain Integration: Increased focus on software and data analytics services alongside hardware.
Dominant Regions, Countries, or Segments in Ultrasonic Scanner
North America, led by the United States, currently stands as the dominant region in the global Ultrasonic Scanner market, primarily driven by its advanced industrial infrastructure and significant investments in the Oil and Gas and Aerospace and Defense sectors. The Oil and Gas segment, in particular, is a key growth engine, with extensive exploration, production, and refining activities requiring rigorous safety and integrity checks. Strict regulatory compliance in these sectors mandates the use of sophisticated NDT equipment, including ultrasonic scanners, to ensure the integrity of pipelines, drilling equipment, and processing facilities.
Key Drivers in North America (Dominant Region):
- Oil and Gas Sector: High demand for pipeline integrity monitoring, offshore platform inspections, and refinery maintenance.
- Aerospace and Defense Industry: Stringent quality control requirements for aircraft components and defense equipment manufacturing.
- Technological Advancements: Early adoption of cutting-edge ultrasonic scanner technologies and automation.
- Strong R&D Ecosystem: Presence of leading manufacturers and research institutions fostering innovation.
- Economic Policies: Government initiatives supporting industrial modernization and infrastructure development.
Among the product types, Portable Ultrasonic Scanners are experiencing rapid growth. Their flexibility and ease of use in on-site inspections are highly valued across various industries, from field service in Oil and Gas to manufacturing floor inspections. The increasing need for real-time data acquisition and analysis in remote locations further propels the demand for portable solutions.
Key Drivers for Portable Ultrasonic Scanners (Dominant Product Type):
- Field Service and Mobility: Essential for inspections in hard-to-reach areas and on operational sites.
- Versatility: Adaptable to a wide range of applications across different industries.
- Cost-Effectiveness: Lower initial investment and operational costs compared to stationary systems for certain applications.
- Technological Miniaturization: Development of smaller, lighter, and more powerful portable units.
- Increased Productivity: Faster inspection times and immediate data availability.
Ultrasonic Scanner Product Landscape
The ultrasonic scanner product landscape is characterized by continuous innovation aimed at enhancing inspection capabilities and user experience. Manufacturers are focusing on developing phased array ultrasonic systems with advanced beamforming capabilities, allowing for multi-angle inspections and faster defect characterization. The integration of sophisticated signal processing algorithms, including AI-powered analysis, is enabling more accurate flaw detection and reporting. Performance metrics such as resolution, penetration depth, scanning speed, and data acquisition rate are continually improving. Unique selling propositions include the development of ruggedized, waterproof designs for harsh industrial environments, intuitive user interfaces with touch-screen displays, and seamless connectivity options for data transfer and remote diagnostics. Technological advancements also encompass the miniaturization of components and the development of novel transducer technologies for improved signal-to-noise ratios.
Key Drivers, Barriers & Challenges in Ultrasonic Scanner
Key Drivers:
- Safety and Regulatory Compliance: Increasing demand for stringent safety standards in critical industries like Oil & Gas and Aerospace.
- Technological Advancements: Innovations in phased array, digital imaging, and AI are enhancing UT capabilities.
- Cost-Effectiveness and Efficiency: Ultrasonic scanners offer a cost-effective alternative to destructive testing and reduce downtime.
- Growing Infrastructure Development: Expansion of infrastructure projects globally necessitates robust inspection and maintenance.
- Industry 4.0 Integration: Demand for smart, connected NDT solutions for real-time monitoring and data analytics.
Barriers & Challenges:
- High Initial Investment Costs: Advanced ultrasonic scanners can be expensive, posing a barrier for smaller enterprises.
- Skilled Workforce Requirement: Operating and interpreting data from complex UT equipment requires trained personnel.
- Competition from Alternative NDT Methods: Established NDT techniques can sometimes be preferred for specific applications.
- Technological Obsolescence: Rapid advancements require continuous upgrades, leading to potential obsolescence concerns.
- Supply Chain Disruptions: Global supply chain issues can impact the availability of critical components, leading to delays and increased costs.
Emerging Opportunities in Ultrasonic Scanner
Emerging opportunities in the Ultrasonic Scanner market lie in the expanding applications within emerging economies and the increasing adoption of advanced NDT in sectors like renewable energy (wind turbines, solar panels) and electric vehicles. The integration of ultrasonic scanners with robotics and automated inspection systems presents a significant growth avenue, enabling inspections in highly hazardous environments and improving efficiency. Furthermore, the development of miniaturized, low-cost ultrasonic sensors for in-situ structural health monitoring (SHM) in buildings and bridges offers a substantial untapped market. The growing demand for advanced material characterization and weld inspection in additive manufacturing also represents a burgeoning opportunity.
Growth Accelerators in the Ultrasonic Scanner Industry
Several catalysts are accelerating growth in the Ultrasonic Scanner industry. Technological breakthroughs in transducer materials and signal processing are leading to higher resolution and sensitivity. Strategic partnerships between NDT equipment manufacturers and software developers are fostering the creation of integrated, intelligent inspection solutions. Market expansion strategies, including the penetration into developing regions and the diversification into new application areas, are further fueling growth. The increasing focus on predictive maintenance and life-cycle management of critical assets necessitates continuous and advanced inspection capabilities, driving the demand for ultrasonic scanners.
Key Players Shaping the Ultrasonic Scanner Market
- Olympus
- GE (Baker Hughes)
- Sonatest
- TecScan System
- Ndt Systems
- Cygnus Instruments
- Amerapex
- Zeal International
- Ametek
- Eddyfi NDT
Notable Milestones in Ultrasonic Scanner Sector
- 2019: Launch of advanced phased array ultrasonic testing (PAUT) systems with enhanced imaging capabilities.
- 2020: Increased adoption of portable ultrasonic flaw detectors for on-site inspections amid global travel restrictions.
- 2021: Introduction of AI-powered software for automated defect recognition in ultrasonic scanner data.
- 2022: Growth in demand for wireless and cloud-connected ultrasonic scanners for remote monitoring.
- 2023: Significant investments in R&D for miniaturization and improved battery life in portable UT devices.
- 2024: Expansion of ultrasonic testing applications in additive manufacturing and composite material inspection.
In-Depth Ultrasonic Scanner Market Outlook
The future of the Ultrasonic Scanner market appears exceptionally promising, driven by the relentless pursuit of safety, efficiency, and reliability across global industries. Growth accelerators, including cutting-edge technological advancements and strategic market expansion, will continue to propel the sector forward. The increasing integration of AI and automation promises more intelligent and efficient inspection processes. Opportunities in emerging markets and niche applications, such as renewable energy infrastructure and advanced manufacturing, offer substantial untapped potential. Stakeholders are advised to focus on innovation, sustainability, and fostering a skilled workforce to capitalize on the evolving demands and solidify their market positions in the coming years. The market is expected to reach approximately $1,800 million by 2033.
Ultrasonic Scanner Segmentation
-
1. Application
- 1.1. Oil and Gas
- 1.2. Aerospace and Defense
- 1.3. Power Generation
- 1.4. Automotive
- 1.5. Manufacturing
- 1.6. Other
-
2. Types
- 2.1. Portable Ultrasonic Scanner
- 2.2. Stationary Ultrasonic Scanner
Ultrasonic Scanner Segmentation By Geography
-
1. North America
- 1.1. United States
- 1.2. Canada
- 1.3. Mexico
-
2. South America
- 2.1. Brazil
- 2.2. Argentina
- 2.3. Rest of South America
-
3. Europe
- 3.1. United Kingdom
- 3.2. Germany
- 3.3. France
- 3.4. Italy
- 3.5. Spain
- 3.6. Russia
- 3.7. Benelux
- 3.8. Nordics
- 3.9. Rest of Europe
-
4. Middle East & Africa
- 4.1. Turkey
- 4.2. Israel
- 4.3. GCC
- 4.4. North Africa
- 4.5. South Africa
- 4.6. Rest of Middle East & Africa
-
5. Asia Pacific
- 5.1. China
- 5.2. India
- 5.3. Japan
- 5.4. South Korea
- 5.5. ASEAN
- 5.6. Oceania
- 5.7. Rest of Asia Pacific
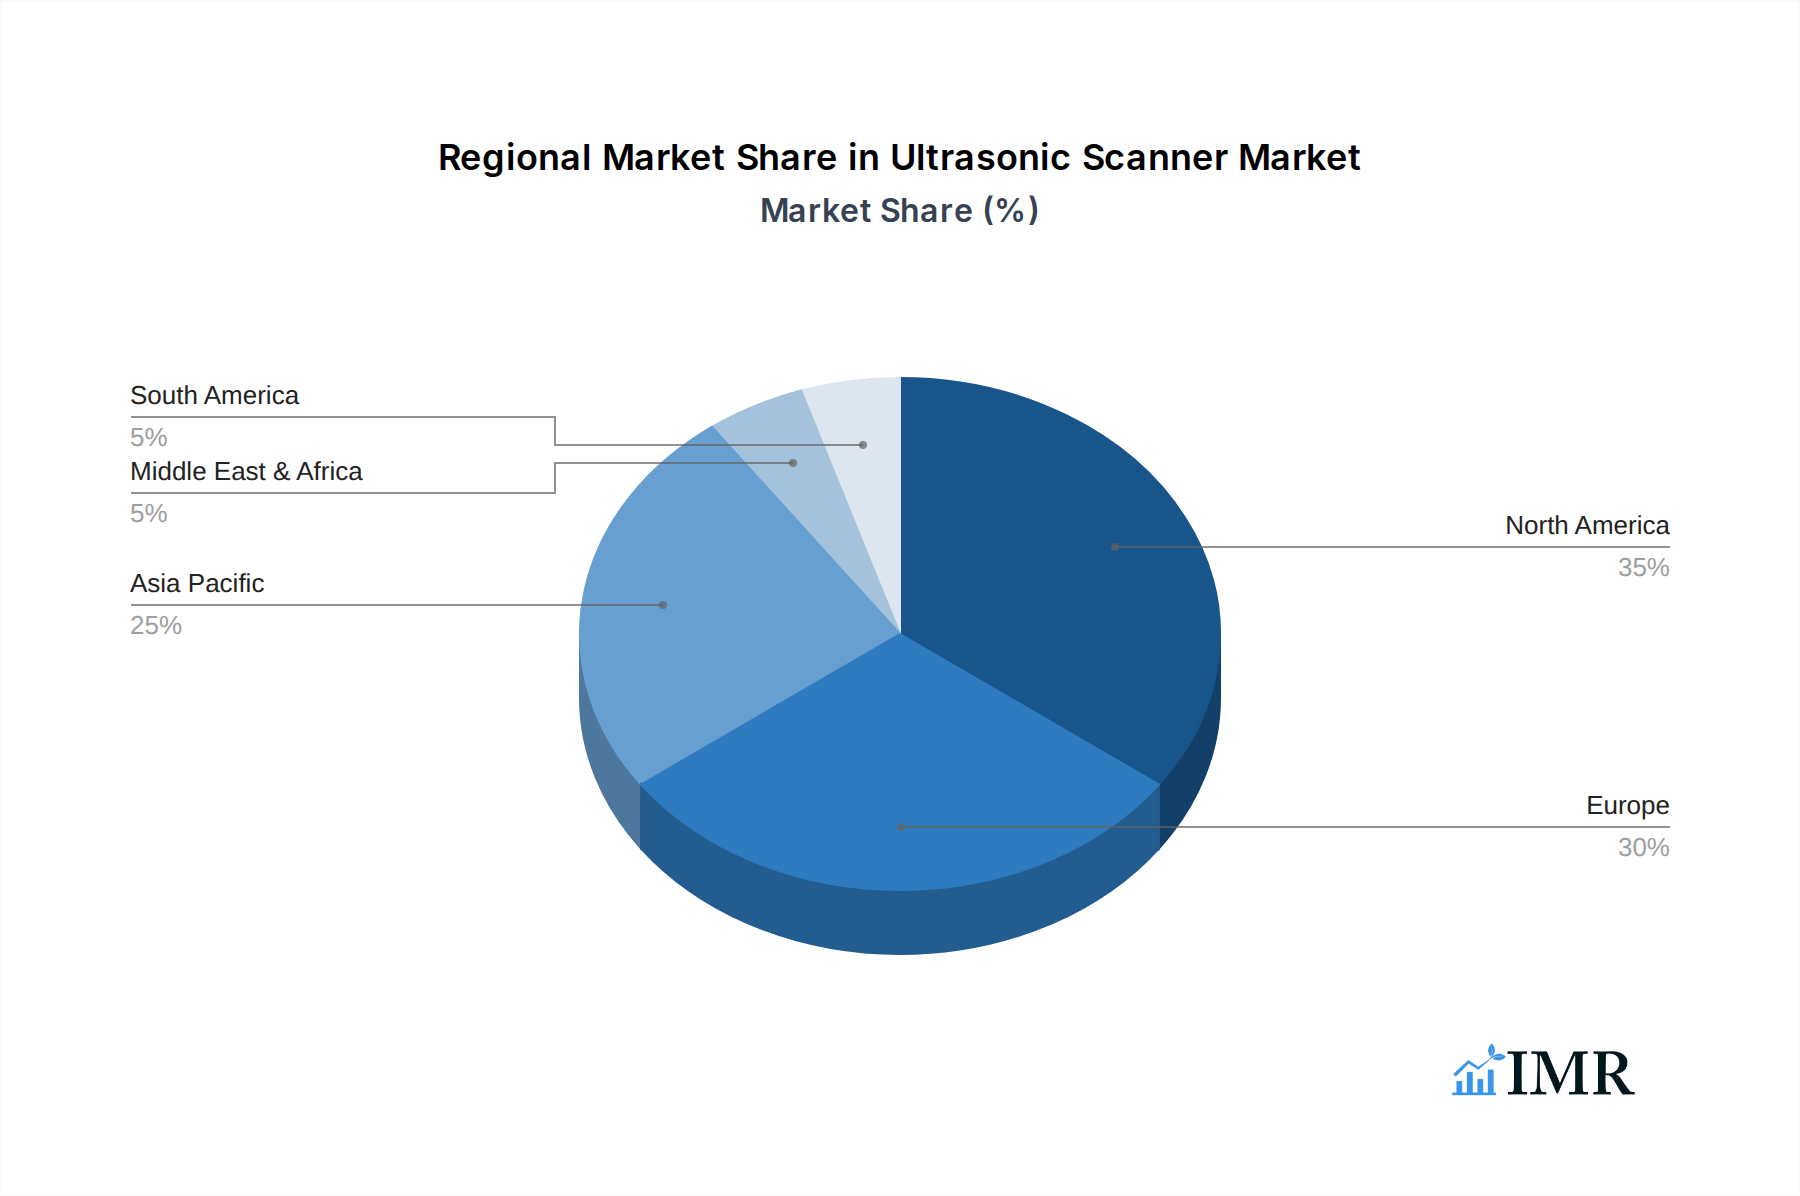
Ultrasonic Scanner Regional Market Share
Geographic Coverage of Ultrasonic Scanner
Ultrasonic Scanner REPORT HIGHLIGHTS
| Aspects | Details |
|---|---|
| Study Period | 2020-2034 |
| Base Year | 2025 |
| Estimated Year | 2026 |
| Forecast Period | 2026-2034 |
| Historical Period | 2020-2025 |
| Growth Rate | CAGR of 3.9% from 2020-2034 |
| Segmentation |
|
Table of Contents
- 1. Introduction
- 1.1. Research Scope
- 1.2. Market Segmentation
- 1.3. Research Methodology
- 1.4. Definitions and Assumptions
- 2. Executive Summary
- 2.1. Introduction
- 3. Market Dynamics
- 3.1. Introduction
- 3.2. Market Drivers
- 3.3. Market Restrains
- 3.4. Market Trends
- 4. Market Factor Analysis
- 4.1. Porters Five Forces
- 4.2. Supply/Value Chain
- 4.3. PESTEL analysis
- 4.4. Market Entropy
- 4.5. Patent/Trademark Analysis
- 5. Global Ultrasonic Scanner Analysis, Insights and Forecast, 2020-2032
- 5.1. Market Analysis, Insights and Forecast - by Application
- 5.1.1. Oil and Gas
- 5.1.2. Aerospace and Defense
- 5.1.3. Power Generation
- 5.1.4. Automotive
- 5.1.5. Manufacturing
- 5.1.6. Other
- 5.2. Market Analysis, Insights and Forecast - by Types
- 5.2.1. Portable Ultrasonic Scanner
- 5.2.2. Stationary Ultrasonic Scanner
- 5.3. Market Analysis, Insights and Forecast - by Region
- 5.3.1. North America
- 5.3.2. South America
- 5.3.3. Europe
- 5.3.4. Middle East & Africa
- 5.3.5. Asia Pacific
- 5.1. Market Analysis, Insights and Forecast - by Application
- 6. North America Ultrasonic Scanner Analysis, Insights and Forecast, 2020-2032
- 6.1. Market Analysis, Insights and Forecast - by Application
- 6.1.1. Oil and Gas
- 6.1.2. Aerospace and Defense
- 6.1.3. Power Generation
- 6.1.4. Automotive
- 6.1.5. Manufacturing
- 6.1.6. Other
- 6.2. Market Analysis, Insights and Forecast - by Types
- 6.2.1. Portable Ultrasonic Scanner
- 6.2.2. Stationary Ultrasonic Scanner
- 6.1. Market Analysis, Insights and Forecast - by Application
- 7. South America Ultrasonic Scanner Analysis, Insights and Forecast, 2020-2032
- 7.1. Market Analysis, Insights and Forecast - by Application
- 7.1.1. Oil and Gas
- 7.1.2. Aerospace and Defense
- 7.1.3. Power Generation
- 7.1.4. Automotive
- 7.1.5. Manufacturing
- 7.1.6. Other
- 7.2. Market Analysis, Insights and Forecast - by Types
- 7.2.1. Portable Ultrasonic Scanner
- 7.2.2. Stationary Ultrasonic Scanner
- 7.1. Market Analysis, Insights and Forecast - by Application
- 8. Europe Ultrasonic Scanner Analysis, Insights and Forecast, 2020-2032
- 8.1. Market Analysis, Insights and Forecast - by Application
- 8.1.1. Oil and Gas
- 8.1.2. Aerospace and Defense
- 8.1.3. Power Generation
- 8.1.4. Automotive
- 8.1.5. Manufacturing
- 8.1.6. Other
- 8.2. Market Analysis, Insights and Forecast - by Types
- 8.2.1. Portable Ultrasonic Scanner
- 8.2.2. Stationary Ultrasonic Scanner
- 8.1. Market Analysis, Insights and Forecast - by Application
- 9. Middle East & Africa Ultrasonic Scanner Analysis, Insights and Forecast, 2020-2032
- 9.1. Market Analysis, Insights and Forecast - by Application
- 9.1.1. Oil and Gas
- 9.1.2. Aerospace and Defense
- 9.1.3. Power Generation
- 9.1.4. Automotive
- 9.1.5. Manufacturing
- 9.1.6. Other
- 9.2. Market Analysis, Insights and Forecast - by Types
- 9.2.1. Portable Ultrasonic Scanner
- 9.2.2. Stationary Ultrasonic Scanner
- 9.1. Market Analysis, Insights and Forecast - by Application
- 10. Asia Pacific Ultrasonic Scanner Analysis, Insights and Forecast, 2020-2032
- 10.1. Market Analysis, Insights and Forecast - by Application
- 10.1.1. Oil and Gas
- 10.1.2. Aerospace and Defense
- 10.1.3. Power Generation
- 10.1.4. Automotive
- 10.1.5. Manufacturing
- 10.1.6. Other
- 10.2. Market Analysis, Insights and Forecast - by Types
- 10.2.1. Portable Ultrasonic Scanner
- 10.2.2. Stationary Ultrasonic Scanner
- 10.1. Market Analysis, Insights and Forecast - by Application
- 11. Competitive Analysis
- 11.1. Global Market Share Analysis 2025
- 11.2. Company Profiles
- 11.2.1 Olympus
- 11.2.1.1. Overview
- 11.2.1.2. Products
- 11.2.1.3. SWOT Analysis
- 11.2.1.4. Recent Developments
- 11.2.1.5. Financials (Based on Availability)
- 11.2.2 GE(Baker Hughes)
- 11.2.2.1. Overview
- 11.2.2.2. Products
- 11.2.2.3. SWOT Analysis
- 11.2.2.4. Recent Developments
- 11.2.2.5. Financials (Based on Availability)
- 11.2.3 Sonatest
- 11.2.3.1. Overview
- 11.2.3.2. Products
- 11.2.3.3. SWOT Analysis
- 11.2.3.4. Recent Developments
- 11.2.3.5. Financials (Based on Availability)
- 11.2.4 TecScan System
- 11.2.4.1. Overview
- 11.2.4.2. Products
- 11.2.4.3. SWOT Analysis
- 11.2.4.4. Recent Developments
- 11.2.4.5. Financials (Based on Availability)
- 11.2.5 Ndt Systems
- 11.2.5.1. Overview
- 11.2.5.2. Products
- 11.2.5.3. SWOT Analysis
- 11.2.5.4. Recent Developments
- 11.2.5.5. Financials (Based on Availability)
- 11.2.6 Cygnus Instruments
- 11.2.6.1. Overview
- 11.2.6.2. Products
- 11.2.6.3. SWOT Analysis
- 11.2.6.4. Recent Developments
- 11.2.6.5. Financials (Based on Availability)
- 11.2.7 Amerapex
- 11.2.7.1. Overview
- 11.2.7.2. Products
- 11.2.7.3. SWOT Analysis
- 11.2.7.4. Recent Developments
- 11.2.7.5. Financials (Based on Availability)
- 11.2.8 Zeal International
- 11.2.8.1. Overview
- 11.2.8.2. Products
- 11.2.8.3. SWOT Analysis
- 11.2.8.4. Recent Developments
- 11.2.8.5. Financials (Based on Availability)
- 11.2.9 Ametek
- 11.2.9.1. Overview
- 11.2.9.2. Products
- 11.2.9.3. SWOT Analysis
- 11.2.9.4. Recent Developments
- 11.2.9.5. Financials (Based on Availability)
- 11.2.10 Eddyfi NDT
- 11.2.10.1. Overview
- 11.2.10.2. Products
- 11.2.10.3. SWOT Analysis
- 11.2.10.4. Recent Developments
- 11.2.10.5. Financials (Based on Availability)
- 11.2.1 Olympus
List of Figures
- Figure 1: Global Ultrasonic Scanner Revenue Breakdown (million, %) by Region 2025 & 2033
- Figure 2: North America Ultrasonic Scanner Revenue (million), by Application 2025 & 2033
- Figure 3: North America Ultrasonic Scanner Revenue Share (%), by Application 2025 & 2033
- Figure 4: North America Ultrasonic Scanner Revenue (million), by Types 2025 & 2033
- Figure 5: North America Ultrasonic Scanner Revenue Share (%), by Types 2025 & 2033
- Figure 6: North America Ultrasonic Scanner Revenue (million), by Country 2025 & 2033
- Figure 7: North America Ultrasonic Scanner Revenue Share (%), by Country 2025 & 2033
- Figure 8: South America Ultrasonic Scanner Revenue (million), by Application 2025 & 2033
- Figure 9: South America Ultrasonic Scanner Revenue Share (%), by Application 2025 & 2033
- Figure 10: South America Ultrasonic Scanner Revenue (million), by Types 2025 & 2033
- Figure 11: South America Ultrasonic Scanner Revenue Share (%), by Types 2025 & 2033
- Figure 12: South America Ultrasonic Scanner Revenue (million), by Country 2025 & 2033
- Figure 13: South America Ultrasonic Scanner Revenue Share (%), by Country 2025 & 2033
- Figure 14: Europe Ultrasonic Scanner Revenue (million), by Application 2025 & 2033
- Figure 15: Europe Ultrasonic Scanner Revenue Share (%), by Application 2025 & 2033
- Figure 16: Europe Ultrasonic Scanner Revenue (million), by Types 2025 & 2033
- Figure 17: Europe Ultrasonic Scanner Revenue Share (%), by Types 2025 & 2033
- Figure 18: Europe Ultrasonic Scanner Revenue (million), by Country 2025 & 2033
- Figure 19: Europe Ultrasonic Scanner Revenue Share (%), by Country 2025 & 2033
- Figure 20: Middle East & Africa Ultrasonic Scanner Revenue (million), by Application 2025 & 2033
- Figure 21: Middle East & Africa Ultrasonic Scanner Revenue Share (%), by Application 2025 & 2033
- Figure 22: Middle East & Africa Ultrasonic Scanner Revenue (million), by Types 2025 & 2033
- Figure 23: Middle East & Africa Ultrasonic Scanner Revenue Share (%), by Types 2025 & 2033
- Figure 24: Middle East & Africa Ultrasonic Scanner Revenue (million), by Country 2025 & 2033
- Figure 25: Middle East & Africa Ultrasonic Scanner Revenue Share (%), by Country 2025 & 2033
- Figure 26: Asia Pacific Ultrasonic Scanner Revenue (million), by Application 2025 & 2033
- Figure 27: Asia Pacific Ultrasonic Scanner Revenue Share (%), by Application 2025 & 2033
- Figure 28: Asia Pacific Ultrasonic Scanner Revenue (million), by Types 2025 & 2033
- Figure 29: Asia Pacific Ultrasonic Scanner Revenue Share (%), by Types 2025 & 2033
- Figure 30: Asia Pacific Ultrasonic Scanner Revenue (million), by Country 2025 & 2033
- Figure 31: Asia Pacific Ultrasonic Scanner Revenue Share (%), by Country 2025 & 2033
List of Tables
- Table 1: Global Ultrasonic Scanner Revenue million Forecast, by Application 2020 & 2033
- Table 2: Global Ultrasonic Scanner Revenue million Forecast, by Types 2020 & 2033
- Table 3: Global Ultrasonic Scanner Revenue million Forecast, by Region 2020 & 2033
- Table 4: Global Ultrasonic Scanner Revenue million Forecast, by Application 2020 & 2033
- Table 5: Global Ultrasonic Scanner Revenue million Forecast, by Types 2020 & 2033
- Table 6: Global Ultrasonic Scanner Revenue million Forecast, by Country 2020 & 2033
- Table 7: United States Ultrasonic Scanner Revenue (million) Forecast, by Application 2020 & 2033
- Table 8: Canada Ultrasonic Scanner Revenue (million) Forecast, by Application 2020 & 2033
- Table 9: Mexico Ultrasonic Scanner Revenue (million) Forecast, by Application 2020 & 2033
- Table 10: Global Ultrasonic Scanner Revenue million Forecast, by Application 2020 & 2033
- Table 11: Global Ultrasonic Scanner Revenue million Forecast, by Types 2020 & 2033
- Table 12: Global Ultrasonic Scanner Revenue million Forecast, by Country 2020 & 2033
- Table 13: Brazil Ultrasonic Scanner Revenue (million) Forecast, by Application 2020 & 2033
- Table 14: Argentina Ultrasonic Scanner Revenue (million) Forecast, by Application 2020 & 2033
- Table 15: Rest of South America Ultrasonic Scanner Revenue (million) Forecast, by Application 2020 & 2033
- Table 16: Global Ultrasonic Scanner Revenue million Forecast, by Application 2020 & 2033
- Table 17: Global Ultrasonic Scanner Revenue million Forecast, by Types 2020 & 2033
- Table 18: Global Ultrasonic Scanner Revenue million Forecast, by Country 2020 & 2033
- Table 19: United Kingdom Ultrasonic Scanner Revenue (million) Forecast, by Application 2020 & 2033
- Table 20: Germany Ultrasonic Scanner Revenue (million) Forecast, by Application 2020 & 2033
- Table 21: France Ultrasonic Scanner Revenue (million) Forecast, by Application 2020 & 2033
- Table 22: Italy Ultrasonic Scanner Revenue (million) Forecast, by Application 2020 & 2033
- Table 23: Spain Ultrasonic Scanner Revenue (million) Forecast, by Application 2020 & 2033
- Table 24: Russia Ultrasonic Scanner Revenue (million) Forecast, by Application 2020 & 2033
- Table 25: Benelux Ultrasonic Scanner Revenue (million) Forecast, by Application 2020 & 2033
- Table 26: Nordics Ultrasonic Scanner Revenue (million) Forecast, by Application 2020 & 2033
- Table 27: Rest of Europe Ultrasonic Scanner Revenue (million) Forecast, by Application 2020 & 2033
- Table 28: Global Ultrasonic Scanner Revenue million Forecast, by Application 2020 & 2033
- Table 29: Global Ultrasonic Scanner Revenue million Forecast, by Types 2020 & 2033
- Table 30: Global Ultrasonic Scanner Revenue million Forecast, by Country 2020 & 2033
- Table 31: Turkey Ultrasonic Scanner Revenue (million) Forecast, by Application 2020 & 2033
- Table 32: Israel Ultrasonic Scanner Revenue (million) Forecast, by Application 2020 & 2033
- Table 33: GCC Ultrasonic Scanner Revenue (million) Forecast, by Application 2020 & 2033
- Table 34: North Africa Ultrasonic Scanner Revenue (million) Forecast, by Application 2020 & 2033
- Table 35: South Africa Ultrasonic Scanner Revenue (million) Forecast, by Application 2020 & 2033
- Table 36: Rest of Middle East & Africa Ultrasonic Scanner Revenue (million) Forecast, by Application 2020 & 2033
- Table 37: Global Ultrasonic Scanner Revenue million Forecast, by Application 2020 & 2033
- Table 38: Global Ultrasonic Scanner Revenue million Forecast, by Types 2020 & 2033
- Table 39: Global Ultrasonic Scanner Revenue million Forecast, by Country 2020 & 2033
- Table 40: China Ultrasonic Scanner Revenue (million) Forecast, by Application 2020 & 2033
- Table 41: India Ultrasonic Scanner Revenue (million) Forecast, by Application 2020 & 2033
- Table 42: Japan Ultrasonic Scanner Revenue (million) Forecast, by Application 2020 & 2033
- Table 43: South Korea Ultrasonic Scanner Revenue (million) Forecast, by Application 2020 & 2033
- Table 44: ASEAN Ultrasonic Scanner Revenue (million) Forecast, by Application 2020 & 2033
- Table 45: Oceania Ultrasonic Scanner Revenue (million) Forecast, by Application 2020 & 2033
- Table 46: Rest of Asia Pacific Ultrasonic Scanner Revenue (million) Forecast, by Application 2020 & 2033
Frequently Asked Questions
1. What is the projected Compound Annual Growth Rate (CAGR) of the Ultrasonic Scanner?
The projected CAGR is approximately 3.9%.
2. Which companies are prominent players in the Ultrasonic Scanner?
Key companies in the market include Olympus, GE(Baker Hughes), Sonatest, TecScan System, Ndt Systems, Cygnus Instruments, Amerapex, Zeal International, Ametek, Eddyfi NDT.
3. What are the main segments of the Ultrasonic Scanner?
The market segments include Application, Types.
4. Can you provide details about the market size?
The market size is estimated to be USD 531.8 million as of 2022.
5. What are some drivers contributing to market growth?
N/A
6. What are the notable trends driving market growth?
N/A
7. Are there any restraints impacting market growth?
N/A
8. Can you provide examples of recent developments in the market?
N/A
9. What pricing options are available for accessing the report?
Pricing options include single-user, multi-user, and enterprise licenses priced at USD 4900.00, USD 7350.00, and USD 9800.00 respectively.
10. Is the market size provided in terms of value or volume?
The market size is provided in terms of value, measured in million.
11. Are there any specific market keywords associated with the report?
Yes, the market keyword associated with the report is "Ultrasonic Scanner," which aids in identifying and referencing the specific market segment covered.
12. How do I determine which pricing option suits my needs best?
The pricing options vary based on user requirements and access needs. Individual users may opt for single-user licenses, while businesses requiring broader access may choose multi-user or enterprise licenses for cost-effective access to the report.
13. Are there any additional resources or data provided in the Ultrasonic Scanner report?
While the report offers comprehensive insights, it's advisable to review the specific contents or supplementary materials provided to ascertain if additional resources or data are available.
14. How can I stay updated on further developments or reports in the Ultrasonic Scanner?
To stay informed about further developments, trends, and reports in the Ultrasonic Scanner, consider subscribing to industry newsletters, following relevant companies and organizations, or regularly checking reputable industry news sources and publications.
Methodology
Step 1 - Identification of Relevant Samples Size from Population Database


Step 2 - Approaches for Defining Global Market Size (Value, Volume* & Price*)

Note*: In applicable scenarios
Step 3 - Data Sources
Primary Research
- Web Analytics
- Survey Reports
- Research Institute
- Latest Research Reports
- Opinion Leaders
Secondary Research
- Annual Reports
- White Paper
- Latest Press Release
- Industry Association
- Paid Database
- Investor Presentations

Step 4 - Data Triangulation
Involves using different sources of information in order to increase the validity of a study
These sources are likely to be stakeholders in a program - participants, other researchers, program staff, other community members, and so on.
Then we put all data in single framework & apply various statistical tools to find out the dynamic on the market.
During the analysis stage, feedback from the stakeholder groups would be compared to determine areas of agreement as well as areas of divergence