

Key Insights
The US pet industry, a robust and consistently expanding market, is projected to reach a significant size, driven by several key factors. The increasing humanization of pets, coupled with rising disposable incomes and a growing trend towards pet ownership, particularly among millennials and Gen Z, fuels demand for premium pet food, supplies, and healthcare services. The market segmentation reveals a strong preference for dog and cat products, followed by smaller but growing markets for bird and fish supplies. The preference for premium and specialized products, catering to specific dietary needs or breed characteristics, further contributes to market expansion. The convenience of online retail channels continues to grow, competing with established brick-and-mortar stores like supermarkets and specialty pet shops. Competition amongst major players like Nestlé Purina, Mars Inc., and Smucker's remains intense, driving innovation and creating a diverse product landscape. The regional breakdown suggests strong growth across all US regions, with potential variations in specific product categories based on local demographics and consumer preferences.
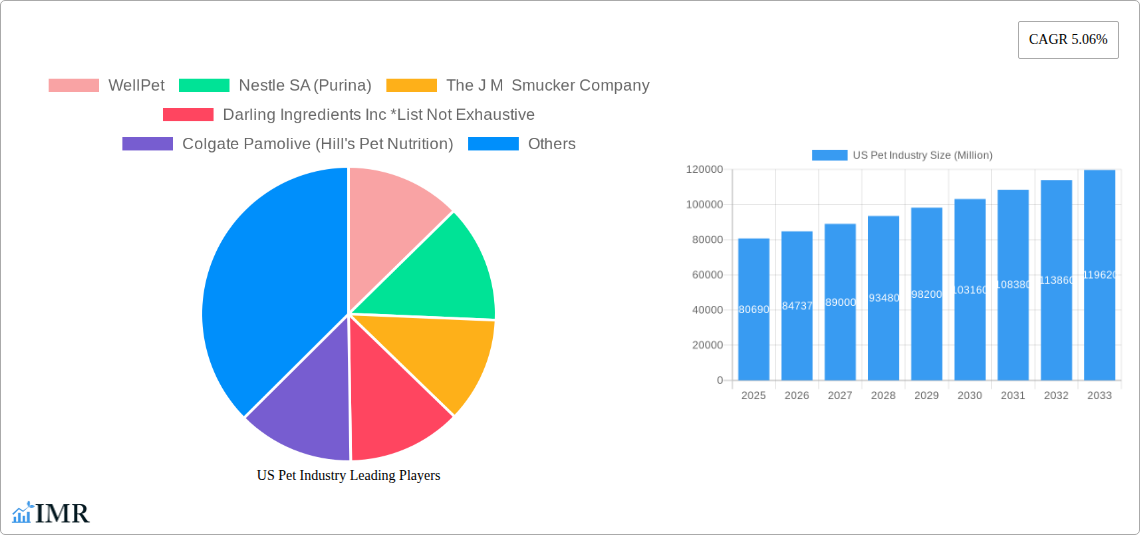
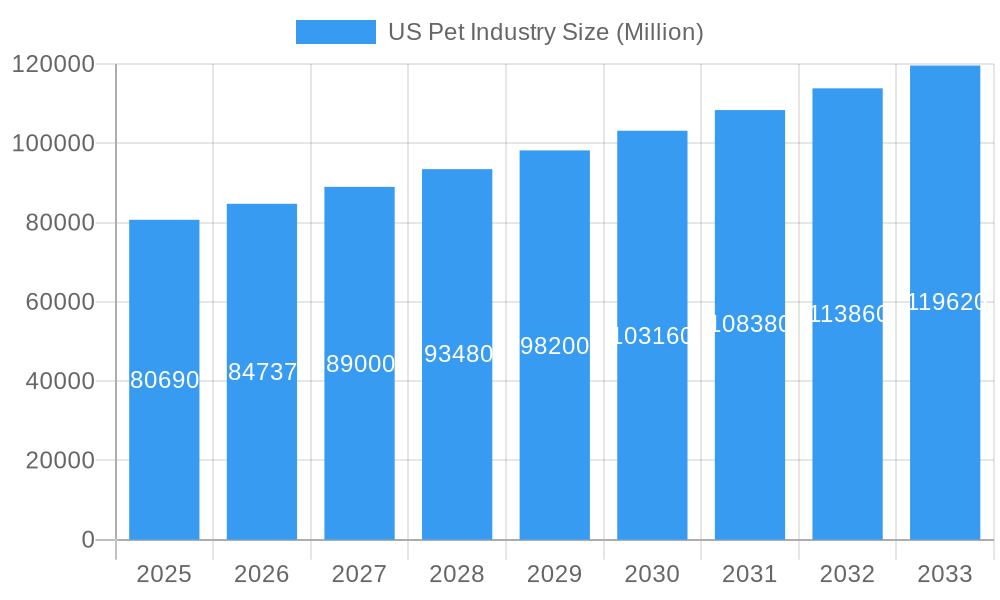
US Pet Industry Market Size (In Billion)
Looking ahead to 2033, the market is poised for continued growth, fueled by innovation in pet nutrition, the increasing adoption of pet insurance, and the emergence of personalized pet care services. While challenges remain, such as fluctuating raw material prices and potential economic downturns, the underlying trend of increasing pet ownership and the ongoing human-animal bond ensures a positive long-term outlook. The CAGR of 5.06% indicates a steady and predictable trajectory, allowing for reliable forecasting and strategic investment decisions within the industry. Specific growth within segments such as premium pet food, technologically advanced pet supplies (smart feeders, GPS trackers), and specialized veterinary care are expected to outperform the overall market average.
US Pet Industry Company Market Share
US Pet Industry Market Report: 2019-2033
This comprehensive report provides an in-depth analysis of the US pet industry, encompassing market dynamics, growth trends, key players, and future outlook. The study period covers 2019-2033, with 2025 as the base and estimated year, and a forecast period of 2025-2033. The historical period analyzed is 2019-2024. This report is essential for industry professionals, investors, and stakeholders seeking a thorough understanding of this dynamic market.
US Pet Industry Market Dynamics & Structure
The US pet industry is a multi-billion dollar market characterized by a high level of concentration among major players, significant technological innovation, and evolving regulatory frameworks. Market concentration is high, with a few large players dominating various segments. For example, Nestle Purina and Mars Inc hold significant market share in pet food. The industry witnesses continuous technological advancements, particularly in pet food formulations (e.g., novel protein sources, functional ingredients) and pet health monitoring devices. However, barriers to innovation include high R&D costs and stringent regulatory approvals. Mergers and acquisitions (M&A) are frequent, driven by the pursuit of scale, diversification, and access to new technologies. The number of M&A deals in the period 2019-2024 was estimated at xx. The industry also faces competition from substitute products, such as homemade pet food. End-user demographics are shifting, with an increasing number of millennials and Gen Z pet owners driving demand for premium and specialized products.
- Market Concentration: High, with top players holding significant shares.
- Technological Innovation: Driven by improved nutrition, health monitoring, and personalized pet care.
- Regulatory Framework: Stringent regulations regarding pet food safety and labeling.
- Competitive Substitutes: Homemade pet food, generic products posing a challenge.
- End-User Demographics: Shifting towards younger demographics with higher spending power.
- M&A Activity: Significant M&A activity driven by growth and market consolidation.
US Pet Industry Growth Trends & Insights
The US pet industry has experienced consistent growth over the past decade, driven by increasing pet ownership, humanization of pets, and rising disposable incomes. The market size reached xx million units in 2024, and is projected to reach xx million units by 2033, exhibiting a CAGR of xx%. Adoption rates for pets, particularly dogs and cats, remain high, further fueling market expansion. Technological disruptions, such as the rise of online pet supplies retailers and personalized nutrition solutions, have significantly altered consumer behavior. Consumers are increasingly seeking premium and specialized products, such as organic pet food and functional pet supplements. The shift towards premiumization is driving higher average spending per pet.
Dominant Regions, Countries, or Segments in US Pet Industry
The largest segments within the US pet industry are driven by several factors:
By Pet Type: Dogs and cats represent the dominant segments, comprising xx% and xx% of the market, respectively. This dominance is primarily attributed to high pet ownership rates and higher spending per pet compared to other animal types.
By Product Type: Pet food constitutes the largest segment, contributing approximately xx% to the total market value. The high demand for convenience, nutrition, and specialized dietary needs fuels this segment's growth. Supplies/OTC medicines represent a significant portion as well, driven by increasing pet health consciousness.
By Distribution Channel: Supermarket/hypermarkets remain the dominant distribution channel, accounting for approximately xx% of sales due to their widespread reach and convenience. Online retail stores are experiencing rapid growth, driven by increasing consumer preference for online shopping.
- Key Drivers (Dogs & Cats): High pet ownership rates, increased spending per pet, and preference for premium products.
- Key Drivers (Pet Food): Focus on health and nutrition, convenience, and specialized dietary needs.
- Key Drivers (Supermarkets/Hypermarkets): Wide reach, accessibility, and established supply chains.
- Key Drivers (Online Retail): Convenience, broader product selection, and competitive pricing.
US Pet Industry Product Landscape
The US pet industry exhibits a diverse product landscape, with continuous innovation across various segments. Pet food is undergoing significant advancements, with a focus on natural ingredients, novel protein sources, and functional benefits tailored to specific pet needs. Supplies such as pet toys and bedding have evolved, emphasizing durability, safety, and interactive features. Technological advancements, including smart feeders and wearable health trackers, are enhancing pet care. Unique selling propositions frequently include organic certifications, hypoallergenic formulations, and tailored nutrition plans.
Key Drivers, Barriers & Challenges in US Pet Industry
Key Drivers:
- Rising pet ownership rates.
- Increasing disposable incomes among pet owners.
- Growing consumer awareness of pet health and nutrition.
- Technological advancements in pet care products.
Key Challenges & Restraints:
- Economic downturns impacting consumer spending on discretionary items.
- Supply chain disruptions affecting product availability and pricing.
- Increasing regulatory scrutiny and compliance costs.
- Intense competition from established players and emerging brands. The competitive landscape, while dominated by a few key players, is seeing increasing entrants leading to price wars and margin pressures.
Emerging Opportunities in US Pet Industry
- Growing demand for natural, organic, and sustainably sourced pet food.
- Increased adoption of pet insurance and specialized veterinary services.
- Expansion of personalized nutrition and health solutions based on pet genetics.
- Emergence of subscription-based pet product delivery services.
Growth Accelerators in the US Pet Industry Industry
Technological breakthroughs in pet food formulation, diagnostic tools, and personalized health solutions will significantly accelerate industry growth. Strategic partnerships between pet food manufacturers and veterinary professionals will enhance the development and delivery of tailored nutrition programs. Market expansion into niche pet segments and international markets further presents robust opportunities.
Key Players Shaping the US Pet Industry Market
- WellPet
- Nestle SA (Purina)
- The J M Smucker Company
- Darling Ingredients Inc
- Colgate Pamolive (Hill's Pet Nutrition)
- Pure and Natural Pet
- United Pet Group Inc
- Diamond Pet Foods
- Blue Buffalo Co Ltd
- Mars Inc
Notable Milestones in US Pet Industry Sector
- 2020: Increased demand for pet products during the COVID-19 pandemic.
- 2021: Significant investments in pet tech and personalized pet care solutions.
- 2022: Launch of several new organic and sustainable pet food brands.
- 2023: Increased focus on pet mental health and well-being. (Specific dates for these events are not available in the prompt, hence using years only).
In-Depth US Pet Industry Market Outlook
The US pet industry is poised for continued growth, driven by several factors, including rising pet ownership, increasing consumer spending on premium products, and the proliferation of innovative pet care solutions. The market is expected to experience robust expansion across all major segments, presenting significant opportunities for established players and new entrants alike. Strategic partnerships, product diversification, and technological advancements will be critical for success in this dynamic and competitive market. This market shows promising potential for substantial growth in the forecast period.
US Pet Industry Segmentation
-
1. Pet Type
- 1.1. Dog
- 1.2. Cat
- 1.3. Bird
- 1.4. Fresh Water Fish
- 1.5. Other Pet Types
-
2. Product Type
- 2.1. Food
- 2.2. Supplies/OTC Medicine
- 2.3. Other Product Types
-
3. Distribution Channel
- 3.1. Supermarkets/Hypermarkets
- 3.2. Specialty Stores
- 3.3. Online Retail Stores
- 3.4. Other Distribution Channels
US Pet Industry Segmentation By Geography
-
1. North America
- 1.1. United States
- 1.2. Canada
- 1.3. Mexico
-
2. South America
- 2.1. Brazil
- 2.2. Argentina
- 2.3. Rest of South America
-
3. Europe
- 3.1. United Kingdom
- 3.2. Germany
- 3.3. France
- 3.4. Italy
- 3.5. Spain
- 3.6. Russia
- 3.7. Benelux
- 3.8. Nordics
- 3.9. Rest of Europe
-
4. Middle East & Africa
- 4.1. Turkey
- 4.2. Israel
- 4.3. GCC
- 4.4. North Africa
- 4.5. South Africa
- 4.6. Rest of Middle East & Africa
-
5. Asia Pacific
- 5.1. China
- 5.2. India
- 5.3. Japan
- 5.4. South Korea
- 5.5. ASEAN
- 5.6. Oceania
- 5.7. Rest of Asia Pacific
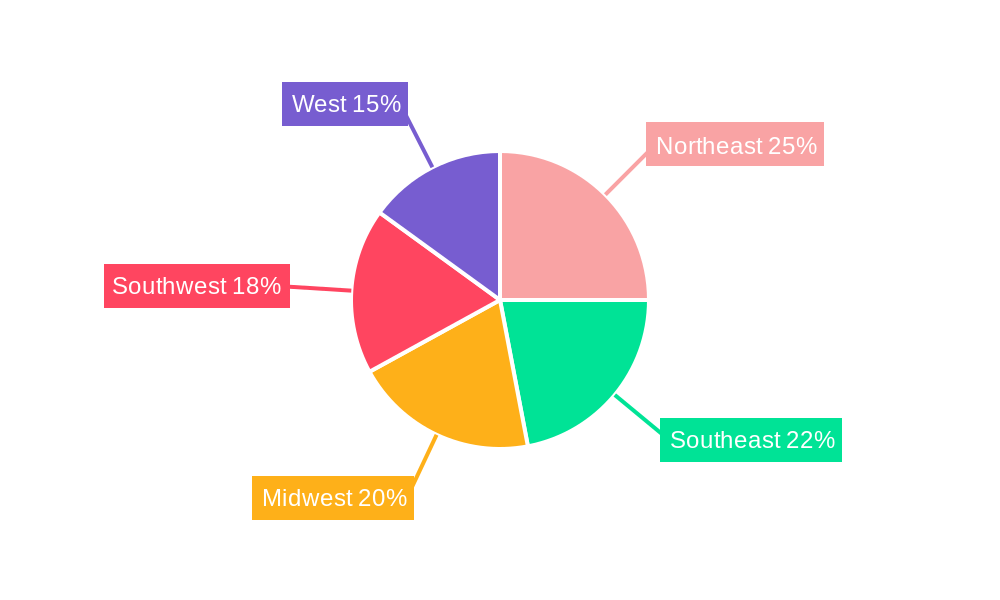
US Pet Industry Regional Market Share
Geographic Coverage of US Pet Industry
US Pet Industry REPORT HIGHLIGHTS
| Aspects | Details |
|---|---|
| Study Period | 2020-2034 |
| Base Year | 2025 |
| Estimated Year | 2026 |
| Forecast Period | 2026-2034 |
| Historical Period | 2020-2025 |
| Growth Rate | CAGR of 5.06% from 2020-2034 |
| Segmentation |
|
Table of Contents
- 1. Introduction
- 1.1. Research Scope
- 1.2. Market Segmentation
- 1.3. Research Objective
- 1.4. Definitions and Assumptions
- 2. Executive Summary
- 2.1. Market Snapshot
- 3. Market Dynamics
- 3.1. Market Drivers
- 3.2. Market Restrains
- 3.3. Market Trends
- 3.4. Market Opportunities
- 4. Market Factor Analysis
- 4.1. Porters Five Forces
- 4.1.1. Bargaining Power of Suppliers
- 4.1.2. Bargaining Power of Buyers
- 4.1.3. Threat of New Entrants
- 4.1.4. Threat of Substitutes
- 4.1.5. Competitive Rivalry
- 4.2. PESTEL analysis
- 4.3. BCG Analysis
- 4.3.1. Stars (High Growth, High Market Share)
- 4.3.2. Cash Cows (Low Growth, High Market Share)
- 4.3.3. Question Mark (High Growth, Low Market Share)
- 4.3.4. Dogs (Low Growth, Low Market Share)
- 4.4. Ansoff Matrix Analysis
- 4.5. Supply Chain Analysis
- 4.6. Regulatory Landscape
- 4.7. Current Market Potential and Opportunity Assessment (TAM–SAM–SOM Framework)
- 4.8. IMR Analyst Note
- 4.1. Porters Five Forces
- 5. Market Analysis, Insights and Forecast 2021-2033
- 5.1. Market Analysis, Insights and Forecast - by Pet Type
- 5.1.1. Dog
- 5.1.2. Cat
- 5.1.3. Bird
- 5.1.4. Fresh Water Fish
- 5.1.5. Other Pet Types
- 5.2. Market Analysis, Insights and Forecast - by Product Type
- 5.2.1. Food
- 5.2.2. Supplies/OTC Medicine
- 5.2.3. Other Product Types
- 5.3. Market Analysis, Insights and Forecast - by Distribution Channel
- 5.3.1. Supermarkets/Hypermarkets
- 5.3.2. Specialty Stores
- 5.3.3. Online Retail Stores
- 5.3.4. Other Distribution Channels
- 5.4. Market Analysis, Insights and Forecast - by Region
- 5.4.1. North America
- 5.4.2. South America
- 5.4.3. Europe
- 5.4.4. Middle East & Africa
- 5.4.5. Asia Pacific
- 5.1. Market Analysis, Insights and Forecast - by Pet Type
- 6. Global US Pet Industry Analysis, Insights and Forecast, 2021-2033
- 6.1. Market Analysis, Insights and Forecast - by Pet Type
- 6.1.1. Dog
- 6.1.2. Cat
- 6.1.3. Bird
- 6.1.4. Fresh Water Fish
- 6.1.5. Other Pet Types
- 6.2. Market Analysis, Insights and Forecast - by Product Type
- 6.2.1. Food
- 6.2.2. Supplies/OTC Medicine
- 6.2.3. Other Product Types
- 6.3. Market Analysis, Insights and Forecast - by Distribution Channel
- 6.3.1. Supermarkets/Hypermarkets
- 6.3.2. Specialty Stores
- 6.3.3. Online Retail Stores
- 6.3.4. Other Distribution Channels
- 6.1. Market Analysis, Insights and Forecast - by Pet Type
- 7. North America US Pet Industry Analysis, Insights and Forecast, 2020-2032
- 7.1. Market Analysis, Insights and Forecast - by Pet Type
- 7.1.1. Dog
- 7.1.2. Cat
- 7.1.3. Bird
- 7.1.4. Fresh Water Fish
- 7.1.5. Other Pet Types
- 7.2. Market Analysis, Insights and Forecast - by Product Type
- 7.2.1. Food
- 7.2.2. Supplies/OTC Medicine
- 7.2.3. Other Product Types
- 7.3. Market Analysis, Insights and Forecast - by Distribution Channel
- 7.3.1. Supermarkets/Hypermarkets
- 7.3.2. Specialty Stores
- 7.3.3. Online Retail Stores
- 7.3.4. Other Distribution Channels
- 7.1. Market Analysis, Insights and Forecast - by Pet Type
- 8. South America US Pet Industry Analysis, Insights and Forecast, 2020-2032
- 8.1. Market Analysis, Insights and Forecast - by Pet Type
- 8.1.1. Dog
- 8.1.2. Cat
- 8.1.3. Bird
- 8.1.4. Fresh Water Fish
- 8.1.5. Other Pet Types
- 8.2. Market Analysis, Insights and Forecast - by Product Type
- 8.2.1. Food
- 8.2.2. Supplies/OTC Medicine
- 8.2.3. Other Product Types
- 8.3. Market Analysis, Insights and Forecast - by Distribution Channel
- 8.3.1. Supermarkets/Hypermarkets
- 8.3.2. Specialty Stores
- 8.3.3. Online Retail Stores
- 8.3.4. Other Distribution Channels
- 8.1. Market Analysis, Insights and Forecast - by Pet Type
- 9. Europe US Pet Industry Analysis, Insights and Forecast, 2020-2032
- 9.1. Market Analysis, Insights and Forecast - by Pet Type
- 9.1.1. Dog
- 9.1.2. Cat
- 9.1.3. Bird
- 9.1.4. Fresh Water Fish
- 9.1.5. Other Pet Types
- 9.2. Market Analysis, Insights and Forecast - by Product Type
- 9.2.1. Food
- 9.2.2. Supplies/OTC Medicine
- 9.2.3. Other Product Types
- 9.3. Market Analysis, Insights and Forecast - by Distribution Channel
- 9.3.1. Supermarkets/Hypermarkets
- 9.3.2. Specialty Stores
- 9.3.3. Online Retail Stores
- 9.3.4. Other Distribution Channels
- 9.1. Market Analysis, Insights and Forecast - by Pet Type
- 10. Middle East & Africa US Pet Industry Analysis, Insights and Forecast, 2020-2032
- 10.1. Market Analysis, Insights and Forecast - by Pet Type
- 10.1.1. Dog
- 10.1.2. Cat
- 10.1.3. Bird
- 10.1.4. Fresh Water Fish
- 10.1.5. Other Pet Types
- 10.2. Market Analysis, Insights and Forecast - by Product Type
- 10.2.1. Food
- 10.2.2. Supplies/OTC Medicine
- 10.2.3. Other Product Types
- 10.3. Market Analysis, Insights and Forecast - by Distribution Channel
- 10.3.1. Supermarkets/Hypermarkets
- 10.3.2. Specialty Stores
- 10.3.3. Online Retail Stores
- 10.3.4. Other Distribution Channels
- 10.1. Market Analysis, Insights and Forecast - by Pet Type
- 11. Asia Pacific US Pet Industry Analysis, Insights and Forecast, 2020-2032
- 11.1. Market Analysis, Insights and Forecast - by Pet Type
- 11.1.1. Dog
- 11.1.2. Cat
- 11.1.3. Bird
- 11.1.4. Fresh Water Fish
- 11.1.5. Other Pet Types
- 11.2. Market Analysis, Insights and Forecast - by Product Type
- 11.2.1. Food
- 11.2.2. Supplies/OTC Medicine
- 11.2.3. Other Product Types
- 11.3. Market Analysis, Insights and Forecast - by Distribution Channel
- 11.3.1. Supermarkets/Hypermarkets
- 11.3.2. Specialty Stores
- 11.3.3. Online Retail Stores
- 11.3.4. Other Distribution Channels
- 11.1. Market Analysis, Insights and Forecast - by Pet Type
- 12. Competitive Analysis
- 12.1. Company Profiles
- 12.1.1 WellPet
- 12.1.1.1. Company Overview
- 12.1.1.2. Products
- 12.1.1.3. Company Financials
- 12.1.1.4. SWOT Analysis
- 12.1.2 Nestle SA (Purina)
- 12.1.2.1. Company Overview
- 12.1.2.2. Products
- 12.1.2.3. Company Financials
- 12.1.2.4. SWOT Analysis
- 12.1.3 The J M Smucker Company
- 12.1.3.1. Company Overview
- 12.1.3.2. Products
- 12.1.3.3. Company Financials
- 12.1.3.4. SWOT Analysis
- 12.1.4 Darling Ingredients Inc *List Not Exhaustive
- 12.1.4.1. Company Overview
- 12.1.4.2. Products
- 12.1.4.3. Company Financials
- 12.1.4.4. SWOT Analysis
- 12.1.5 Colgate Pamolive (Hill's Pet Nutrition)
- 12.1.5.1. Company Overview
- 12.1.5.2. Products
- 12.1.5.3. Company Financials
- 12.1.5.4. SWOT Analysis
- 12.1.6 Pure and Natural Pet
- 12.1.6.1. Company Overview
- 12.1.6.2. Products
- 12.1.6.3. Company Financials
- 12.1.6.4. SWOT Analysis
- 12.1.7 United Pet Group Inc
- 12.1.7.1. Company Overview
- 12.1.7.2. Products
- 12.1.7.3. Company Financials
- 12.1.7.4. SWOT Analysis
- 12.1.8 Diamond Pet Foods
- 12.1.8.1. Company Overview
- 12.1.8.2. Products
- 12.1.8.3. Company Financials
- 12.1.8.4. SWOT Analysis
- 12.1.9 Blue Buffalo Co Ltd
- 12.1.9.1. Company Overview
- 12.1.9.2. Products
- 12.1.9.3. Company Financials
- 12.1.9.4. SWOT Analysis
- 12.1.10 Mars Inc
- 12.1.10.1. Company Overview
- 12.1.10.2. Products
- 12.1.10.3. Company Financials
- 12.1.10.4. SWOT Analysis
- 12.1.1 WellPet
- 12.2. Market Entropy
- 12.2.1 Company's Key Areas Served
- 12.2.2 Recent Developments
- 12.3. Company Market Share Analysis 2025
- 12.3.1 Top 5 Companies Market Share Analysis
- 12.3.2 Top 3 Companies Market Share Analysis
- 12.4. List of Potential Customers
- 13. Research Methodology
List of Figures
- Figure 1: Global US Pet Industry Revenue Breakdown (Million, %) by Region 2025 & 2033
- Figure 2: North America US Pet Industry Revenue (Million), by Pet Type 2025 & 2033
- Figure 3: North America US Pet Industry Revenue Share (%), by Pet Type 2025 & 2033
- Figure 4: North America US Pet Industry Revenue (Million), by Product Type 2025 & 2033
- Figure 5: North America US Pet Industry Revenue Share (%), by Product Type 2025 & 2033
- Figure 6: North America US Pet Industry Revenue (Million), by Distribution Channel 2025 & 2033
- Figure 7: North America US Pet Industry Revenue Share (%), by Distribution Channel 2025 & 2033
- Figure 8: North America US Pet Industry Revenue (Million), by Country 2025 & 2033
- Figure 9: North America US Pet Industry Revenue Share (%), by Country 2025 & 2033
- Figure 10: South America US Pet Industry Revenue (Million), by Pet Type 2025 & 2033
- Figure 11: South America US Pet Industry Revenue Share (%), by Pet Type 2025 & 2033
- Figure 12: South America US Pet Industry Revenue (Million), by Product Type 2025 & 2033
- Figure 13: South America US Pet Industry Revenue Share (%), by Product Type 2025 & 2033
- Figure 14: South America US Pet Industry Revenue (Million), by Distribution Channel 2025 & 2033
- Figure 15: South America US Pet Industry Revenue Share (%), by Distribution Channel 2025 & 2033
- Figure 16: South America US Pet Industry Revenue (Million), by Country 2025 & 2033
- Figure 17: South America US Pet Industry Revenue Share (%), by Country 2025 & 2033
- Figure 18: Europe US Pet Industry Revenue (Million), by Pet Type 2025 & 2033
- Figure 19: Europe US Pet Industry Revenue Share (%), by Pet Type 2025 & 2033
- Figure 20: Europe US Pet Industry Revenue (Million), by Product Type 2025 & 2033
- Figure 21: Europe US Pet Industry Revenue Share (%), by Product Type 2025 & 2033
- Figure 22: Europe US Pet Industry Revenue (Million), by Distribution Channel 2025 & 2033
- Figure 23: Europe US Pet Industry Revenue Share (%), by Distribution Channel 2025 & 2033
- Figure 24: Europe US Pet Industry Revenue (Million), by Country 2025 & 2033
- Figure 25: Europe US Pet Industry Revenue Share (%), by Country 2025 & 2033
- Figure 26: Middle East & Africa US Pet Industry Revenue (Million), by Pet Type 2025 & 2033
- Figure 27: Middle East & Africa US Pet Industry Revenue Share (%), by Pet Type 2025 & 2033
- Figure 28: Middle East & Africa US Pet Industry Revenue (Million), by Product Type 2025 & 2033
- Figure 29: Middle East & Africa US Pet Industry Revenue Share (%), by Product Type 2025 & 2033
- Figure 30: Middle East & Africa US Pet Industry Revenue (Million), by Distribution Channel 2025 & 2033
- Figure 31: Middle East & Africa US Pet Industry Revenue Share (%), by Distribution Channel 2025 & 2033
- Figure 32: Middle East & Africa US Pet Industry Revenue (Million), by Country 2025 & 2033
- Figure 33: Middle East & Africa US Pet Industry Revenue Share (%), by Country 2025 & 2033
- Figure 34: Asia Pacific US Pet Industry Revenue (Million), by Pet Type 2025 & 2033
- Figure 35: Asia Pacific US Pet Industry Revenue Share (%), by Pet Type 2025 & 2033
- Figure 36: Asia Pacific US Pet Industry Revenue (Million), by Product Type 2025 & 2033
- Figure 37: Asia Pacific US Pet Industry Revenue Share (%), by Product Type 2025 & 2033
- Figure 38: Asia Pacific US Pet Industry Revenue (Million), by Distribution Channel 2025 & 2033
- Figure 39: Asia Pacific US Pet Industry Revenue Share (%), by Distribution Channel 2025 & 2033
- Figure 40: Asia Pacific US Pet Industry Revenue (Million), by Country 2025 & 2033
- Figure 41: Asia Pacific US Pet Industry Revenue Share (%), by Country 2025 & 2033
List of Tables
- Table 1: Global US Pet Industry Revenue Million Forecast, by Pet Type 2020 & 2033
- Table 2: Global US Pet Industry Revenue Million Forecast, by Product Type 2020 & 2033
- Table 3: Global US Pet Industry Revenue Million Forecast, by Distribution Channel 2020 & 2033
- Table 4: Global US Pet Industry Revenue Million Forecast, by Region 2020 & 2033
- Table 5: Global US Pet Industry Revenue Million Forecast, by Pet Type 2020 & 2033
- Table 6: Global US Pet Industry Revenue Million Forecast, by Product Type 2020 & 2033
- Table 7: Global US Pet Industry Revenue Million Forecast, by Distribution Channel 2020 & 2033
- Table 8: Global US Pet Industry Revenue Million Forecast, by Country 2020 & 2033
- Table 9: United States US Pet Industry Revenue (Million) Forecast, by Application 2020 & 2033
- Table 10: Canada US Pet Industry Revenue (Million) Forecast, by Application 2020 & 2033
- Table 11: Mexico US Pet Industry Revenue (Million) Forecast, by Application 2020 & 2033
- Table 12: Global US Pet Industry Revenue Million Forecast, by Pet Type 2020 & 2033
- Table 13: Global US Pet Industry Revenue Million Forecast, by Product Type 2020 & 2033
- Table 14: Global US Pet Industry Revenue Million Forecast, by Distribution Channel 2020 & 2033
- Table 15: Global US Pet Industry Revenue Million Forecast, by Country 2020 & 2033
- Table 16: Brazil US Pet Industry Revenue (Million) Forecast, by Application 2020 & 2033
- Table 17: Argentina US Pet Industry Revenue (Million) Forecast, by Application 2020 & 2033
- Table 18: Rest of South America US Pet Industry Revenue (Million) Forecast, by Application 2020 & 2033
- Table 19: Global US Pet Industry Revenue Million Forecast, by Pet Type 2020 & 2033
- Table 20: Global US Pet Industry Revenue Million Forecast, by Product Type 2020 & 2033
- Table 21: Global US Pet Industry Revenue Million Forecast, by Distribution Channel 2020 & 2033
- Table 22: Global US Pet Industry Revenue Million Forecast, by Country 2020 & 2033
- Table 23: United Kingdom US Pet Industry Revenue (Million) Forecast, by Application 2020 & 2033
- Table 24: Germany US Pet Industry Revenue (Million) Forecast, by Application 2020 & 2033
- Table 25: France US Pet Industry Revenue (Million) Forecast, by Application 2020 & 2033
- Table 26: Italy US Pet Industry Revenue (Million) Forecast, by Application 2020 & 2033
- Table 27: Spain US Pet Industry Revenue (Million) Forecast, by Application 2020 & 2033
- Table 28: Russia US Pet Industry Revenue (Million) Forecast, by Application 2020 & 2033
- Table 29: Benelux US Pet Industry Revenue (Million) Forecast, by Application 2020 & 2033
- Table 30: Nordics US Pet Industry Revenue (Million) Forecast, by Application 2020 & 2033
- Table 31: Rest of Europe US Pet Industry Revenue (Million) Forecast, by Application 2020 & 2033
- Table 32: Global US Pet Industry Revenue Million Forecast, by Pet Type 2020 & 2033
- Table 33: Global US Pet Industry Revenue Million Forecast, by Product Type 2020 & 2033
- Table 34: Global US Pet Industry Revenue Million Forecast, by Distribution Channel 2020 & 2033
- Table 35: Global US Pet Industry Revenue Million Forecast, by Country 2020 & 2033
- Table 36: Turkey US Pet Industry Revenue (Million) Forecast, by Application 2020 & 2033
- Table 37: Israel US Pet Industry Revenue (Million) Forecast, by Application 2020 & 2033
- Table 38: GCC US Pet Industry Revenue (Million) Forecast, by Application 2020 & 2033
- Table 39: North Africa US Pet Industry Revenue (Million) Forecast, by Application 2020 & 2033
- Table 40: South Africa US Pet Industry Revenue (Million) Forecast, by Application 2020 & 2033
- Table 41: Rest of Middle East & Africa US Pet Industry Revenue (Million) Forecast, by Application 2020 & 2033
- Table 42: Global US Pet Industry Revenue Million Forecast, by Pet Type 2020 & 2033
- Table 43: Global US Pet Industry Revenue Million Forecast, by Product Type 2020 & 2033
- Table 44: Global US Pet Industry Revenue Million Forecast, by Distribution Channel 2020 & 2033
- Table 45: Global US Pet Industry Revenue Million Forecast, by Country 2020 & 2033
- Table 46: China US Pet Industry Revenue (Million) Forecast, by Application 2020 & 2033
- Table 47: India US Pet Industry Revenue (Million) Forecast, by Application 2020 & 2033
- Table 48: Japan US Pet Industry Revenue (Million) Forecast, by Application 2020 & 2033
- Table 49: South Korea US Pet Industry Revenue (Million) Forecast, by Application 2020 & 2033
- Table 50: ASEAN US Pet Industry Revenue (Million) Forecast, by Application 2020 & 2033
- Table 51: Oceania US Pet Industry Revenue (Million) Forecast, by Application 2020 & 2033
- Table 52: Rest of Asia Pacific US Pet Industry Revenue (Million) Forecast, by Application 2020 & 2033
Frequently Asked Questions
1. What is the projected Compound Annual Growth Rate (CAGR) of the US Pet Industry?
The projected CAGR is approximately 5.06%.
2. Which companies are prominent players in the US Pet Industry?
Key companies in the market include WellPet, Nestle SA (Purina), The J M Smucker Company, Darling Ingredients Inc *List Not Exhaustive, Colgate Pamolive (Hill's Pet Nutrition), Pure and Natural Pet, United Pet Group Inc, Diamond Pet Foods, Blue Buffalo Co Ltd, Mars Inc.
3. What are the main segments of the US Pet Industry?
The market segments include Pet Type, Product Type, Distribution Channel.
4. Can you provide details about the market size?
The market size is estimated to be USD 80.69 Million as of 2022.
5. What are some drivers contributing to market growth?
Increased Pet Humanization; Growing Trend of E-commerce.
6. What are the notable trends driving market growth?
Increase in the Number of Pet Owners and Increased Expenditures on Pets.
7. Are there any restraints impacting market growth?
Rising Cost of Raw Material Production; Growing Concern Over Environment and Pet Health.
8. Can you provide examples of recent developments in the market?
N/A
9. What pricing options are available for accessing the report?
Pricing options include single-user, multi-user, and enterprise licenses priced at USD 3800, USD 4500, and USD 5800 respectively.
10. Is the market size provided in terms of value or volume?
The market size is provided in terms of value, measured in Million.
11. Are there any specific market keywords associated with the report?
Yes, the market keyword associated with the report is "US Pet Industry," which aids in identifying and referencing the specific market segment covered.
12. How do I determine which pricing option suits my needs best?
The pricing options vary based on user requirements and access needs. Individual users may opt for single-user licenses, while businesses requiring broader access may choose multi-user or enterprise licenses for cost-effective access to the report.
13. Are there any additional resources or data provided in the US Pet Industry report?
While the report offers comprehensive insights, it's advisable to review the specific contents or supplementary materials provided to ascertain if additional resources or data are available.
14. How can I stay updated on further developments or reports in the US Pet Industry?
To stay informed about further developments, trends, and reports in the US Pet Industry, consider subscribing to industry newsletters, following relevant companies and organizations, or regularly checking reputable industry news sources and publications.
Methodology
Step 1 - Identification of Relevant Samples Size from Population Database


Step 2 - Approaches for Defining Global Market Size (Value, Volume* & Price*)

Note*: In applicable scenarios
Step 3 - Data Sources
Primary Research
- Web Analytics
- Survey Reports
- Research Institute
- Latest Research Reports
- Opinion Leaders
Secondary Research
- Annual Reports
- White Paper
- Latest Press Release
- Industry Association
- Paid Database
- Investor Presentations

Step 4 - Data Triangulation
Involves using different sources of information in order to increase the validity of a study
These sources are likely to be stakeholders in a program - participants, other researchers, program staff, other community members, and so on.
Then we put all data in single framework & apply various statistical tools to find out the dynamic on the market.
During the analysis stage, feedback from the stakeholder groups would be compared to determine areas of agreement as well as areas of divergence