

Key Insights
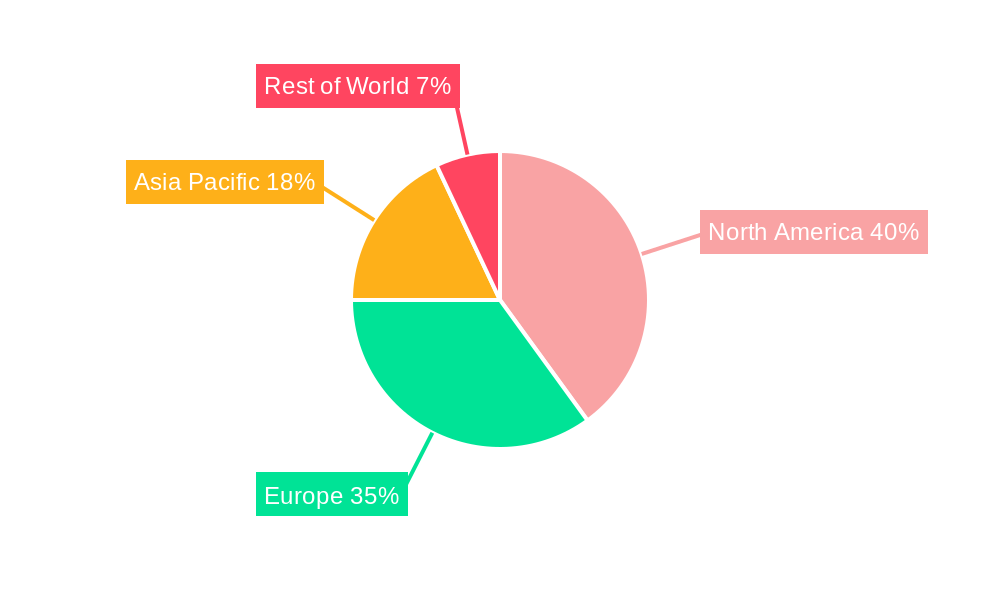
The global antibody production market is poised for significant expansion, fueled by the escalating demand for biopharmaceuticals, particularly monoclonal antibodies (mAbs), for treating complex diseases such as cancer and autoimmune disorders. This robust growth is supported by advancements in biotechnology, the increasing prevalence of chronic conditions requiring antibody-based therapies, and substantial investments in research and development for novel antibody formats. The pharmaceutical and biotechnology sectors, alongside research laboratories, represent key end-users. Upstream processing, including cell culture and purification, commands a larger market share than downstream processing, which focuses on final formulation. Monoclonal antibodies lead the antibody type segment due to their superior efficacy and specificity. North America and Europe are dominant markets, attributed to their established biopharmaceutical infrastructure and high healthcare spending. However, the Asia-Pacific region presents substantial growth potential, driven by rising healthcare expenditures and the adoption of advanced therapies.
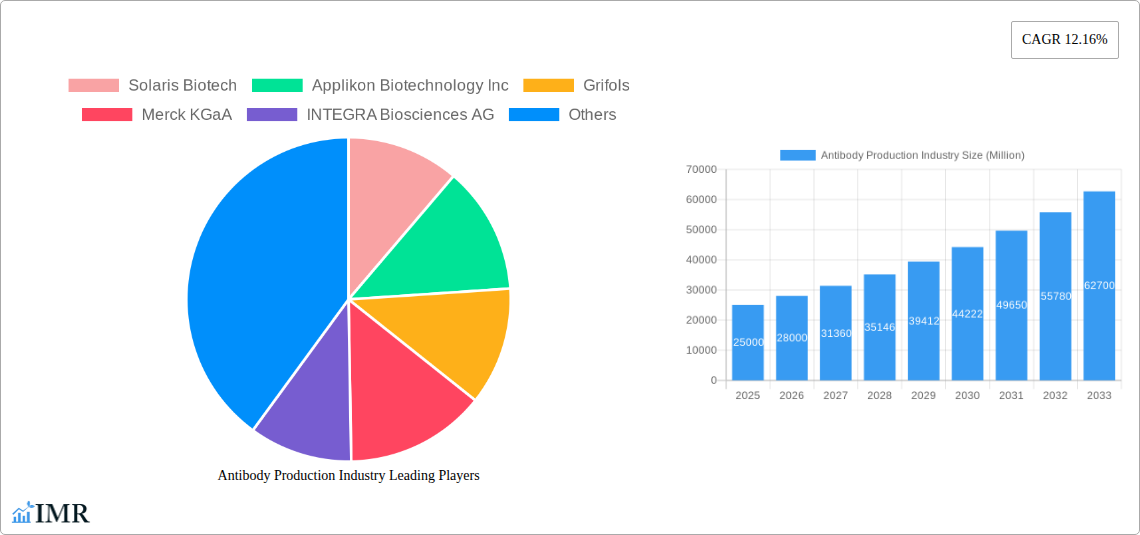
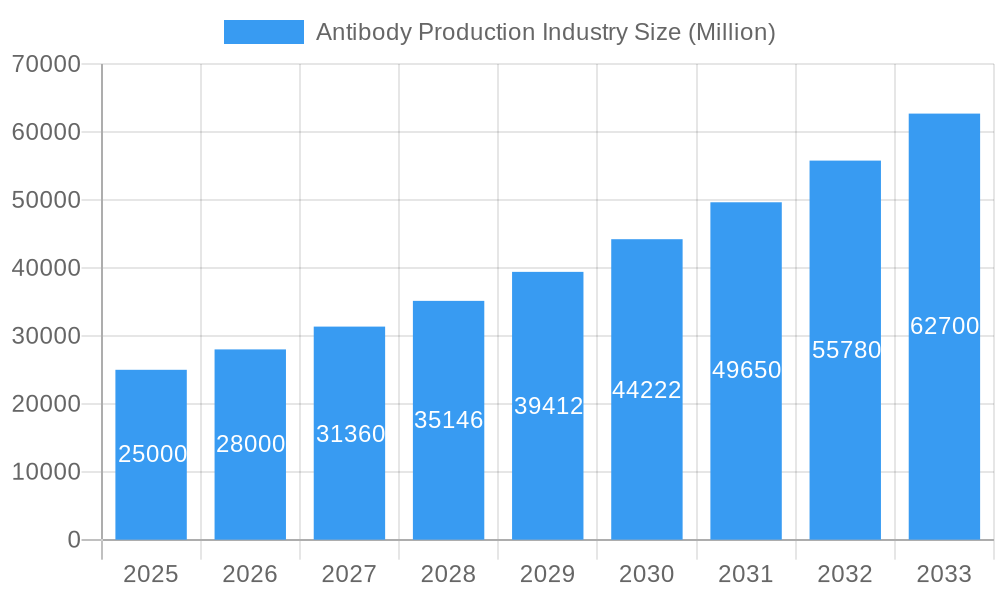
Antibody Production Industry Market Size (In Billion)
The market segmentation underscores the critical role of chromatography resins for filtration in antibody purification and the significant contribution of upstream and downstream processing consumables. Continuous innovation in antibody types and process optimization is expected to drive further market expansion. Industry players are prioritizing enhanced production efficiency, cost reduction, and the development of innovative antibody therapeutics to meet growing global demand. Future market trajectory will be influenced by regulatory approvals, technological breakthroughs, and the emergence of novel antibody-based treatments. Strategic collaborations and mergers & acquisitions are anticipated to reshape the competitive landscape.
Antibody Production Industry Company Market Share
Antibody Production Industry Market Outlook: 2019-2033
This comprehensive analysis of the Antibody Production Industry examines market dynamics, growth trajectories, regional segmentation, product landscape, and key market participants. The report covers the period from 2019 to 2033, with 2025 identified as the base year. The market size is projected to reach 22.62 billion units by 2033, exhibiting a compound annual growth rate (CAGR) of 12.7% during the forecast period (2025-2033). This report provides essential insights for industry professionals, investors, and researchers aiming to navigate and leverage opportunities within this dynamic market.
Antibody Production Industry Market Dynamics & Structure
The Antibody Production Industry is characterized by a moderately concentrated market structure, with several large players dominating alongside a number of smaller, specialized firms. Technological innovation, particularly in upstream and downstream processing, is a key driver, while regulatory frameworks (e.g., GMP compliance) significantly impact market operations. Competitive product substitutes, including alternative therapeutic modalities, exert pressure, though antibodies retain a crucial position. End-user demographics are dominated by pharmaceutical and biotechnology companies, research laboratories, and hospitals. Mergers and acquisitions (M&A) activity has been substantial, with larger companies acquiring smaller, innovative firms to expand their product portfolios and technological capabilities. The historical period (2019-2024) witnessed an average of xx M&A deals per year, with a predicted increase to xx deals annually during the forecast period.
- Market Concentration: Moderately concentrated, with top 5 players holding approximately xx% market share in 2024.
- Technological Innovation: Focus on automation, single-use technologies, and process intensification.
- Regulatory Framework: Stringent GMP regulations driving investment in quality control and manufacturing processes.
- Competitive Substitutes: Gene therapy and other biologics present competitive challenges.
- End-User Demographics: Pharmaceutical and biotechnology companies are the major consumers, followed by research labs.
- M&A Trends: Significant M&A activity, particularly among large players seeking to expand their product portfolios.
Antibody Production Industry Growth Trends & Insights
The Antibody Production Industry has experienced substantial growth over the past five years, driven by increasing demand for biopharmaceuticals, expanding research and development activities, and the rise of personalized medicine. The market size witnessed a CAGR of xx% during the historical period (2019-2024), and is projected to maintain a CAGR of xx% during the forecast period (2025-2033). This growth is attributed to several factors, including the successful development and commercialization of novel antibody therapeutics, advancements in antibody engineering technologies, and an increasing investment in biotechnology and pharmaceutical research. Monoclonal antibodies currently dominate the market, but polyclonal antibodies are gaining traction due to their potential advantages in specific therapeutic areas. Technological disruptions such as the adoption of continuous manufacturing processes are enhancing efficiency and reducing costs, while consumer behavior is increasingly focused on personalized and targeted therapies. Market penetration for monoclonal antibodies in oncology is projected to reach xx% by 2033.
Dominant Regions, Countries, or Segments in Antibody Production Industry
North America currently holds the largest market share in the Antibody Production Industry, driven by robust R&D investments, a well-established biopharmaceutical industry, and stringent regulatory frameworks. Europe follows as a significant market, with a strong presence of pharmaceutical companies and research institutions. The Asia-Pacific region shows strong growth potential, fueled by increasing healthcare expenditure and growing demand for biopharmaceuticals. Within segments, Monoclonal Antibodies dominate the Antibody Type segment, representing xx% of the market in 2024, while Upstream Processing leads the Process segment, accounting for xx% of market value. The Pharmaceutical and Biotechnology Companies segment holds the largest share in the End-User segment. Chromatography resins, particularly filtration, is a crucial component in downstream processing.
- Key Drivers (North America): High R&D investment, strong regulatory support, and well-established pharmaceutical industry.
- Key Drivers (Europe): Significant presence of pharmaceutical and biotech companies and strong scientific research.
- Key Drivers (Asia-Pacific): Increasing healthcare spending, growing middle class, and government initiatives.
- Segment Dominance: Monoclonal antibodies (Antibody Type), Upstream processing (Process), Pharmaceutical and Biotechnology Companies (End User).
Antibody Production Industry Product Landscape
The Antibody Production Industry offers a wide range of products, including monoclonal and polyclonal antibodies, chromatography resins, filtration systems, and various downstream processing consumables. Recent innovations focus on improving antibody efficacy, reducing manufacturing costs, and enhancing product safety and purity. Key advancements include the development of novel antibody formats, such as bispecific antibodies, and the adoption of advanced analytical techniques for quality control. Unique selling propositions often revolve around superior efficacy, improved safety profiles, and cost-effectiveness.
Key Drivers, Barriers & Challenges in Antibody Production Industry
Key Drivers:
- Growing demand for biopharmaceuticals.
- Advancements in antibody engineering technologies.
- Increasing investments in biotech and pharmaceutical research.
Challenges and Restraints:
- High manufacturing costs and complexities.
- Stringent regulatory requirements and approval processes.
- Intense competition from alternative therapeutic modalities.
- Supply chain disruptions impact the availability of raw materials and consumables. This resulted in a xx% increase in the price of certain critical raw materials in 2022.
Emerging Opportunities in Antibody Production Industry
- Growing demand for personalized medicine and targeted therapies.
- Development of novel antibody formats, such as bispecific antibodies and antibody-drug conjugates.
- Expansion into emerging markets with high growth potential.
- Application of AI and machine learning for antibody discovery and optimization.
Growth Accelerators in the Antibody Production Industry
Technological breakthroughs in antibody engineering, coupled with strategic partnerships between pharmaceutical companies and biotech firms, are accelerating market growth. Expansion into untapped markets, particularly in developing economies, and the development of innovative applications for antibodies in diverse therapeutic areas present significant opportunities.
Key Players Shaping the Antibody Production Industry Market
Notable Milestones in Antibody Production Industry Sector
- July 2022: GigaGen Inc. (a Grifols subsidiary) published research on its recombinant polyclonal antibody, GIGA-2050, targeting SARS-CoV-2, showcasing GMP manufacturing and IND-enabling studies. This highlights advancements in polyclonal antibody technology and potential for novel therapeutics.
- June 2022: The NIH launched a clinical trial for dupilumab, a monoclonal antibody, demonstrating its potential to improve asthma symptoms in children, signifying the expanding therapeutic applications of monoclonal antibodies.
In-Depth Antibody Production Industry Market Outlook
The Antibody Production Industry is poised for continued strong growth, driven by technological advancements, increasing R&D investments, and expanding therapeutic applications. Strategic partnerships, innovative product development, and expansion into emerging markets will be crucial for success. The market's future hinges on the ability of companies to innovate and adapt to evolving regulatory landscapes, offering cost-effective and efficacious antibody-based therapies.
Antibody Production Industry Segmentation
-
1. Antibody Type
- 1.1. Monoclonal Antibodies
- 1.2. Polyclonal Antibodies
- 1.3. Other Antibody Types
-
2. Process
-
2.1. Upstream Processing
- 2.1.1. Bioreactors
- 2.1.2. Consumables
-
2.2. Downstream Processing
- 2.2.1. Chromatography Systems
- 2.2.2. Chromatography Resins
- 2.3. Filtration
-
2.1. Upstream Processing
-
3. End User
- 3.1. Pharmaceutical and Biotechnology Companies
- 3.2. Research Laboratories
- 3.3. Other End Users
Antibody Production Industry Segmentation By Geography
-
1. North America
- 1.1. United States
- 1.2. Canada
- 1.3. Mexico
-
2. Europe
- 2.1. Germany
- 2.2. United Kingdom
- 2.3. France
- 2.4. Italy
- 2.5. Spain
- 2.6. Rest of Europe
-
3. Asia Pacific
- 3.1. China
- 3.2. Japan
- 3.3. India
- 3.4. Australia
- 3.5. South Korea
- 3.6. Rest of Asia Pacific
-
4. Middle East and Africa
- 4.1. GCC
- 4.2. South Africa
- 4.3. Rest of Middle East and Africa
-
5. South America
- 5.1. Brazil
- 5.2. Argentina
- 5.3. Rest of South America
Antibody Production Industry Regional Market Share
Geographic Coverage of Antibody Production Industry
Antibody Production Industry REPORT HIGHLIGHTS
| Aspects | Details |
|---|---|
| Study Period | 2020-2034 |
| Base Year | 2025 |
| Estimated Year | 2026 |
| Forecast Period | 2026-2034 |
| Historical Period | 2020-2025 |
| Growth Rate | CAGR of 12.7% from 2020-2034 |
| Segmentation |
|
Table of Contents
- 1. Introduction
- 1.1. Research Scope
- 1.2. Market Segmentation
- 1.3. Research Methodology
- 1.4. Definitions and Assumptions
- 2. Executive Summary
- 2.1. Introduction
- 3. Market Dynamics
- 3.1. Introduction
- 3.2. Market Drivers
- 3.2.1. Rising Adoption of Targeted Immunotherapy; Increase in the R&D Expenditure of Pharmaceutical and Biotechnology Companies; Rising Demand for Therapeutic Antibodies
- 3.3. Market Restrains
- 3.3.1. High Costs Involved in the Antibody Production; Stringent Government Regulations
- 3.4. Market Trends
- 3.4.1. The Monoclonal Antibodies Segment is Expected to Hold a Significant Market Share Over The Forecast Period
- 4. Market Factor Analysis
- 4.1. Porters Five Forces
- 4.2. Supply/Value Chain
- 4.3. PESTEL analysis
- 4.4. Market Entropy
- 4.5. Patent/Trademark Analysis
- 5. Global Antibody Production Industry Analysis, Insights and Forecast, 2020-2032
- 5.1. Market Analysis, Insights and Forecast - by Antibody Type
- 5.1.1. Monoclonal Antibodies
- 5.1.2. Polyclonal Antibodies
- 5.1.3. Other Antibody Types
- 5.2. Market Analysis, Insights and Forecast - by Process
- 5.2.1. Upstream Processing
- 5.2.1.1. Bioreactors
- 5.2.1.2. Consumables
- 5.2.2. Downstream Processing
- 5.2.2.1. Chromatography Systems
- 5.2.2.2. Chromatography Resins
- 5.2.3. Filtration
- 5.2.1. Upstream Processing
- 5.3. Market Analysis, Insights and Forecast - by End User
- 5.3.1. Pharmaceutical and Biotechnology Companies
- 5.3.2. Research Laboratories
- 5.3.3. Other End Users
- 5.4. Market Analysis, Insights and Forecast - by Region
- 5.4.1. North America
- 5.4.2. Europe
- 5.4.3. Asia Pacific
- 5.4.4. Middle East and Africa
- 5.4.5. South America
- 5.1. Market Analysis, Insights and Forecast - by Antibody Type
- 6. North America Antibody Production Industry Analysis, Insights and Forecast, 2020-2032
- 6.1. Market Analysis, Insights and Forecast - by Antibody Type
- 6.1.1. Monoclonal Antibodies
- 6.1.2. Polyclonal Antibodies
- 6.1.3. Other Antibody Types
- 6.2. Market Analysis, Insights and Forecast - by Process
- 6.2.1. Upstream Processing
- 6.2.1.1. Bioreactors
- 6.2.1.2. Consumables
- 6.2.2. Downstream Processing
- 6.2.2.1. Chromatography Systems
- 6.2.2.2. Chromatography Resins
- 6.2.3. Filtration
- 6.2.1. Upstream Processing
- 6.3. Market Analysis, Insights and Forecast - by End User
- 6.3.1. Pharmaceutical and Biotechnology Companies
- 6.3.2. Research Laboratories
- 6.3.3. Other End Users
- 6.1. Market Analysis, Insights and Forecast - by Antibody Type
- 7. Europe Antibody Production Industry Analysis, Insights and Forecast, 2020-2032
- 7.1. Market Analysis, Insights and Forecast - by Antibody Type
- 7.1.1. Monoclonal Antibodies
- 7.1.2. Polyclonal Antibodies
- 7.1.3. Other Antibody Types
- 7.2. Market Analysis, Insights and Forecast - by Process
- 7.2.1. Upstream Processing
- 7.2.1.1. Bioreactors
- 7.2.1.2. Consumables
- 7.2.2. Downstream Processing
- 7.2.2.1. Chromatography Systems
- 7.2.2.2. Chromatography Resins
- 7.2.3. Filtration
- 7.2.1. Upstream Processing
- 7.3. Market Analysis, Insights and Forecast - by End User
- 7.3.1. Pharmaceutical and Biotechnology Companies
- 7.3.2. Research Laboratories
- 7.3.3. Other End Users
- 7.1. Market Analysis, Insights and Forecast - by Antibody Type
- 8. Asia Pacific Antibody Production Industry Analysis, Insights and Forecast, 2020-2032
- 8.1. Market Analysis, Insights and Forecast - by Antibody Type
- 8.1.1. Monoclonal Antibodies
- 8.1.2. Polyclonal Antibodies
- 8.1.3. Other Antibody Types
- 8.2. Market Analysis, Insights and Forecast - by Process
- 8.2.1. Upstream Processing
- 8.2.1.1. Bioreactors
- 8.2.1.2. Consumables
- 8.2.2. Downstream Processing
- 8.2.2.1. Chromatography Systems
- 8.2.2.2. Chromatography Resins
- 8.2.3. Filtration
- 8.2.1. Upstream Processing
- 8.3. Market Analysis, Insights and Forecast - by End User
- 8.3.1. Pharmaceutical and Biotechnology Companies
- 8.3.2. Research Laboratories
- 8.3.3. Other End Users
- 8.1. Market Analysis, Insights and Forecast - by Antibody Type
- 9. Middle East and Africa Antibody Production Industry Analysis, Insights and Forecast, 2020-2032
- 9.1. Market Analysis, Insights and Forecast - by Antibody Type
- 9.1.1. Monoclonal Antibodies
- 9.1.2. Polyclonal Antibodies
- 9.1.3. Other Antibody Types
- 9.2. Market Analysis, Insights and Forecast - by Process
- 9.2.1. Upstream Processing
- 9.2.1.1. Bioreactors
- 9.2.1.2. Consumables
- 9.2.2. Downstream Processing
- 9.2.2.1. Chromatography Systems
- 9.2.2.2. Chromatography Resins
- 9.2.3. Filtration
- 9.2.1. Upstream Processing
- 9.3. Market Analysis, Insights and Forecast - by End User
- 9.3.1. Pharmaceutical and Biotechnology Companies
- 9.3.2. Research Laboratories
- 9.3.3. Other End Users
- 9.1. Market Analysis, Insights and Forecast - by Antibody Type
- 10. South America Antibody Production Industry Analysis, Insights and Forecast, 2020-2032
- 10.1. Market Analysis, Insights and Forecast - by Antibody Type
- 10.1.1. Monoclonal Antibodies
- 10.1.2. Polyclonal Antibodies
- 10.1.3. Other Antibody Types
- 10.2. Market Analysis, Insights and Forecast - by Process
- 10.2.1. Upstream Processing
- 10.2.1.1. Bioreactors
- 10.2.1.2. Consumables
- 10.2.2. Downstream Processing
- 10.2.2.1. Chromatography Systems
- 10.2.2.2. Chromatography Resins
- 10.2.3. Filtration
- 10.2.1. Upstream Processing
- 10.3. Market Analysis, Insights and Forecast - by End User
- 10.3.1. Pharmaceutical and Biotechnology Companies
- 10.3.2. Research Laboratories
- 10.3.3. Other End Users
- 10.1. Market Analysis, Insights and Forecast - by Antibody Type
- 11. Competitive Analysis
- 11.1. Global Market Share Analysis 2025
- 11.2. Company Profiles
- 11.2.1 Solaris Biotech
- 11.2.1.1. Overview
- 11.2.1.2. Products
- 11.2.1.3. SWOT Analysis
- 11.2.1.4. Recent Developments
- 11.2.1.5. Financials (Based on Availability)
- 11.2.2 Applikon Biotechnology Inc
- 11.2.2.1. Overview
- 11.2.2.2. Products
- 11.2.2.3. SWOT Analysis
- 11.2.2.4. Recent Developments
- 11.2.2.5. Financials (Based on Availability)
- 11.2.3 Grifols
- 11.2.3.1. Overview
- 11.2.3.2. Products
- 11.2.3.3. SWOT Analysis
- 11.2.3.4. Recent Developments
- 11.2.3.5. Financials (Based on Availability)
- 11.2.4 Merck KGaA
- 11.2.4.1. Overview
- 11.2.4.2. Products
- 11.2.4.3. SWOT Analysis
- 11.2.4.4. Recent Developments
- 11.2.4.5. Financials (Based on Availability)
- 11.2.5 INTEGRA Biosciences AG
- 11.2.5.1. Overview
- 11.2.5.2. Products
- 11.2.5.3. SWOT Analysis
- 11.2.5.4. Recent Developments
- 11.2.5.5. Financials (Based on Availability)
- 11.2.6 FiberCell Systems Inc
- 11.2.6.1. Overview
- 11.2.6.2. Products
- 11.2.6.3. SWOT Analysis
- 11.2.6.4. Recent Developments
- 11.2.6.5. Financials (Based on Availability)
- 11.2.7 Thermo Fisher Scientific Inc
- 11.2.7.1. Overview
- 11.2.7.2. Products
- 11.2.7.3. SWOT Analysis
- 11.2.7.4. Recent Developments
- 11.2.7.5. Financials (Based on Availability)
- 11.2.8 Eppendorf AG
- 11.2.8.1. Overview
- 11.2.8.2. Products
- 11.2.8.3. SWOT Analysis
- 11.2.8.4. Recent Developments
- 11.2.8.5. Financials (Based on Availability)
- 11.2.9 Sartorius AG
- 11.2.9.1. Overview
- 11.2.9.2. Products
- 11.2.9.3. SWOT Analysis
- 11.2.9.4. Recent Developments
- 11.2.9.5. Financials (Based on Availability)
- 11.2.10 Danaher Corporation
- 11.2.10.1. Overview
- 11.2.10.2. Products
- 11.2.10.3. SWOT Analysis
- 11.2.10.4. Recent Developments
- 11.2.10.5. Financials (Based on Availability)
- 11.2.11 F Hoffmann-La Roche AG
- 11.2.11.1. Overview
- 11.2.11.2. Products
- 11.2.11.3. SWOT Analysis
- 11.2.11.4. Recent Developments
- 11.2.11.5. Financials (Based on Availability)
- 11.2.12 Genetix Biotech Asia Pvt Ltd
- 11.2.12.1. Overview
- 11.2.12.2. Products
- 11.2.12.3. SWOT Analysis
- 11.2.12.4. Recent Developments
- 11.2.12.5. Financials (Based on Availability)
- 11.2.1 Solaris Biotech
List of Figures
- Figure 1: Global Antibody Production Industry Revenue Breakdown (billion, %) by Region 2025 & 2033
- Figure 2: Global Antibody Production Industry Volume Breakdown (K Unit, %) by Region 2025 & 2033
- Figure 3: North America Antibody Production Industry Revenue (billion), by Antibody Type 2025 & 2033
- Figure 4: North America Antibody Production Industry Volume (K Unit), by Antibody Type 2025 & 2033
- Figure 5: North America Antibody Production Industry Revenue Share (%), by Antibody Type 2025 & 2033
- Figure 6: North America Antibody Production Industry Volume Share (%), by Antibody Type 2025 & 2033
- Figure 7: North America Antibody Production Industry Revenue (billion), by Process 2025 & 2033
- Figure 8: North America Antibody Production Industry Volume (K Unit), by Process 2025 & 2033
- Figure 9: North America Antibody Production Industry Revenue Share (%), by Process 2025 & 2033
- Figure 10: North America Antibody Production Industry Volume Share (%), by Process 2025 & 2033
- Figure 11: North America Antibody Production Industry Revenue (billion), by End User 2025 & 2033
- Figure 12: North America Antibody Production Industry Volume (K Unit), by End User 2025 & 2033
- Figure 13: North America Antibody Production Industry Revenue Share (%), by End User 2025 & 2033
- Figure 14: North America Antibody Production Industry Volume Share (%), by End User 2025 & 2033
- Figure 15: North America Antibody Production Industry Revenue (billion), by Country 2025 & 2033
- Figure 16: North America Antibody Production Industry Volume (K Unit), by Country 2025 & 2033
- Figure 17: North America Antibody Production Industry Revenue Share (%), by Country 2025 & 2033
- Figure 18: North America Antibody Production Industry Volume Share (%), by Country 2025 & 2033
- Figure 19: Europe Antibody Production Industry Revenue (billion), by Antibody Type 2025 & 2033
- Figure 20: Europe Antibody Production Industry Volume (K Unit), by Antibody Type 2025 & 2033
- Figure 21: Europe Antibody Production Industry Revenue Share (%), by Antibody Type 2025 & 2033
- Figure 22: Europe Antibody Production Industry Volume Share (%), by Antibody Type 2025 & 2033
- Figure 23: Europe Antibody Production Industry Revenue (billion), by Process 2025 & 2033
- Figure 24: Europe Antibody Production Industry Volume (K Unit), by Process 2025 & 2033
- Figure 25: Europe Antibody Production Industry Revenue Share (%), by Process 2025 & 2033
- Figure 26: Europe Antibody Production Industry Volume Share (%), by Process 2025 & 2033
- Figure 27: Europe Antibody Production Industry Revenue (billion), by End User 2025 & 2033
- Figure 28: Europe Antibody Production Industry Volume (K Unit), by End User 2025 & 2033
- Figure 29: Europe Antibody Production Industry Revenue Share (%), by End User 2025 & 2033
- Figure 30: Europe Antibody Production Industry Volume Share (%), by End User 2025 & 2033
- Figure 31: Europe Antibody Production Industry Revenue (billion), by Country 2025 & 2033
- Figure 32: Europe Antibody Production Industry Volume (K Unit), by Country 2025 & 2033
- Figure 33: Europe Antibody Production Industry Revenue Share (%), by Country 2025 & 2033
- Figure 34: Europe Antibody Production Industry Volume Share (%), by Country 2025 & 2033
- Figure 35: Asia Pacific Antibody Production Industry Revenue (billion), by Antibody Type 2025 & 2033
- Figure 36: Asia Pacific Antibody Production Industry Volume (K Unit), by Antibody Type 2025 & 2033
- Figure 37: Asia Pacific Antibody Production Industry Revenue Share (%), by Antibody Type 2025 & 2033
- Figure 38: Asia Pacific Antibody Production Industry Volume Share (%), by Antibody Type 2025 & 2033
- Figure 39: Asia Pacific Antibody Production Industry Revenue (billion), by Process 2025 & 2033
- Figure 40: Asia Pacific Antibody Production Industry Volume (K Unit), by Process 2025 & 2033
- Figure 41: Asia Pacific Antibody Production Industry Revenue Share (%), by Process 2025 & 2033
- Figure 42: Asia Pacific Antibody Production Industry Volume Share (%), by Process 2025 & 2033
- Figure 43: Asia Pacific Antibody Production Industry Revenue (billion), by End User 2025 & 2033
- Figure 44: Asia Pacific Antibody Production Industry Volume (K Unit), by End User 2025 & 2033
- Figure 45: Asia Pacific Antibody Production Industry Revenue Share (%), by End User 2025 & 2033
- Figure 46: Asia Pacific Antibody Production Industry Volume Share (%), by End User 2025 & 2033
- Figure 47: Asia Pacific Antibody Production Industry Revenue (billion), by Country 2025 & 2033
- Figure 48: Asia Pacific Antibody Production Industry Volume (K Unit), by Country 2025 & 2033
- Figure 49: Asia Pacific Antibody Production Industry Revenue Share (%), by Country 2025 & 2033
- Figure 50: Asia Pacific Antibody Production Industry Volume Share (%), by Country 2025 & 2033
- Figure 51: Middle East and Africa Antibody Production Industry Revenue (billion), by Antibody Type 2025 & 2033
- Figure 52: Middle East and Africa Antibody Production Industry Volume (K Unit), by Antibody Type 2025 & 2033
- Figure 53: Middle East and Africa Antibody Production Industry Revenue Share (%), by Antibody Type 2025 & 2033
- Figure 54: Middle East and Africa Antibody Production Industry Volume Share (%), by Antibody Type 2025 & 2033
- Figure 55: Middle East and Africa Antibody Production Industry Revenue (billion), by Process 2025 & 2033
- Figure 56: Middle East and Africa Antibody Production Industry Volume (K Unit), by Process 2025 & 2033
- Figure 57: Middle East and Africa Antibody Production Industry Revenue Share (%), by Process 2025 & 2033
- Figure 58: Middle East and Africa Antibody Production Industry Volume Share (%), by Process 2025 & 2033
- Figure 59: Middle East and Africa Antibody Production Industry Revenue (billion), by End User 2025 & 2033
- Figure 60: Middle East and Africa Antibody Production Industry Volume (K Unit), by End User 2025 & 2033
- Figure 61: Middle East and Africa Antibody Production Industry Revenue Share (%), by End User 2025 & 2033
- Figure 62: Middle East and Africa Antibody Production Industry Volume Share (%), by End User 2025 & 2033
- Figure 63: Middle East and Africa Antibody Production Industry Revenue (billion), by Country 2025 & 2033
- Figure 64: Middle East and Africa Antibody Production Industry Volume (K Unit), by Country 2025 & 2033
- Figure 65: Middle East and Africa Antibody Production Industry Revenue Share (%), by Country 2025 & 2033
- Figure 66: Middle East and Africa Antibody Production Industry Volume Share (%), by Country 2025 & 2033
- Figure 67: South America Antibody Production Industry Revenue (billion), by Antibody Type 2025 & 2033
- Figure 68: South America Antibody Production Industry Volume (K Unit), by Antibody Type 2025 & 2033
- Figure 69: South America Antibody Production Industry Revenue Share (%), by Antibody Type 2025 & 2033
- Figure 70: South America Antibody Production Industry Volume Share (%), by Antibody Type 2025 & 2033
- Figure 71: South America Antibody Production Industry Revenue (billion), by Process 2025 & 2033
- Figure 72: South America Antibody Production Industry Volume (K Unit), by Process 2025 & 2033
- Figure 73: South America Antibody Production Industry Revenue Share (%), by Process 2025 & 2033
- Figure 74: South America Antibody Production Industry Volume Share (%), by Process 2025 & 2033
- Figure 75: South America Antibody Production Industry Revenue (billion), by End User 2025 & 2033
- Figure 76: South America Antibody Production Industry Volume (K Unit), by End User 2025 & 2033
- Figure 77: South America Antibody Production Industry Revenue Share (%), by End User 2025 & 2033
- Figure 78: South America Antibody Production Industry Volume Share (%), by End User 2025 & 2033
- Figure 79: South America Antibody Production Industry Revenue (billion), by Country 2025 & 2033
- Figure 80: South America Antibody Production Industry Volume (K Unit), by Country 2025 & 2033
- Figure 81: South America Antibody Production Industry Revenue Share (%), by Country 2025 & 2033
- Figure 82: South America Antibody Production Industry Volume Share (%), by Country 2025 & 2033
List of Tables
- Table 1: Global Antibody Production Industry Revenue billion Forecast, by Antibody Type 2020 & 2033
- Table 2: Global Antibody Production Industry Volume K Unit Forecast, by Antibody Type 2020 & 2033
- Table 3: Global Antibody Production Industry Revenue billion Forecast, by Process 2020 & 2033
- Table 4: Global Antibody Production Industry Volume K Unit Forecast, by Process 2020 & 2033
- Table 5: Global Antibody Production Industry Revenue billion Forecast, by End User 2020 & 2033
- Table 6: Global Antibody Production Industry Volume K Unit Forecast, by End User 2020 & 2033
- Table 7: Global Antibody Production Industry Revenue billion Forecast, by Region 2020 & 2033
- Table 8: Global Antibody Production Industry Volume K Unit Forecast, by Region 2020 & 2033
- Table 9: Global Antibody Production Industry Revenue billion Forecast, by Antibody Type 2020 & 2033
- Table 10: Global Antibody Production Industry Volume K Unit Forecast, by Antibody Type 2020 & 2033
- Table 11: Global Antibody Production Industry Revenue billion Forecast, by Process 2020 & 2033
- Table 12: Global Antibody Production Industry Volume K Unit Forecast, by Process 2020 & 2033
- Table 13: Global Antibody Production Industry Revenue billion Forecast, by End User 2020 & 2033
- Table 14: Global Antibody Production Industry Volume K Unit Forecast, by End User 2020 & 2033
- Table 15: Global Antibody Production Industry Revenue billion Forecast, by Country 2020 & 2033
- Table 16: Global Antibody Production Industry Volume K Unit Forecast, by Country 2020 & 2033
- Table 17: United States Antibody Production Industry Revenue (billion) Forecast, by Application 2020 & 2033
- Table 18: United States Antibody Production Industry Volume (K Unit) Forecast, by Application 2020 & 2033
- Table 19: Canada Antibody Production Industry Revenue (billion) Forecast, by Application 2020 & 2033
- Table 20: Canada Antibody Production Industry Volume (K Unit) Forecast, by Application 2020 & 2033
- Table 21: Mexico Antibody Production Industry Revenue (billion) Forecast, by Application 2020 & 2033
- Table 22: Mexico Antibody Production Industry Volume (K Unit) Forecast, by Application 2020 & 2033
- Table 23: Global Antibody Production Industry Revenue billion Forecast, by Antibody Type 2020 & 2033
- Table 24: Global Antibody Production Industry Volume K Unit Forecast, by Antibody Type 2020 & 2033
- Table 25: Global Antibody Production Industry Revenue billion Forecast, by Process 2020 & 2033
- Table 26: Global Antibody Production Industry Volume K Unit Forecast, by Process 2020 & 2033
- Table 27: Global Antibody Production Industry Revenue billion Forecast, by End User 2020 & 2033
- Table 28: Global Antibody Production Industry Volume K Unit Forecast, by End User 2020 & 2033
- Table 29: Global Antibody Production Industry Revenue billion Forecast, by Country 2020 & 2033
- Table 30: Global Antibody Production Industry Volume K Unit Forecast, by Country 2020 & 2033
- Table 31: Germany Antibody Production Industry Revenue (billion) Forecast, by Application 2020 & 2033
- Table 32: Germany Antibody Production Industry Volume (K Unit) Forecast, by Application 2020 & 2033
- Table 33: United Kingdom Antibody Production Industry Revenue (billion) Forecast, by Application 2020 & 2033
- Table 34: United Kingdom Antibody Production Industry Volume (K Unit) Forecast, by Application 2020 & 2033
- Table 35: France Antibody Production Industry Revenue (billion) Forecast, by Application 2020 & 2033
- Table 36: France Antibody Production Industry Volume (K Unit) Forecast, by Application 2020 & 2033
- Table 37: Italy Antibody Production Industry Revenue (billion) Forecast, by Application 2020 & 2033
- Table 38: Italy Antibody Production Industry Volume (K Unit) Forecast, by Application 2020 & 2033
- Table 39: Spain Antibody Production Industry Revenue (billion) Forecast, by Application 2020 & 2033
- Table 40: Spain Antibody Production Industry Volume (K Unit) Forecast, by Application 2020 & 2033
- Table 41: Rest of Europe Antibody Production Industry Revenue (billion) Forecast, by Application 2020 & 2033
- Table 42: Rest of Europe Antibody Production Industry Volume (K Unit) Forecast, by Application 2020 & 2033
- Table 43: Global Antibody Production Industry Revenue billion Forecast, by Antibody Type 2020 & 2033
- Table 44: Global Antibody Production Industry Volume K Unit Forecast, by Antibody Type 2020 & 2033
- Table 45: Global Antibody Production Industry Revenue billion Forecast, by Process 2020 & 2033
- Table 46: Global Antibody Production Industry Volume K Unit Forecast, by Process 2020 & 2033
- Table 47: Global Antibody Production Industry Revenue billion Forecast, by End User 2020 & 2033
- Table 48: Global Antibody Production Industry Volume K Unit Forecast, by End User 2020 & 2033
- Table 49: Global Antibody Production Industry Revenue billion Forecast, by Country 2020 & 2033
- Table 50: Global Antibody Production Industry Volume K Unit Forecast, by Country 2020 & 2033
- Table 51: China Antibody Production Industry Revenue (billion) Forecast, by Application 2020 & 2033
- Table 52: China Antibody Production Industry Volume (K Unit) Forecast, by Application 2020 & 2033
- Table 53: Japan Antibody Production Industry Revenue (billion) Forecast, by Application 2020 & 2033
- Table 54: Japan Antibody Production Industry Volume (K Unit) Forecast, by Application 2020 & 2033
- Table 55: India Antibody Production Industry Revenue (billion) Forecast, by Application 2020 & 2033
- Table 56: India Antibody Production Industry Volume (K Unit) Forecast, by Application 2020 & 2033
- Table 57: Australia Antibody Production Industry Revenue (billion) Forecast, by Application 2020 & 2033
- Table 58: Australia Antibody Production Industry Volume (K Unit) Forecast, by Application 2020 & 2033
- Table 59: South Korea Antibody Production Industry Revenue (billion) Forecast, by Application 2020 & 2033
- Table 60: South Korea Antibody Production Industry Volume (K Unit) Forecast, by Application 2020 & 2033
- Table 61: Rest of Asia Pacific Antibody Production Industry Revenue (billion) Forecast, by Application 2020 & 2033
- Table 62: Rest of Asia Pacific Antibody Production Industry Volume (K Unit) Forecast, by Application 2020 & 2033
- Table 63: Global Antibody Production Industry Revenue billion Forecast, by Antibody Type 2020 & 2033
- Table 64: Global Antibody Production Industry Volume K Unit Forecast, by Antibody Type 2020 & 2033
- Table 65: Global Antibody Production Industry Revenue billion Forecast, by Process 2020 & 2033
- Table 66: Global Antibody Production Industry Volume K Unit Forecast, by Process 2020 & 2033
- Table 67: Global Antibody Production Industry Revenue billion Forecast, by End User 2020 & 2033
- Table 68: Global Antibody Production Industry Volume K Unit Forecast, by End User 2020 & 2033
- Table 69: Global Antibody Production Industry Revenue billion Forecast, by Country 2020 & 2033
- Table 70: Global Antibody Production Industry Volume K Unit Forecast, by Country 2020 & 2033
- Table 71: GCC Antibody Production Industry Revenue (billion) Forecast, by Application 2020 & 2033
- Table 72: GCC Antibody Production Industry Volume (K Unit) Forecast, by Application 2020 & 2033
- Table 73: South Africa Antibody Production Industry Revenue (billion) Forecast, by Application 2020 & 2033
- Table 74: South Africa Antibody Production Industry Volume (K Unit) Forecast, by Application 2020 & 2033
- Table 75: Rest of Middle East and Africa Antibody Production Industry Revenue (billion) Forecast, by Application 2020 & 2033
- Table 76: Rest of Middle East and Africa Antibody Production Industry Volume (K Unit) Forecast, by Application 2020 & 2033
- Table 77: Global Antibody Production Industry Revenue billion Forecast, by Antibody Type 2020 & 2033
- Table 78: Global Antibody Production Industry Volume K Unit Forecast, by Antibody Type 2020 & 2033
- Table 79: Global Antibody Production Industry Revenue billion Forecast, by Process 2020 & 2033
- Table 80: Global Antibody Production Industry Volume K Unit Forecast, by Process 2020 & 2033
- Table 81: Global Antibody Production Industry Revenue billion Forecast, by End User 2020 & 2033
- Table 82: Global Antibody Production Industry Volume K Unit Forecast, by End User 2020 & 2033
- Table 83: Global Antibody Production Industry Revenue billion Forecast, by Country 2020 & 2033
- Table 84: Global Antibody Production Industry Volume K Unit Forecast, by Country 2020 & 2033
- Table 85: Brazil Antibody Production Industry Revenue (billion) Forecast, by Application 2020 & 2033
- Table 86: Brazil Antibody Production Industry Volume (K Unit) Forecast, by Application 2020 & 2033
- Table 87: Argentina Antibody Production Industry Revenue (billion) Forecast, by Application 2020 & 2033
- Table 88: Argentina Antibody Production Industry Volume (K Unit) Forecast, by Application 2020 & 2033
- Table 89: Rest of South America Antibody Production Industry Revenue (billion) Forecast, by Application 2020 & 2033
- Table 90: Rest of South America Antibody Production Industry Volume (K Unit) Forecast, by Application 2020 & 2033
Frequently Asked Questions
1. What is the projected Compound Annual Growth Rate (CAGR) of the Antibody Production Industry?
The projected CAGR is approximately 12.7%.
2. Which companies are prominent players in the Antibody Production Industry?
Key companies in the market include Solaris Biotech, Applikon Biotechnology Inc, Grifols, Merck KGaA, INTEGRA Biosciences AG, FiberCell Systems Inc , Thermo Fisher Scientific Inc, Eppendorf AG, Sartorius AG, Danaher Corporation, F Hoffmann-La Roche AG, Genetix Biotech Asia Pvt Ltd.
3. What are the main segments of the Antibody Production Industry?
The market segments include Antibody Type, Process, End User.
4. Can you provide details about the market size?
The market size is estimated to be USD 22.62 billion as of 2022.
5. What are some drivers contributing to market growth?
Rising Adoption of Targeted Immunotherapy; Increase in the R&D Expenditure of Pharmaceutical and Biotechnology Companies; Rising Demand for Therapeutic Antibodies.
6. What are the notable trends driving market growth?
The Monoclonal Antibodies Segment is Expected to Hold a Significant Market Share Over The Forecast Period.
7. Are there any restraints impacting market growth?
High Costs Involved in the Antibody Production; Stringent Government Regulations.
8. Can you provide examples of recent developments in the market?
July 2022: GigaGen Inc., a subsidiary of Grifols, published a research article in the international peer-reviewed journal Pathogens. The article showcased the GMP (good manufacturing practice) manufacturing and IND (Investigational New Drug)-enabling studies of its new class of drugs, recombinant polyclonal antibodies, describing the company's recombinant polyclonal product that targets SARS-CoV-2, GIGA-2050.
9. What pricing options are available for accessing the report?
Pricing options include single-user, multi-user, and enterprise licenses priced at USD 4750, USD 5250, and USD 8750 respectively.
10. Is the market size provided in terms of value or volume?
The market size is provided in terms of value, measured in billion and volume, measured in K Unit.
11. Are there any specific market keywords associated with the report?
Yes, the market keyword associated with the report is "Antibody Production Industry," which aids in identifying and referencing the specific market segment covered.
12. How do I determine which pricing option suits my needs best?
The pricing options vary based on user requirements and access needs. Individual users may opt for single-user licenses, while businesses requiring broader access may choose multi-user or enterprise licenses for cost-effective access to the report.
13. Are there any additional resources or data provided in the Antibody Production Industry report?
While the report offers comprehensive insights, it's advisable to review the specific contents or supplementary materials provided to ascertain if additional resources or data are available.
14. How can I stay updated on further developments or reports in the Antibody Production Industry?
To stay informed about further developments, trends, and reports in the Antibody Production Industry, consider subscribing to industry newsletters, following relevant companies and organizations, or regularly checking reputable industry news sources and publications.
Methodology
Step 1 - Identification of Relevant Samples Size from Population Database


Step 2 - Approaches for Defining Global Market Size (Value, Volume* & Price*)

Note*: In applicable scenarios
Step 3 - Data Sources
Primary Research
- Web Analytics
- Survey Reports
- Research Institute
- Latest Research Reports
- Opinion Leaders
Secondary Research
- Annual Reports
- White Paper
- Latest Press Release
- Industry Association
- Paid Database
- Investor Presentations

Step 4 - Data Triangulation
Involves using different sources of information in order to increase the validity of a study
These sources are likely to be stakeholders in a program - participants, other researchers, program staff, other community members, and so on.
Then we put all data in single framework & apply various statistical tools to find out the dynamic on the market.
During the analysis stage, feedback from the stakeholder groups would be compared to determine areas of agreement as well as areas of divergence