

Key Insights
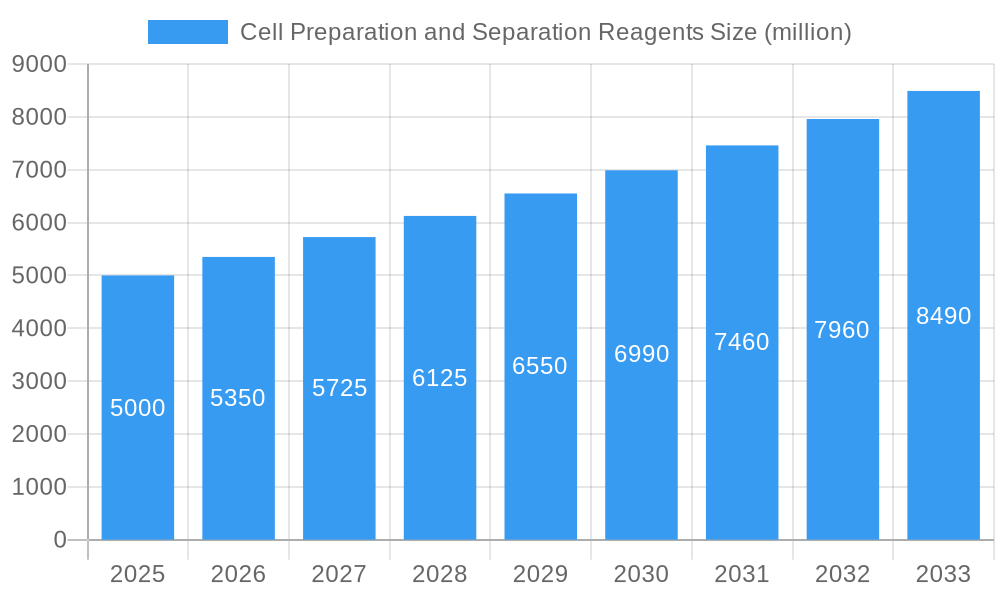
The global market for cell preparation and separation reagents is experiencing robust growth, driven by the increasing adoption of advanced cell-based therapies, burgeoning research in regenerative medicine, and the expanding application of cell analysis techniques in drug discovery and development. The market, estimated at $5 billion in 2025, is projected to exhibit a compound annual growth rate (CAGR) of approximately 7% from 2025 to 2033, reaching a value exceeding $8 billion by the end of the forecast period. Key drivers include the rising prevalence of chronic diseases necessitating advanced treatment modalities, the increasing demand for personalized medicine, and continuous technological advancements leading to more efficient and precise cell separation techniques. Companies such as BD, Sigma-Aldrich, R&D Systems, and Abcam are major players in this dynamic market, continuously innovating and expanding their product portfolios to cater to evolving research and clinical needs.
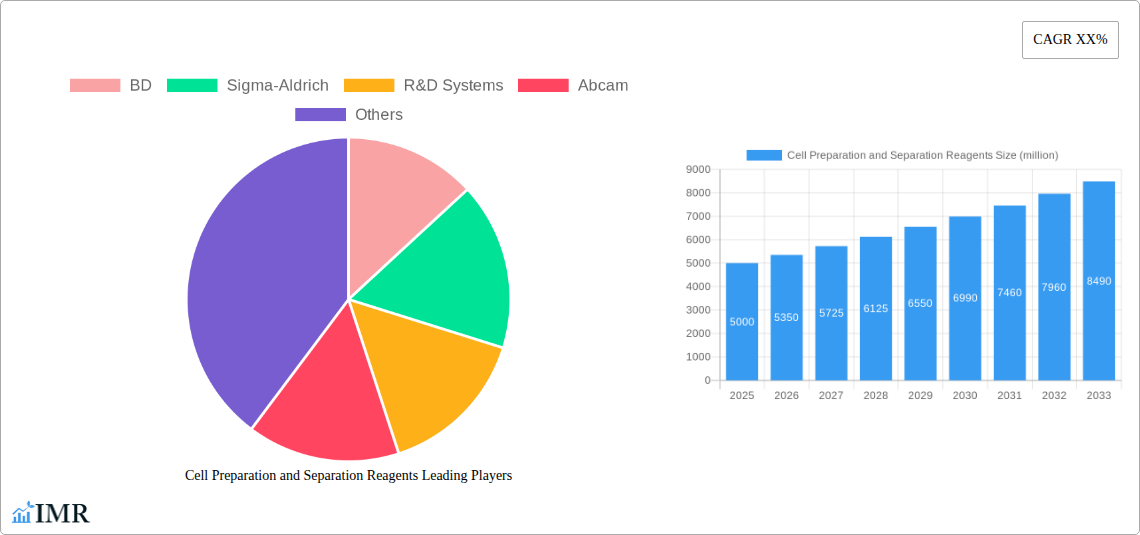
Cell Preparation and Separation Reagents Market Size (In Billion)
Significant market trends include the increasing demand for automated cell sorting systems, the growing adoption of single-cell analysis technologies, and the development of novel reagents optimized for specific cell types. While regulatory hurdles and the high cost of advanced technologies pose certain challenges, the overall market outlook remains positive, fueled by substantial investments in biomedical research and the expanding potential of cell-based therapies across diverse applications, from cancer treatment to tissue engineering. The historical period (2019-2024) likely saw a similar growth trajectory, with the market steadily expanding due to these underlying factors. Regional variations exist, with North America and Europe currently holding a larger share, but emerging economies in Asia-Pacific are poised for significant growth in the coming years.
Cell Preparation and Separation Reagents Company Market Share
Cell Preparation and Separation Reagents Market Report: 2019-2033
This comprehensive report provides a detailed analysis of the Cell Preparation and Separation Reagents market, encompassing market dynamics, growth trends, regional analysis, product landscape, key players, and future outlook. The report covers the period 2019-2033, with a focus on the forecast period 2025-2033, using 2025 as the base year and estimated year. The parent market is the life sciences reagents market, while the child market is specifically cell culture reagents. Market values are presented in million units.
Cell Preparation and Separation Reagents Market Dynamics & Structure
The global Cell Preparation and Separation Reagents market is characterized by moderate concentration, with key players like BD, Sigma-Aldrich, R&D Systems, and Abcam holding significant market share. The market size in 2025 is estimated at $XX million, projected to reach $YY million by 2033, exhibiting a CAGR of XX%. Technological innovation, driven by advancements in cell biology and genomics, is a primary growth driver. Stringent regulatory frameworks, particularly concerning safety and efficacy, influence market dynamics. Competitive pressures stem from both established players and emerging companies offering innovative products. End-users encompass academic research institutions, pharmaceutical and biotechnology companies, and clinical diagnostic laboratories. M&A activity in the sector has been moderate in recent years, with approximately XX deals recorded between 2019 and 2024, primarily focused on expanding product portfolios and geographical reach.
- Market Concentration: Moderately concentrated, with top 4 players holding approximately XX% market share in 2025.
- Technological Innovation: Advancements in flow cytometry, magnetic-activated cell sorting (MACS), and microfluidics are driving growth.
- Regulatory Landscape: Stringent regulatory approvals (e.g., FDA, EMA) impact product development and market entry.
- Competitive Landscape: Intense competition driven by product differentiation, pricing strategies, and innovation.
- End-User Demographics: Predominantly research institutions (XX%), pharmaceutical/biotech companies (YY%), and clinical diagnostic labs (ZZ%).
- M&A Activity: Approximately XX deals between 2019-2024, focusing on portfolio diversification and market expansion.
Cell Preparation and Separation Reagents Growth Trends & Insights
The Cell Preparation and Separation Reagents market has witnessed significant growth over the historical period (2019-2024), driven by increasing demand for advanced cell-based research and therapies. Adoption rates for novel separation technologies, such as microfluidic devices and high-throughput screening platforms, are increasing steadily. Technological disruptions, including automation and miniaturization, have improved efficiency and reduced costs. Consumer behavior shifts towards personalized medicine and advanced diagnostics further fuel market expansion. The market experienced a CAGR of XX% from 2019 to 2024 and is projected to maintain a CAGR of YY% from 2025 to 2033. Market penetration for advanced separation technologies is currently at XX% and is expected to reach YY% by 2033. This growth is fueled by several factors including the rise of personalized medicine, the increasing prevalence of chronic diseases, and growing government investments in research and development.
Dominant Regions, Countries, or Segments in Cell Preparation and Separation Reagents
North America currently dominates the Cell Preparation and Separation Reagents market, owing to substantial investments in life sciences research, a strong presence of key market players, and well-established regulatory frameworks. Europe follows as a significant market, with strong academic research infrastructure and increasing adoption of advanced technologies. The Asia-Pacific region exhibits substantial growth potential, driven by expanding research activities, rising healthcare expenditure, and favorable government policies.
- North America: High market share (XX%) due to robust research infrastructure, presence of major players, and high healthcare spending.
- Europe: Significant market presence (YY%) driven by strong research and development activities and increasing healthcare investments.
- Asia-Pacific: Rapidly growing market (ZZ%) propelled by rising healthcare expenditure and government support for life sciences research.
- Key Drivers: Government funding for research, increasing prevalence of chronic diseases, and advancements in cell-based therapies.
Cell Preparation and Separation Reagents Product Landscape
The Cell Preparation and Separation Reagents market offers a wide array of products, encompassing reagents for cell lysis, DNA/RNA extraction, protein purification, and cell sorting. Innovations focus on improving efficiency, specificity, and scalability of these processes. Technological advancements, such as the development of novel affinity ligands and automated systems, enhance product performance. Unique selling propositions often center on ease of use, superior purity, and high throughput capabilities.
Key Drivers, Barriers & Challenges in Cell Preparation and Separation Reagents
Key Drivers: The increasing prevalence of chronic diseases necessitates advanced diagnostic and therapeutic tools, driving the demand for cell preparation and separation reagents. Technological advancements continually improve the efficiency and precision of separation techniques. Government funding and initiatives supporting life sciences research further contribute to market growth.
Challenges & Restraints: High costs associated with advanced reagents and equipment can limit accessibility. Stringent regulatory approvals and quality control requirements can slow down product development and market entry. Competition from established players and emerging companies impacts market share and pricing. Supply chain disruptions can affect the availability and cost of raw materials, resulting in price volatility.
Emerging Opportunities in Cell Preparation and Separation Reagents
Emerging opportunities lie in the development of novel reagents for cell therapy applications, particularly in areas like CAR T-cell therapy and regenerative medicine. Expansion into untapped markets in developing countries, driven by increasing healthcare infrastructure and research funding, presents significant growth potential. The development of point-of-care diagnostic tools utilizing cell separation techniques promises to revolutionize healthcare delivery.
Growth Accelerators in the Cell Preparation and Separation Reagents Industry
Strategic partnerships between reagent manufacturers and technology providers accelerate innovation and market expansion. Technological breakthroughs in cell manipulation techniques, such as CRISPR-Cas9 gene editing and microfluidic devices, create new applications and enhance product performance. Expansion into new therapeutic areas, such as immunotherapy and gene therapy, opens up significant growth opportunities.
Key Players Shaping the Cell Preparation and Separation Reagents Market
Notable Milestones in Cell Preparation and Separation Reagents Sector
- 2020: Launch of a novel automated cell sorting system by BD Biosciences.
- 2021: Acquisition of a smaller reagent company by Sigma-Aldrich, expanding its product portfolio.
- 2022: FDA approval of a new cell preparation reagent for use in clinical trials.
- 2023: Introduction of a microfluidic-based cell separation platform by a new entrant.
- 2024: Publication of a landmark study highlighting the improved efficacy of a novel cell separation reagent.
In-Depth Cell Preparation and Separation Reagents Market Outlook
The future of the Cell Preparation and Separation Reagents market is promising, driven by continued technological advancements, increasing demand for personalized medicine, and expanding applications in various therapeutic areas. Strategic partnerships, investment in research and development, and the expansion into emerging markets will further contribute to market growth. Companies that invest in innovation and efficiently navigate the regulatory landscape will be well-positioned to capture significant market share in the coming years.
Cell Preparation and Separation Reagents Segmentation
-
1. Application
- 1.1. Life Sciences
- 1.2. Pharmaceutical Industry
- 1.3. Scientific Research
- 1.4. Other
-
2. Types
- 2.1. Magnetic Cell Separation Reagents
- 2.2. Blood Lysis and Cell Preparation Reagents
Cell Preparation and Separation Reagents Segmentation By Geography
-
1. North America
- 1.1. United States
- 1.2. Canada
- 1.3. Mexico
-
2. South America
- 2.1. Brazil
- 2.2. Argentina
- 2.3. Rest of South America
-
3. Europe
- 3.1. United Kingdom
- 3.2. Germany
- 3.3. France
- 3.4. Italy
- 3.5. Spain
- 3.6. Russia
- 3.7. Benelux
- 3.8. Nordics
- 3.9. Rest of Europe
-
4. Middle East & Africa
- 4.1. Turkey
- 4.2. Israel
- 4.3. GCC
- 4.4. North Africa
- 4.5. South Africa
- 4.6. Rest of Middle East & Africa
-
5. Asia Pacific
- 5.1. China
- 5.2. India
- 5.3. Japan
- 5.4. South Korea
- 5.5. ASEAN
- 5.6. Oceania
- 5.7. Rest of Asia Pacific
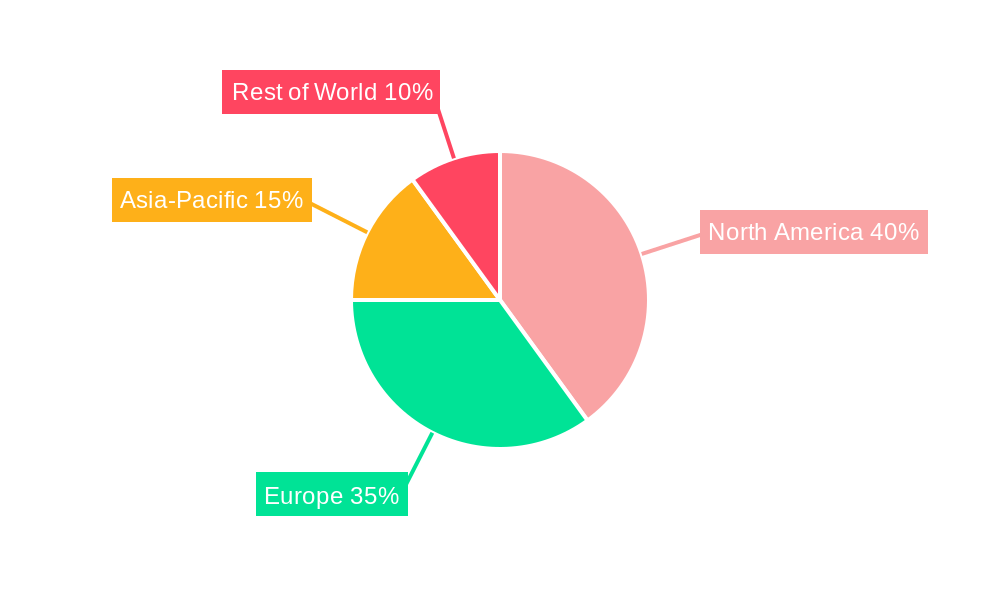
Cell Preparation and Separation Reagents Regional Market Share
Geographic Coverage of Cell Preparation and Separation Reagents
Cell Preparation and Separation Reagents REPORT HIGHLIGHTS
| Aspects | Details |
|---|---|
| Study Period | 2020-2034 |
| Base Year | 2025 |
| Estimated Year | 2026 |
| Forecast Period | 2026-2034 |
| Historical Period | 2020-2025 |
| Growth Rate | CAGR of XX% from 2020-2034 |
| Segmentation |
|
Table of Contents
- 1. Introduction
- 1.1. Research Scope
- 1.2. Market Segmentation
- 1.3. Research Methodology
- 1.4. Definitions and Assumptions
- 2. Executive Summary
- 2.1. Introduction
- 3. Market Dynamics
- 3.1. Introduction
- 3.2. Market Drivers
- 3.3. Market Restrains
- 3.4. Market Trends
- 4. Market Factor Analysis
- 4.1. Porters Five Forces
- 4.2. Supply/Value Chain
- 4.3. PESTEL analysis
- 4.4. Market Entropy
- 4.5. Patent/Trademark Analysis
- 5. Global Cell Preparation and Separation Reagents Analysis, Insights and Forecast, 2020-2032
- 5.1. Market Analysis, Insights and Forecast - by Application
- 5.1.1. Life Sciences
- 5.1.2. Pharmaceutical Industry
- 5.1.3. Scientific Research
- 5.1.4. Other
- 5.2. Market Analysis, Insights and Forecast - by Types
- 5.2.1. Magnetic Cell Separation Reagents
- 5.2.2. Blood Lysis and Cell Preparation Reagents
- 5.3. Market Analysis, Insights and Forecast - by Region
- 5.3.1. North America
- 5.3.2. South America
- 5.3.3. Europe
- 5.3.4. Middle East & Africa
- 5.3.5. Asia Pacific
- 5.1. Market Analysis, Insights and Forecast - by Application
- 6. North America Cell Preparation and Separation Reagents Analysis, Insights and Forecast, 2020-2032
- 6.1. Market Analysis, Insights and Forecast - by Application
- 6.1.1. Life Sciences
- 6.1.2. Pharmaceutical Industry
- 6.1.3. Scientific Research
- 6.1.4. Other
- 6.2. Market Analysis, Insights and Forecast - by Types
- 6.2.1. Magnetic Cell Separation Reagents
- 6.2.2. Blood Lysis and Cell Preparation Reagents
- 6.1. Market Analysis, Insights and Forecast - by Application
- 7. South America Cell Preparation and Separation Reagents Analysis, Insights and Forecast, 2020-2032
- 7.1. Market Analysis, Insights and Forecast - by Application
- 7.1.1. Life Sciences
- 7.1.2. Pharmaceutical Industry
- 7.1.3. Scientific Research
- 7.1.4. Other
- 7.2. Market Analysis, Insights and Forecast - by Types
- 7.2.1. Magnetic Cell Separation Reagents
- 7.2.2. Blood Lysis and Cell Preparation Reagents
- 7.1. Market Analysis, Insights and Forecast - by Application
- 8. Europe Cell Preparation and Separation Reagents Analysis, Insights and Forecast, 2020-2032
- 8.1. Market Analysis, Insights and Forecast - by Application
- 8.1.1. Life Sciences
- 8.1.2. Pharmaceutical Industry
- 8.1.3. Scientific Research
- 8.1.4. Other
- 8.2. Market Analysis, Insights and Forecast - by Types
- 8.2.1. Magnetic Cell Separation Reagents
- 8.2.2. Blood Lysis and Cell Preparation Reagents
- 8.1. Market Analysis, Insights and Forecast - by Application
- 9. Middle East & Africa Cell Preparation and Separation Reagents Analysis, Insights and Forecast, 2020-2032
- 9.1. Market Analysis, Insights and Forecast - by Application
- 9.1.1. Life Sciences
- 9.1.2. Pharmaceutical Industry
- 9.1.3. Scientific Research
- 9.1.4. Other
- 9.2. Market Analysis, Insights and Forecast - by Types
- 9.2.1. Magnetic Cell Separation Reagents
- 9.2.2. Blood Lysis and Cell Preparation Reagents
- 9.1. Market Analysis, Insights and Forecast - by Application
- 10. Asia Pacific Cell Preparation and Separation Reagents Analysis, Insights and Forecast, 2020-2032
- 10.1. Market Analysis, Insights and Forecast - by Application
- 10.1.1. Life Sciences
- 10.1.2. Pharmaceutical Industry
- 10.1.3. Scientific Research
- 10.1.4. Other
- 10.2. Market Analysis, Insights and Forecast - by Types
- 10.2.1. Magnetic Cell Separation Reagents
- 10.2.2. Blood Lysis and Cell Preparation Reagents
- 10.1. Market Analysis, Insights and Forecast - by Application
- 11. Competitive Analysis
- 11.1. Global Market Share Analysis 2025
- 11.2. Company Profiles
- 11.2.1 BD
- 11.2.1.1. Overview
- 11.2.1.2. Products
- 11.2.1.3. SWOT Analysis
- 11.2.1.4. Recent Developments
- 11.2.1.5. Financials (Based on Availability)
- 11.2.2 Sigma-Aldrich
- 11.2.2.1. Overview
- 11.2.2.2. Products
- 11.2.2.3. SWOT Analysis
- 11.2.2.4. Recent Developments
- 11.2.2.5. Financials (Based on Availability)
- 11.2.3 R&D Systems
- 11.2.3.1. Overview
- 11.2.3.2. Products
- 11.2.3.3. SWOT Analysis
- 11.2.3.4. Recent Developments
- 11.2.3.5. Financials (Based on Availability)
- 11.2.4 Abcam
- 11.2.4.1. Overview
- 11.2.4.2. Products
- 11.2.4.3. SWOT Analysis
- 11.2.4.4. Recent Developments
- 11.2.4.5. Financials (Based on Availability)
- 11.2.1 BD
List of Figures
- Figure 1: Global Cell Preparation and Separation Reagents Revenue Breakdown (million, %) by Region 2025 & 2033
- Figure 2: Global Cell Preparation and Separation Reagents Volume Breakdown (K, %) by Region 2025 & 2033
- Figure 3: North America Cell Preparation and Separation Reagents Revenue (million), by Application 2025 & 2033
- Figure 4: North America Cell Preparation and Separation Reagents Volume (K), by Application 2025 & 2033
- Figure 5: North America Cell Preparation and Separation Reagents Revenue Share (%), by Application 2025 & 2033
- Figure 6: North America Cell Preparation and Separation Reagents Volume Share (%), by Application 2025 & 2033
- Figure 7: North America Cell Preparation and Separation Reagents Revenue (million), by Types 2025 & 2033
- Figure 8: North America Cell Preparation and Separation Reagents Volume (K), by Types 2025 & 2033
- Figure 9: North America Cell Preparation and Separation Reagents Revenue Share (%), by Types 2025 & 2033
- Figure 10: North America Cell Preparation and Separation Reagents Volume Share (%), by Types 2025 & 2033
- Figure 11: North America Cell Preparation and Separation Reagents Revenue (million), by Country 2025 & 2033
- Figure 12: North America Cell Preparation and Separation Reagents Volume (K), by Country 2025 & 2033
- Figure 13: North America Cell Preparation and Separation Reagents Revenue Share (%), by Country 2025 & 2033
- Figure 14: North America Cell Preparation and Separation Reagents Volume Share (%), by Country 2025 & 2033
- Figure 15: South America Cell Preparation and Separation Reagents Revenue (million), by Application 2025 & 2033
- Figure 16: South America Cell Preparation and Separation Reagents Volume (K), by Application 2025 & 2033
- Figure 17: South America Cell Preparation and Separation Reagents Revenue Share (%), by Application 2025 & 2033
- Figure 18: South America Cell Preparation and Separation Reagents Volume Share (%), by Application 2025 & 2033
- Figure 19: South America Cell Preparation and Separation Reagents Revenue (million), by Types 2025 & 2033
- Figure 20: South America Cell Preparation and Separation Reagents Volume (K), by Types 2025 & 2033
- Figure 21: South America Cell Preparation and Separation Reagents Revenue Share (%), by Types 2025 & 2033
- Figure 22: South America Cell Preparation and Separation Reagents Volume Share (%), by Types 2025 & 2033
- Figure 23: South America Cell Preparation and Separation Reagents Revenue (million), by Country 2025 & 2033
- Figure 24: South America Cell Preparation and Separation Reagents Volume (K), by Country 2025 & 2033
- Figure 25: South America Cell Preparation and Separation Reagents Revenue Share (%), by Country 2025 & 2033
- Figure 26: South America Cell Preparation and Separation Reagents Volume Share (%), by Country 2025 & 2033
- Figure 27: Europe Cell Preparation and Separation Reagents Revenue (million), by Application 2025 & 2033
- Figure 28: Europe Cell Preparation and Separation Reagents Volume (K), by Application 2025 & 2033
- Figure 29: Europe Cell Preparation and Separation Reagents Revenue Share (%), by Application 2025 & 2033
- Figure 30: Europe Cell Preparation and Separation Reagents Volume Share (%), by Application 2025 & 2033
- Figure 31: Europe Cell Preparation and Separation Reagents Revenue (million), by Types 2025 & 2033
- Figure 32: Europe Cell Preparation and Separation Reagents Volume (K), by Types 2025 & 2033
- Figure 33: Europe Cell Preparation and Separation Reagents Revenue Share (%), by Types 2025 & 2033
- Figure 34: Europe Cell Preparation and Separation Reagents Volume Share (%), by Types 2025 & 2033
- Figure 35: Europe Cell Preparation and Separation Reagents Revenue (million), by Country 2025 & 2033
- Figure 36: Europe Cell Preparation and Separation Reagents Volume (K), by Country 2025 & 2033
- Figure 37: Europe Cell Preparation and Separation Reagents Revenue Share (%), by Country 2025 & 2033
- Figure 38: Europe Cell Preparation and Separation Reagents Volume Share (%), by Country 2025 & 2033
- Figure 39: Middle East & Africa Cell Preparation and Separation Reagents Revenue (million), by Application 2025 & 2033
- Figure 40: Middle East & Africa Cell Preparation and Separation Reagents Volume (K), by Application 2025 & 2033
- Figure 41: Middle East & Africa Cell Preparation and Separation Reagents Revenue Share (%), by Application 2025 & 2033
- Figure 42: Middle East & Africa Cell Preparation and Separation Reagents Volume Share (%), by Application 2025 & 2033
- Figure 43: Middle East & Africa Cell Preparation and Separation Reagents Revenue (million), by Types 2025 & 2033
- Figure 44: Middle East & Africa Cell Preparation and Separation Reagents Volume (K), by Types 2025 & 2033
- Figure 45: Middle East & Africa Cell Preparation and Separation Reagents Revenue Share (%), by Types 2025 & 2033
- Figure 46: Middle East & Africa Cell Preparation and Separation Reagents Volume Share (%), by Types 2025 & 2033
- Figure 47: Middle East & Africa Cell Preparation and Separation Reagents Revenue (million), by Country 2025 & 2033
- Figure 48: Middle East & Africa Cell Preparation and Separation Reagents Volume (K), by Country 2025 & 2033
- Figure 49: Middle East & Africa Cell Preparation and Separation Reagents Revenue Share (%), by Country 2025 & 2033
- Figure 50: Middle East & Africa Cell Preparation and Separation Reagents Volume Share (%), by Country 2025 & 2033
- Figure 51: Asia Pacific Cell Preparation and Separation Reagents Revenue (million), by Application 2025 & 2033
- Figure 52: Asia Pacific Cell Preparation and Separation Reagents Volume (K), by Application 2025 & 2033
- Figure 53: Asia Pacific Cell Preparation and Separation Reagents Revenue Share (%), by Application 2025 & 2033
- Figure 54: Asia Pacific Cell Preparation and Separation Reagents Volume Share (%), by Application 2025 & 2033
- Figure 55: Asia Pacific Cell Preparation and Separation Reagents Revenue (million), by Types 2025 & 2033
- Figure 56: Asia Pacific Cell Preparation and Separation Reagents Volume (K), by Types 2025 & 2033
- Figure 57: Asia Pacific Cell Preparation and Separation Reagents Revenue Share (%), by Types 2025 & 2033
- Figure 58: Asia Pacific Cell Preparation and Separation Reagents Volume Share (%), by Types 2025 & 2033
- Figure 59: Asia Pacific Cell Preparation and Separation Reagents Revenue (million), by Country 2025 & 2033
- Figure 60: Asia Pacific Cell Preparation and Separation Reagents Volume (K), by Country 2025 & 2033
- Figure 61: Asia Pacific Cell Preparation and Separation Reagents Revenue Share (%), by Country 2025 & 2033
- Figure 62: Asia Pacific Cell Preparation and Separation Reagents Volume Share (%), by Country 2025 & 2033
List of Tables
- Table 1: Global Cell Preparation and Separation Reagents Revenue million Forecast, by Application 2020 & 2033
- Table 2: Global Cell Preparation and Separation Reagents Volume K Forecast, by Application 2020 & 2033
- Table 3: Global Cell Preparation and Separation Reagents Revenue million Forecast, by Types 2020 & 2033
- Table 4: Global Cell Preparation and Separation Reagents Volume K Forecast, by Types 2020 & 2033
- Table 5: Global Cell Preparation and Separation Reagents Revenue million Forecast, by Region 2020 & 2033
- Table 6: Global Cell Preparation and Separation Reagents Volume K Forecast, by Region 2020 & 2033
- Table 7: Global Cell Preparation and Separation Reagents Revenue million Forecast, by Application 2020 & 2033
- Table 8: Global Cell Preparation and Separation Reagents Volume K Forecast, by Application 2020 & 2033
- Table 9: Global Cell Preparation and Separation Reagents Revenue million Forecast, by Types 2020 & 2033
- Table 10: Global Cell Preparation and Separation Reagents Volume K Forecast, by Types 2020 & 2033
- Table 11: Global Cell Preparation and Separation Reagents Revenue million Forecast, by Country 2020 & 2033
- Table 12: Global Cell Preparation and Separation Reagents Volume K Forecast, by Country 2020 & 2033
- Table 13: United States Cell Preparation and Separation Reagents Revenue (million) Forecast, by Application 2020 & 2033
- Table 14: United States Cell Preparation and Separation Reagents Volume (K) Forecast, by Application 2020 & 2033
- Table 15: Canada Cell Preparation and Separation Reagents Revenue (million) Forecast, by Application 2020 & 2033
- Table 16: Canada Cell Preparation and Separation Reagents Volume (K) Forecast, by Application 2020 & 2033
- Table 17: Mexico Cell Preparation and Separation Reagents Revenue (million) Forecast, by Application 2020 & 2033
- Table 18: Mexico Cell Preparation and Separation Reagents Volume (K) Forecast, by Application 2020 & 2033
- Table 19: Global Cell Preparation and Separation Reagents Revenue million Forecast, by Application 2020 & 2033
- Table 20: Global Cell Preparation and Separation Reagents Volume K Forecast, by Application 2020 & 2033
- Table 21: Global Cell Preparation and Separation Reagents Revenue million Forecast, by Types 2020 & 2033
- Table 22: Global Cell Preparation and Separation Reagents Volume K Forecast, by Types 2020 & 2033
- Table 23: Global Cell Preparation and Separation Reagents Revenue million Forecast, by Country 2020 & 2033
- Table 24: Global Cell Preparation and Separation Reagents Volume K Forecast, by Country 2020 & 2033
- Table 25: Brazil Cell Preparation and Separation Reagents Revenue (million) Forecast, by Application 2020 & 2033
- Table 26: Brazil Cell Preparation and Separation Reagents Volume (K) Forecast, by Application 2020 & 2033
- Table 27: Argentina Cell Preparation and Separation Reagents Revenue (million) Forecast, by Application 2020 & 2033
- Table 28: Argentina Cell Preparation and Separation Reagents Volume (K) Forecast, by Application 2020 & 2033
- Table 29: Rest of South America Cell Preparation and Separation Reagents Revenue (million) Forecast, by Application 2020 & 2033
- Table 30: Rest of South America Cell Preparation and Separation Reagents Volume (K) Forecast, by Application 2020 & 2033
- Table 31: Global Cell Preparation and Separation Reagents Revenue million Forecast, by Application 2020 & 2033
- Table 32: Global Cell Preparation and Separation Reagents Volume K Forecast, by Application 2020 & 2033
- Table 33: Global Cell Preparation and Separation Reagents Revenue million Forecast, by Types 2020 & 2033
- Table 34: Global Cell Preparation and Separation Reagents Volume K Forecast, by Types 2020 & 2033
- Table 35: Global Cell Preparation and Separation Reagents Revenue million Forecast, by Country 2020 & 2033
- Table 36: Global Cell Preparation and Separation Reagents Volume K Forecast, by Country 2020 & 2033
- Table 37: United Kingdom Cell Preparation and Separation Reagents Revenue (million) Forecast, by Application 2020 & 2033
- Table 38: United Kingdom Cell Preparation and Separation Reagents Volume (K) Forecast, by Application 2020 & 2033
- Table 39: Germany Cell Preparation and Separation Reagents Revenue (million) Forecast, by Application 2020 & 2033
- Table 40: Germany Cell Preparation and Separation Reagents Volume (K) Forecast, by Application 2020 & 2033
- Table 41: France Cell Preparation and Separation Reagents Revenue (million) Forecast, by Application 2020 & 2033
- Table 42: France Cell Preparation and Separation Reagents Volume (K) Forecast, by Application 2020 & 2033
- Table 43: Italy Cell Preparation and Separation Reagents Revenue (million) Forecast, by Application 2020 & 2033
- Table 44: Italy Cell Preparation and Separation Reagents Volume (K) Forecast, by Application 2020 & 2033
- Table 45: Spain Cell Preparation and Separation Reagents Revenue (million) Forecast, by Application 2020 & 2033
- Table 46: Spain Cell Preparation and Separation Reagents Volume (K) Forecast, by Application 2020 & 2033
- Table 47: Russia Cell Preparation and Separation Reagents Revenue (million) Forecast, by Application 2020 & 2033
- Table 48: Russia Cell Preparation and Separation Reagents Volume (K) Forecast, by Application 2020 & 2033
- Table 49: Benelux Cell Preparation and Separation Reagents Revenue (million) Forecast, by Application 2020 & 2033
- Table 50: Benelux Cell Preparation and Separation Reagents Volume (K) Forecast, by Application 2020 & 2033
- Table 51: Nordics Cell Preparation and Separation Reagents Revenue (million) Forecast, by Application 2020 & 2033
- Table 52: Nordics Cell Preparation and Separation Reagents Volume (K) Forecast, by Application 2020 & 2033
- Table 53: Rest of Europe Cell Preparation and Separation Reagents Revenue (million) Forecast, by Application 2020 & 2033
- Table 54: Rest of Europe Cell Preparation and Separation Reagents Volume (K) Forecast, by Application 2020 & 2033
- Table 55: Global Cell Preparation and Separation Reagents Revenue million Forecast, by Application 2020 & 2033
- Table 56: Global Cell Preparation and Separation Reagents Volume K Forecast, by Application 2020 & 2033
- Table 57: Global Cell Preparation and Separation Reagents Revenue million Forecast, by Types 2020 & 2033
- Table 58: Global Cell Preparation and Separation Reagents Volume K Forecast, by Types 2020 & 2033
- Table 59: Global Cell Preparation and Separation Reagents Revenue million Forecast, by Country 2020 & 2033
- Table 60: Global Cell Preparation and Separation Reagents Volume K Forecast, by Country 2020 & 2033
- Table 61: Turkey Cell Preparation and Separation Reagents Revenue (million) Forecast, by Application 2020 & 2033
- Table 62: Turkey Cell Preparation and Separation Reagents Volume (K) Forecast, by Application 2020 & 2033
- Table 63: Israel Cell Preparation and Separation Reagents Revenue (million) Forecast, by Application 2020 & 2033
- Table 64: Israel Cell Preparation and Separation Reagents Volume (K) Forecast, by Application 2020 & 2033
- Table 65: GCC Cell Preparation and Separation Reagents Revenue (million) Forecast, by Application 2020 & 2033
- Table 66: GCC Cell Preparation and Separation Reagents Volume (K) Forecast, by Application 2020 & 2033
- Table 67: North Africa Cell Preparation and Separation Reagents Revenue (million) Forecast, by Application 2020 & 2033
- Table 68: North Africa Cell Preparation and Separation Reagents Volume (K) Forecast, by Application 2020 & 2033
- Table 69: South Africa Cell Preparation and Separation Reagents Revenue (million) Forecast, by Application 2020 & 2033
- Table 70: South Africa Cell Preparation and Separation Reagents Volume (K) Forecast, by Application 2020 & 2033
- Table 71: Rest of Middle East & Africa Cell Preparation and Separation Reagents Revenue (million) Forecast, by Application 2020 & 2033
- Table 72: Rest of Middle East & Africa Cell Preparation and Separation Reagents Volume (K) Forecast, by Application 2020 & 2033
- Table 73: Global Cell Preparation and Separation Reagents Revenue million Forecast, by Application 2020 & 2033
- Table 74: Global Cell Preparation and Separation Reagents Volume K Forecast, by Application 2020 & 2033
- Table 75: Global Cell Preparation and Separation Reagents Revenue million Forecast, by Types 2020 & 2033
- Table 76: Global Cell Preparation and Separation Reagents Volume K Forecast, by Types 2020 & 2033
- Table 77: Global Cell Preparation and Separation Reagents Revenue million Forecast, by Country 2020 & 2033
- Table 78: Global Cell Preparation and Separation Reagents Volume K Forecast, by Country 2020 & 2033
- Table 79: China Cell Preparation and Separation Reagents Revenue (million) Forecast, by Application 2020 & 2033
- Table 80: China Cell Preparation and Separation Reagents Volume (K) Forecast, by Application 2020 & 2033
- Table 81: India Cell Preparation and Separation Reagents Revenue (million) Forecast, by Application 2020 & 2033
- Table 82: India Cell Preparation and Separation Reagents Volume (K) Forecast, by Application 2020 & 2033
- Table 83: Japan Cell Preparation and Separation Reagents Revenue (million) Forecast, by Application 2020 & 2033
- Table 84: Japan Cell Preparation and Separation Reagents Volume (K) Forecast, by Application 2020 & 2033
- Table 85: South Korea Cell Preparation and Separation Reagents Revenue (million) Forecast, by Application 2020 & 2033
- Table 86: South Korea Cell Preparation and Separation Reagents Volume (K) Forecast, by Application 2020 & 2033
- Table 87: ASEAN Cell Preparation and Separation Reagents Revenue (million) Forecast, by Application 2020 & 2033
- Table 88: ASEAN Cell Preparation and Separation Reagents Volume (K) Forecast, by Application 2020 & 2033
- Table 89: Oceania Cell Preparation and Separation Reagents Revenue (million) Forecast, by Application 2020 & 2033
- Table 90: Oceania Cell Preparation and Separation Reagents Volume (K) Forecast, by Application 2020 & 2033
- Table 91: Rest of Asia Pacific Cell Preparation and Separation Reagents Revenue (million) Forecast, by Application 2020 & 2033
- Table 92: Rest of Asia Pacific Cell Preparation and Separation Reagents Volume (K) Forecast, by Application 2020 & 2033
Frequently Asked Questions
1. What is the projected Compound Annual Growth Rate (CAGR) of the Cell Preparation and Separation Reagents?
The projected CAGR is approximately XX%.
2. Which companies are prominent players in the Cell Preparation and Separation Reagents?
Key companies in the market include BD, Sigma-Aldrich, R&D Systems, Abcam.
3. What are the main segments of the Cell Preparation and Separation Reagents?
The market segments include Application, Types.
4. Can you provide details about the market size?
The market size is estimated to be USD XXX million as of 2022.
5. What are some drivers contributing to market growth?
N/A
6. What are the notable trends driving market growth?
N/A
7. Are there any restraints impacting market growth?
N/A
8. Can you provide examples of recent developments in the market?
N/A
9. What pricing options are available for accessing the report?
Pricing options include single-user, multi-user, and enterprise licenses priced at USD 3950.00, USD 5925.00, and USD 7900.00 respectively.
10. Is the market size provided in terms of value or volume?
The market size is provided in terms of value, measured in million and volume, measured in K.
11. Are there any specific market keywords associated with the report?
Yes, the market keyword associated with the report is "Cell Preparation and Separation Reagents," which aids in identifying and referencing the specific market segment covered.
12. How do I determine which pricing option suits my needs best?
The pricing options vary based on user requirements and access needs. Individual users may opt for single-user licenses, while businesses requiring broader access may choose multi-user or enterprise licenses for cost-effective access to the report.
13. Are there any additional resources or data provided in the Cell Preparation and Separation Reagents report?
While the report offers comprehensive insights, it's advisable to review the specific contents or supplementary materials provided to ascertain if additional resources or data are available.
14. How can I stay updated on further developments or reports in the Cell Preparation and Separation Reagents?
To stay informed about further developments, trends, and reports in the Cell Preparation and Separation Reagents, consider subscribing to industry newsletters, following relevant companies and organizations, or regularly checking reputable industry news sources and publications.
Methodology
Step 1 - Identification of Relevant Samples Size from Population Database


Step 2 - Approaches for Defining Global Market Size (Value, Volume* & Price*)

Note*: In applicable scenarios
Step 3 - Data Sources
Primary Research
- Web Analytics
- Survey Reports
- Research Institute
- Latest Research Reports
- Opinion Leaders
Secondary Research
- Annual Reports
- White Paper
- Latest Press Release
- Industry Association
- Paid Database
- Investor Presentations

Step 4 - Data Triangulation
Involves using different sources of information in order to increase the validity of a study
These sources are likely to be stakeholders in a program - participants, other researchers, program staff, other community members, and so on.
Then we put all data in single framework & apply various statistical tools to find out the dynamic on the market.
During the analysis stage, feedback from the stakeholder groups would be compared to determine areas of agreement as well as areas of divergence